The PSC-17: Subscale Scores,
Reliability, and Factor Structure
in a New National Sample
J. Michael Murphy, EdD, a, b Paul Bergmann, MA, c, d Cindy Chiang, BA, a Raymond Sturner, MD, e Barbara Howard, MD, f Madelaine R. Abel, BA, a Michael Jellinek, MDb
abstract
BACKGROUND: The Pediatric Symptom Checklist-17 (PSC-17) is a widely used, briefer versionof the PSC-35, a parent-completed measure of children’s psychosocial functioning. Despite the extensive use of the PSC-17 over the past 15 years there has not been a large-scale replication of the original derivation study.
OBJECTIVE: To examine the prevalence of positive screens, reliability, and factor structure of PSC-17 scores in a new national sample and compare them with the derivation sample.
METHODS: Data were collected on 80 680 pediatric outpatients, ages 4 to 15 years, whose parents filled out the PSC-17 from 2006 to 2015 via the Child Health and Development Interactive System, an electronic system that presents and scores clinical measures.
RESULTS: The rates of positive screening on the overall PSC-17 (11.6%) and on the
internalizing (10.4%) and attention (9.1%) subscales were comparable to rates found in the original sample, although the rate of externalizing problems (10.2%) was lower than in the derivation study. Reliability was high (internal consistency 0.89; test–retest 0.85), and a confirmatory factor analysis provided support for the original 3-factor model.
CONCLUSIONS: Fifteen years after the PSC-17 was derived in a large nationally representative outpatient pediatric sample, a new and larger national sample found rates of positive screening, reliability, and factor structure that were comparable. Findings from this study support the continued use of the PSC-17 clinically as a screening tool in pediatric settings and in research.
aMassachusetts General Hospital, Boston, Massachusetts; cPrairieCare Institute, Minneapolis, Minnesota; dForesight Logic, Inc, St Paul, Minnesota; eJohns Hopkins University School of Medicine and Center for
Promotion of Child Development Through Primary Care, Baltimore, Maryland; fJohns Hopkins University School
of Medicine and Total Child Health, Baltimore, Maryland; and bHarvard Medical School, Boston, Massachusetts
Dr Murphy conceptualized the study, supervised all data analysis and writing, and reviewed and provided critical revisions to all drafts of the manuscript; Mr Bergmann prepared the dataset, conducted data analyses, and provided critical revisions to the analytic plan and manuscript; Ms Chiang conducted data analyses, wrote the fi rst draft, and contributed to subsequent drafts of the manuscript; Drs Sturner and Howard are the creators of the Child Health and Development Interactive System program and supervised the collection of all data, consulted on the data analysis, and reviewed and provided critical comments on the manuscript; Ms Abel conducted some data analysis and provided critical revisions to the manuscript; Dr Jellinek reviewed and provided critical revisions to all drafts of the manuscript; and all authors approved the fi nal manuscript as submitted.
DOI: 10.1542/peds.2016-0038 Accepted for publication Jun 16, 2016
Address correspondence to J. Michael Murphy, EdD, Child Psychiatry Service, Massachusetts General Hospital, Yawkey 6A, Boston, MA 02114. E-mail: [email protected]
NIH
To cite: Murphy JM, Bergmann P, Chiang C, et al. The PSC-17: Subscale Scores, Reliability, and Factor Structure in a New National Sample. Pediatrics. 2016;138(3):e20160038 WHAT’S KNOWN ON THIS SUBJECT: The Pediatric Symptom Checklist-17 (PSC-17) has been widely used clinically and in research for more than a decade yielding higher rates for detecting psychosocial dysfunction than clinical judgement and case rates comparable to the PSC-35, other psychosocial screens, and semistructured interviews.
Mental health problems are common among children and adolescents, ~13% of whom are estimated to have a problem that impairs functioning. 1–3 Research continues
to show that only about half of these children are identified, 4–6
and only a fraction of them receive mental health services. 7
Since studies have shown that brief assessment tools can improve identification rates of mental health problems in primary care settings, 8–10
national programs (Head Start), 11
professional organizations (American Academy of Pediatrics), 12 blue
ribbon commissions (the National Academy of Science), 7 and the Early
and Periodic Screening Diagnosis and Treatment regulations of the US Medicaid programs 2 have
consistently recommended routine psychosocial screening for youth, especially in the context of the pediatric medical home. One of the most frequently recommended screening measures is the Pediatric Symptom Checklist (PSC). 2 The original version of the
PSC has 35 items and was validated 3 decades ago. 1, 13 The PSC has been
translated into >2 dozen languages and is also available in a briefer version, 3 2 pictorial versions, 14 and
a youth self-report form. 15, 16 The
measure has been widely used in research and clinical settings and has been endorsed by organizations such as Bright Futures Mental Health and the Medicaid programs of several states. 17–20 The PSC is also available
online through its Web site (http:// www. massgeneral. org/ psychiatry/ services/ psc_ home. aspx), the Child Health and Development Interactive System (CHADIS), organizations that provide testing materials (CNS Vital Signs), 21 and mental health advocacy
groups (Mental Health America). 22
The briefer version of the PSC 3 is
broadly used, with >40 published studies. 23 These studies have
shown that the PSC-17 yields higher detection rates than pediatricians
relying on clinical judgment alone 24
and has risk rates comparable to those of the PSC-35, 3 semistructured
interviews (Schedule for Affective Disorders and Schizophrenia for School-Age Children–Present and Lifetime Version), 25 and longer
questionnaire measures. 2 The PSC-17
was derived from the PSC-35 through an exploratory factor analysis conducted on data collected from the 1994 to 1999 Child Behavior Study (CBS), a nationally representative sample of >20 000 pediatric outpatients. 3 In that study, the
exploratory factor analysis suggested that it was possible to create a briefer version of the PSC with 17 of the original 35 items. These 17 items loaded onto 3 distinct factors, which became the 3 subscales of the PSC-17. Several studies have replicated the PSC-17’s 3-factor structure by using confirmatory factor analysis (CFA) in moderate-sized samples, 26, 27 and a
number of studies 28 –37 have reported
on the prevalence of risk by using the overall and subscale scores. However, despite the wide use of the PSC-17 and the passage of >15 years, there have been no replication studies in a large national outpatient pediatric sample. The availability of such a sample made it possible to conduct the current replication study. We hypothesized that, with respect to the original PSC-17 derivation sample, 3 the new sample would
be comparable in reliability, factor structure, and in positive screening, despite the passage of ~15 years.
METHODS
Data for this study were obtained from the CHADIS (https:// www. chadis. com), a Web based clinical process support system that includes >200 different previsit screens supporting comprehensive pediatric care and is available for a licensing fee to clinicians, with unlimited use for patients. Although CHADIS provides some specific decision
support and postvisit engagement, no PSC-specific supports of that kind were available during the study period apart from automated scoring and content-related e-chapters. Automated administration of additional subscale-specific questionnaires (eg, positive PSC anxiety subscale triggering the Screen for Child Anxiety Related Disorders (SCARED) anxiety scale) is now available but was not during the study period. For the current study, deidentified data from all practices that had chosen to use the PSC were available from a central server. Because the analyses used only deidentified data, the study was approved as exempt by the Partners Healthcare institutional review board.
Sample
to auto-assign for behavioral visits and manually add screens at any visit. No demographic data other than gender and age were collected for individual cases; however, practice information suggested that about two-thirds of all practices were primarily suburban, with the remainder about equally split between urban and rural.
The full dataset began with 100 114 cases of patients 0 to 24 years of age. To compare this sample with the original PSC-17 derivation sample, we excluded patients aged 0 to 3 years and 16 to 24 years (n = 8328), leaving 91 786 youth 4 to 15 years of age. Because this study sought to investigate the use of the PSC-17 in a US primary care pediatric population, an additional 11 106 patients screened in the specialty practices of developmental behavioral pediatricians and in 6 practices outside the United States were excluded. The remaining 80 680 patients constituted the primary analytic sample.
For a subsample of 21 940 patients, there were ≥2 PSC-17s, and it was possible to assess longitudinal changes across varying intervals. We selected cases in which a parent had completed a second form 8 to 14 days after the first to assess the test–retest reliability of the PSC-17.
Measures
The PSC-17 total score is designed to evaluate a child’s overall psychosocial functioning. The measure also has subscales
consisting of either 5 or 7 items that can be used to assess functioning in the areas of internalizing, attention, and externalizing problems. Parents are asked to rate each symptom with 0 = never, 1 = sometimes, and 2 = often. Weighted scores for the 17 items are summed to produce a total score ranging from 0 to 34. Higher scores indicate greater risk. Total scores are also recoded dichotomously, based on a validated cutoff score of ≥15 3, 25 on the global
scale to indicate overall mental health risk. Subscale total and categorical scores are calculated in the same manner. Scores of ≥7 indicate risk on both the attention and externalizing subscales, and scores of ≥5 indicate risk on the internalizing subscale.
Analytic Method
By using our primary analytic sample of 80 680 cases, we assessed the prevalence of risk at the first administration of the PSC-17. We used Cronbach’s α to evaluate the item reliability of the total PSC-17 and its 3 subscale scores, and we used the 84 cases whose parents completed a second PSC 8 to 14 days after the first to calculate the intraclass correlation (ICC) between
total scores at the first and repeat administrations. We also evaluated the 3-factor model proposed by Gardner et al 3 for a subset of the
sample consisting of the first administration of the PSC-17 for children aged 4 through 15 years (n = 59 836) by using CFA.
Preliminary tests and assumptions are specified in the Results section devoted to factor analysis.
RESULTS
Sample Characteristics
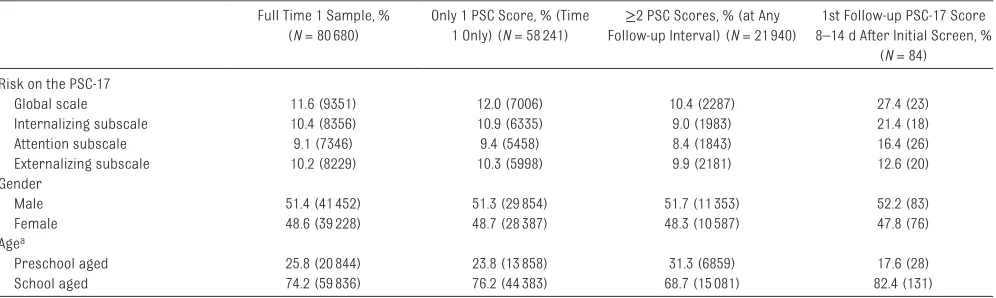
As shown in Table 1, there were 80 680 patients in the 4- to 15-year-old primary analytic sample, and the rate of positive screening scores on the global scale was 11.6%. The PSC internalizing, attention, and externalizing problem subscales had positive screening rates of 10.4%, 9.1%, and 10.2%, respectively. Table 1 also shows the breakdown of the primary analytic sample by gender (51.4% were male) and age group. School-aged children (6–15 years old) made up most (74.2%) of the sample, and preschool-aged children (ages 4 and 5) accounted for the rest. Table 1 also provides information on the 58 241 subjects with a single PSC-17 and Time 1 information for all 21 940 cases with a follow-up PSC-17 at any time point. Similar data are presented on the Time 1 scores of all
TABLE 1 Positive Screening Rates and Demographic Breakdowns for Full Samples and Subsamples Based on Presence and Interval of Longitudinal Follow-up
Full Time 1 Sample, % (N = 80 680)
Only 1 PSC Score, % (Time 1 Only) (N = 58 241)
≥2 PSC Scores, % (at Any Follow-up Interval) (N = 21 940)
1st Follow-up PSC-17 Score 8–14 d After Initial Screen, %
(N = 84) Risk on the PSC-17
Global scale 11.6 (9351) 12.0 (7006) 10.4 (2287) 27.4 (23)
Internalizing subscale 10.4 (8356) 10.9 (6335) 9.0 (1983) 21.4 (18)
Attention subscale 9.1 (7346) 9.4 (5458) 8.4 (1843) 16.4 (26)
Externalizing subscale 10.2 (8229) 10.3 (5998) 9.9 (2181) 12.6 (20)
Gender
Male 51.4 (41 452) 51.3 (29 854) 51.7 (11 353) 52.2 (83)
Female 48.6 (39 228) 48.7 (28 387) 48.3 (10 587) 47.8 (76)
Agea
Preschool aged 25.8 (20 844) 23.8 (13 858) 31.3 (6859) 17.6 (28)
School aged 74.2 (59 836) 76.2 (44 383) 68.7 (15 081) 82.4 (131)
subjects who had a second PSC-17 and for the 84 subjects who had a follow-up PSC-17 8 to 14 days after the first, the time window we chose for our test–retest analyses.
Psychosocial Functioning and Risk Factor Groups
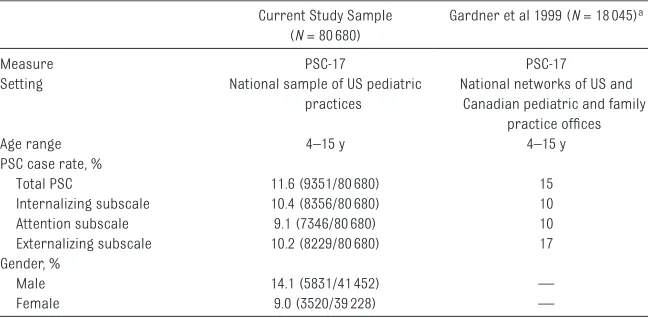
Table 2 presents data on the positive screening rates for the overall PSC-17 and its subscales from the current study along with comparative data from the original PSC-17 derivation study. 3 Data from the current study
are broken out separately for the preschool- and school-aged age groups, with the same age cutoffs that were used in the original derivation study. Table 2 shows the positive screening rates for Time 1 for all 80 680 patients ages 4 through 15 in our primary analytical sample and the positive screening rates for patients ages 4 through 15 in the original derivation sample. 3 In
contrast to the positive screening rate of 11.6% in the current sample, the overall PSC-17 positive screening rate reported in the original study was 15% (z = −12.61; P < .001). The prevalence rate for positive screens on the internalizing subscale in the current study is similar to that of the original derivation sample1
(10.4% vs 10%, z = 1.60; P = .110). The difference in positive screening rates on the attention subscale in
the 2 samples was small (9.1% current study vs 10% original study,
z = −3.77; P < .001) but statistically significant. The rate of positive screening on the externalizing subscale in the current study (10.2%) was substantially lower than the rate of 17% reported in the original study (z = −25.94; P < .001).
Although the original Gardner et al 3 PSC-17 study did not give a
breakdown of positive screening rates by gender, we present it here for the current sample. The last 2 rows of Table 2 show that boys were more likely to screen positive than girls (14.1% vs 9.0%; z = 22.59; P < .001, 95% confidence interval [CI], 0.047–0.055).
PSC-17 Reliability
In the current Time 1 sample of 80 680 children aged 4 to 15 ( Table 2), Cronbach’s α for the overall PSC-17 was 0.87, and for the internalizing, attention, and externalizing subscales αs were 0.78, 0.82, and 0.80, respectively. In the original derivation study 3
these figures were 0.89 for the overall scale and 0.79, 0.83, and 0.83 for internalizing, attention, and externalizing problem subscales. Using the scores of 84 patients whose parents had completed a second PSC from 8 to 14 days after the first, the test–retest reliability of the PSC-17
in the current sample was assessed through ICC. The ICC between the overall PSC-17 scores at Time 1 and Time 2 (8–14 days later) was 0.85 (F[83, 83] = 12.46, P < .001). The ICCs between the Time 1 and Time 2 scores for the internalizing, attention, and externalizing subscales were 0.76 (F[83, 83] = 7.48, P < .001), 0.83 (F[83, 83] = 10.92, P < .001), and 0.82 (F[83, 83] = 10.08, P < .001), respectively.
Factor Structure of the PSC-17
All items loaded on exactly 1 factor, and all measurement error was presumed to be uncorrelated. The latent variables (internalizing, attention, and externalizing) were allowed to be correlated. As a result, the model was overidentified, with 116 df. There were no cases with missing data because of the online method used. The data were evaluated for multivariate outliers via the Blocked Adaptive Computationally efficient Outlier Nominators (BACON) algorithm. 38
An outlier was defined as a case whose multivariate distance from the median was greater than or equal to the 85th percentile of the χ2
distribution. There were no outliers in the data. The data were also tested for normality and were found to be multivariate nonnormal and heavily skewed right.
Because of the multivariate nonnormality of the data and the ordinal, noncontinuous nature of the item data, the CFA model was specified via a polychoric correlation matrix and asymptotic covariance matrix and an unweighted least squares estimation method. 39, 40The
matrices were generated in PRELIS 9.2 and analyzed with LISREL 9.2 41
and are available on request.
Goodness of fit was evaluated via the Satorra–Bentler scaled χ2 statistic,
standardized root mean square residual (SRMR), root mean square error of approximation (RMSEA) and its 90% CI, comparative fit index
TABLE 2 Rates of Positive Screening in the Current and Original Derivation Samples Current Study Sample
(N = 80 680)
Gardner et al 1999 (N = 18 045)a
Measure PSC-17 PSC-17
Setting National sample of US pediatric
practices
National networks of US and Canadian pediatric and family
practice offi ces
Age range 4–15 y 4–15 y
PSC case rate, %
Total PSC 11.6 (9351/80 680) 15
Internalizing subscale 10.4 (8356/80 680) 10
Attention subscale 9.1 (7346/80 680) 10
Externalizing subscale 10.2 (8229/80 680) 17
Gender, %
Male 14.1 (5831/41 452) —
Female 9.0 (3520/39 228) —
(CFI), and the Tucker–Lewis index (TLI). Multiple indices were used to evaluate different aspects of model fit (ie, absolute fit, fit adjusting for model parsimony, fit relative to a null model). Hu and Bentler 42 suggested
that an acceptable model fit is defined by the following criteria: χ2
(P < .05), RMSEA (≤0.06, 90% CI LB
≤0.06), SRMR (≤0.08), CFI (≥0.95), and TLI (≥0.95).
As expected given the very large sample size, the χ2 test was
significant (χ2 = 22 996.62, 116 df, P < .001), indicating that the model estimates do not exactly reproduce the sample variances and covariances. SRMR (0.064) provided a measure of absolute fit; RMSEA (0.104; 90% CI, 0.104–0.105) provided a measure of fit adjusting for model parsimony; CFI (0.89) and TLI (0.87) provided measures of comparative fit. Completely standardized parameter estimates from the solution are presented in Supplemental Table 3. All freely estimated unstandardized parameters were statistically significant (P < .001). Factor loading estimates revealed that the indicators were moderately to strongly related to their purported factors (range of
R2 0.40–0.81), consistent with the
position that the PSC-17 items are reliable indicators of the constructs of internalizing, attention, and externalizing. Estimates from the 3-factor solution indicate moderately strong relationships between the 3 dimensions (available in Supplemental Table 4).
DISCUSSION
The current study provides evidence from a large national pediatric primary care sample that the rates of risk and reliability of the PSC-17 found in the current sample were comparable to those reported in the original derivation study collected about 15 years earlier and that the
previously identified factor structure fit the current data reasonably well. The greatest difference between the current and the original PSC-17 derivation samples was on the externalizing subscale, which had a positive screening rate of 10.2% in the current sample and 17% in the original sample. This difference could be a result of differences in sampling, secular trends, or other factors. Although the current dataset collected little demographic data on individual cases, information from the practices showed a very high percentage of suburban practices in the current sample, suggesting the possibility that the overall socioeconomic status of these subjects might be much higher than it was in the original PSC-17 sample. 1
As noted in previous studies with the PSC 43 and other measures, 9, 13, 44, 45 the
rate of positive screening, especially for externalizing problems, is usually higher in lower–socioeconomic status populations. The slightly lower rate of overall positive screening (11.6% currently vs 15% originally) is small and appears to result primarily from the much lower rate of externalizing problems in the current sample because the rates of internalizing and attention problems were almost identical. Because the derivation study used a nationally representative sample and the current study used a sample of convenience, we believe that the original norms may still provide the most accurate estimate of prevalence in the general outpatient pediatric population.
Internal consistency reliability in the current study (0.87 for the overall PSC-17) was similar to that reported in the derivation sample (0.89), and the test–retest reliability was high (0.89). In the CFA, with the exception of SRMR, all goodness of fit indices failed to meet the predefined criteria for acceptable fit. In suggesting these criteria, Hu and Bentler 42 were
careful to specify that measures of
fit should be “close to” the suggested cutoff points, because all these measures are affected by study characteristics such as sample size, estimation method, normality of data, data type, and model complexity. It is beyond the scope of this article to thoroughly investigate the impact of these on the measures of fit. However, when they are considered together and in the context of current study characteristics, the 3-factor model appears to have adequate fit. 46–48 Overall, parameter estimates
and correlations of items to factors and between factors are consistent with expectations.
Although the lack of case-specific socioeconomic data is a limitation of this study, other than the prevalence-of-risk findings, which have been shown to be sensitive to socioeconomic differences, the reliability and CFA findings reported in this study are statistically meaningful even in nonrepresentative samples. The current study provides strong evidence supporting the continued use of the PSC-17 as a brief psychosocial screen for children and adolescents in primary care. In replicating the prevalence and reliability, and confirming the factor structure of the PSC-17 subscale scores, the current study makes an important contribution because both pediatric and mental health clinicians often report the usefulness of having subscale scores from the 3 different domains of the PSC-17. Beyond their clinical usefulness, the subscale scores have been shown to be a convenient metric for tracking treatment and quality assurance. 49–51
generate a diagnosis or treatment in the absence of additional data is not appropriate. Automated pass-through to more diagnostic questionnaires based on subscale scores on the PSC-17 recently available in the online system used in this study is a promising approach to facilitate additional evaluation.
CONCLUSIONS
This study replicated in a new, large national sample findings from a derivation sample collected about 15 years earlier and therefore supports the continued use of the PSC-17 as a measure of psychosocial functioning
in pediatric primary care and research.
ACKNOWLEDGMENTS
The authors gratefully acknowledge the support of the Fuss Family Fund. Research data collection reported in this publication was supported by National Institutes of Mental Health of the National Institutes of Health under award number R44MH086302. The content is solely the responsibility of the authors and does not necessarily represent the official views of the National Institutes of Health.
ABBREVIATIONS
CBS: Child Behavior Study CFA: confirmatory factor
analysis
CFI: comparative fit index CHADIS: Child Health and
Development Interactive System CI: confidence interval ICC: intraclass correlation PSC: Pediatric Symptom Checklist RMSEA: root mean square error
of approximation SRMR: standardized root mean
square residual TLI: Tucker–Lewis index
PEDIATRICS (ISSN Numbers: Print, 0031-4005; Online, 1098-4275). Copyright © 2016 by the American Academy of Pediatrics
FINANCIAL DISCLOSURE: Drs Sturner and Howard are the creators and owners of the Child Health and Development Interactive System and receive salary from its licensing and use. Mr Bergmann has consulted for Total Child Health, Inc, through his company Foresight Logic but has received no funding for this study. The other authors have no fi nancial relationships relevant to this article to disclose.
FUNDING: Funding for the data analysis and writing of this article was provided by the Fuss Family Fund. Research data collection reported in this publication was supported by National Institutes of Mental Health of the National Institutes of Health under award number R44MH086302. The content is solely the responsibility of the authors and does not necessarily represent the offi cial views of the National Institutes of Health. Funded by the National Institutes of Health (NIH).
POTENTIAL CONFLICT OF INTEREST: Raymond Sturner and Barbara Howard are the creators and owners of the Child Health and Development Interactive System and receive salary from its licensing and use. The other authors have no confl icts of interest relevant to this article to disclose.
REFERENCES
1. Jellinek MS, Murphy JM, Little M, Pagano ME, Comer DM, Kelleher KJ. Use of the Pediatric Symptom Checklist to screen for psychosocial problems in pediatric primary care: a national feasibility study. Arch Pediatr Adolesc Med. 1999;153(3):254–260
2. Semansky RM, Koyanagi C, Vandivort-Warren R. Behavioral health screening policies in Medicaid programs nationwide. Psychiatr Serv. 2003;54(5):736–739
3. Gardner W, Murphy M, Childs G, et al. The PSC-17: a brief pediatric symptom checklist with psychosocial problem subscales. A report from PROS and ASPN. Ambul Child Health. 1999;5(3):225–236
4. Sayal K, Taylor E. Detection of child mental health disorders by general practitioners. Br J Gen Pract. 2004;54(502):348–352
5. Sheldrick RC, Merchant S, Perrin EC. Identifi cation of developmental– behavioral problems in primary care: a systematic review. Pediatrics. 2011;128(2):356–363
6. Simonian SJ, Tarnowski KJ. Utility of the Pediatric Symptom Checklist for behavioral screening of disadvantaged children. Child Psychiatry Hum Dev. 2001;31(4):269–278
7. O’Connell ME, Boat T, Warner KE.
Preventing Mental, Emotional, and Behavioral Disorders Among Young
People: Progress and Possibilities.
Washington, DC: National Academies Press; 2009
8. Cassidy LJ, Jellinek MS. Approaches to recognition and management of childhood psychiatric disorders in pediatric primary care. Pediatr Clin
North Am. 1998;45(5):1037–1052
9. Hacker KA, Penfold R, Arsenault L, Zhang F, Murphy M, Wissow L. Screening for behavioral health issues in children enrolled in Massachusetts Medicaid. Pediatrics. 2014;133(1):46–54
10. Kolko DJ, Campo JV, Kelleher K, Cheng Y. Improving access to care and clinical outcome for pediatric behavioral problems: a randomized trial of a nurse-administered intervention in primary care. J Dev
Behav Pediatr. 2010;31(5):393–404
11. Jellinek MS, Bishop-Josef SJ, Murphy M, Zigler EF. Mental health in Head Start: leave no child behind. NHSA
Dialog. 2005;8(1):25–35
12. Appendix S4: the case for routine mental health screening. Pediatrics. 2010;125(suppl 3):S133–S139
outpatient pediatric practice.
J Pediatr. 1986;109(2):371–378
14. Leiner MA, Balcazar H, Straus DC, Shirsat P, Handal G. Screening Mexicans for psychosocial and behavioral problems during pediatric consultation. Rev Invest Clin. 2007;59(2):116–123
15. Pagano ME, Cassidy LJ, Little M, Murphy JM, Jellinek MS. Identifying psychosocial dysfunction in school-age children: the Pediatric Symptom Checklist as a self-report measure.
Psychol Sch. 2000;37(2):91–106
16. Gall G, Pagano ME, Desmond MS, Perrin JM, Murphy JM. Utility of psychosocial screening at a school-based health center. J Sch Health. 2000;70(7):292–298
17. Massachusetts Behavioral Health Partnership. Clinical Outcomes Management Protocol: Performance
Specifi cations and Phase-In Timelines.
Boston, MA: Massachusetts Behavioral Health Partnership; 2004
18. Minnesota Department of Health. Instruments at a glance for clinics and providers. 2007. Available at: www. health. state. mn. us/ divs/ cfh/ topic/ devscreening/ content/ document/ pdf/ glanceprov. pdf
19. Harrison M, Wong J, DellaBella P, Zusman R, Delehanty M. Validity of the Pediatric Symptom Checklist in Developmental Disabilities Clinic
Settings. New York, NY: Department of
Health and Mental Hygiene; 2006
20. Tennessee Department of Mental Health and Developmental Disabilities. Best Practice Guidelines: Behavioral Health Services for Children and Adolescents: Ages 6–17. 2007. Available at: http:// state. tn. us/ mental/ 07BestPractGuide_ C& A_. pdf
21. CNS Vital Signs. 2016. Available at: https:// sync. cnsvs. com/ pscscreen. html. Accessed January 4, 2016
22. Mental Health America. Available at: www. mentalhealthameri ca. net/ mental- health- screening- tools. Accessed January 4, 2016
23. Murphy JM. Review of Research on the PSC-17 Pediatric Symptom Checklist. 2015. Available at: www. massgeneral. org/ psychiatry/ services/ psc_ 17. Accessed January 4, 2016
24. Wren FJ, Scholle SH, Heo J, Comer DM. Pediatric mood and anxiety syndromes in primary care: who gets identifi ed?
Int J Psychiatry Med. 2003;33(1):1–16
25. Gardner W, Lucas A, Kolko DJ, Campo JV. Comparison of the PSC-17 and alternative mental health screens in an at-risk primary care sample.
J Am Acad Child Adolesc Psychiatry.
2007;46(5):611–618
26. Blucker RT, Jackson D, Gillaspy JA, Hale J, Wolraich M, Gillaspy SR. Pediatric behavioral health screening in primary care: a preliminary analysis of the Pediatric Symptom Checklist-17 with functional impairment items. Clin
Pediatr (Phila). 2014;53(5):449–455
27. Stoppelbein L, Greening L, Moll G, Jordan S, Suozzi A. Factor analyses of the Pediatric Symptom Checklist-17 with African-American and Caucasian pediatric populations. J Pediatr
Psychol. 2012;37(3):348–357
28. Campo JV, Bridge J, Ehmann M, et al. Recurrent abdominal pain, anxiety, and depression in primary care. Pediatrics. 2004;113(4):817–824
29. Campo JV, Comer DM, Jansen-Mcwilliams L, Gardner W, Kelleher KJ. Recurrent pain, emotional distress, and health service use in childhood.
J Pediatr. 2002;141(1):76–83
30. Febres J, Shorey RC, Zucosky HC, et al. The relationship between male-perpetrated interparental aggression, paternal characteristics, and child psychosocial functioning. J Child Fam Stud. 2014;23(5):907–916
31. Ferguson CJ, Olson CK. Video game violence use among “vulnerable” populations: the impact of violent games on delinquency and bullying among children with clinically elevated depression or attention defi cit symptoms. J Youth Adolesc. 2014;43(1):127–136
32. Flake EM, Davis BE, Johnson PL, Middleton LS. The psychosocial effects of deployment on military children.
J Dev Behav Pediatr. 2009;30(4):271–278
33. Jordan SS, Hilker KA, Stoppelbein L, Elkin TD, Applegate H, Iyer R. Nocturnal enuresis and psychosocial problems in pediatric sickle cell disease and sibling controls. J Dev Behav Pediatr. 2005;26(6):404–411
34. Marks KP, Page Glascoe F, Macias MM. Enhancing the algorithm for developmental–behavioral surveillance and screening in children 0 to 5 years.
Clin Pediatr (Phila). 2011;50(9):853–868
35. Palermo TM, Childs G, Burgess ES, Kaugars AS, Comer D, Kelleher K. Functional limitations of school-aged children seen in primary care. Child
Care Health Dev. 2002;28(5):379–389
36. Scholle SH, Gardner W, Harman J, Madlon-Kay DJ, Pascoe J, Kelleher K. Physician gender and psychosocial care for children: attitudes, practice characteristics, identifi cation, and treatment. Med Care. 2001;39(1):26–38
37. Tham SW, Palermo TM, Vavilala MS, et al. The longitudinal course, risk factors, and impact of sleep disturbances in children with traumatic brain injury. J Neurotrauma. 2012;29(1):154–161
38. Billor N, Hadi AS, Velleman PF. BACON: blocked adaptive computationally effi cient outlier nominators. Comput
Stat Data Anal. 2000;34(3):279–298
39. Forero CG, Maydeu-Olivares A, Gallardo-Pujol D. Factor analysis with ordinal indicators: a Monte Carlo study comparing DWLS and ULS estimation. Struct Equ Modeling. 2009;16(4):625–641
40. Muthén B. Goodness of fi t with categorical and other nonnormal variables. In: Bollen KA, Long JS, eds.
Testing Structural Equation Models.,
1st ed. Thousand Oaks, CA: SAGE Publications; 1993:205
41. Jöreskog K, Sörbom D. LISREL 9.2 for Windows [Computer software]. Skokie, IL: Scientifi c Software International Inc; 2015
42. Hu LT, Bentler PM. Cutoff criteria for fi t indexes in covariance structure analysis: conventional criteria versus new alternatives. Struct Equation
Model. 1999;6(1):1–55
43. Zenlea IS, Burton ET, Askins N, Pluhar EI, Rhodes ET. The burden of psychosocial stressors and urgent mental health problems in a pediatric weight management program. Clin
Pediatr (Phila). 2015;54(13):1247–1256
a low-income, Mexican American population. Arch Pediatr Adolesc Med. 2003;157(12):1169–1176
45. Erdogan S, Ozturk M. Psychometric evaluation of the Turkish version of the Pediatric Symptom Checklist-17 for detecting psychosocial problems in low-income children. J Clin Nurs. 2011;20(17–18):2591–2599
46. Browne MW, Cudeck R, Bollen KA, Long JS. Alternative ways of assessing model fi t. SAGE Focus Editions.
1993;154:136–136
47. MacCallum RC, Browne MW, Sugawara HM. Power analysis and determination of sample size for covariance structure modeling. Psychol Methods. 1996;1(2):130–149
48. Brown TA. Confi rmatory Factor
Analysis for Applied Research. New
York, NY: Guilford Press; 2015
49. Kamin HS, McCarthy AE, Abel MR, Jellinek MS, Baer L, Murphy JM. Using a brief parent-report measure to track outcomes for children and teens with internalizing
disorders. Child Psychiatry Hum Dev. 2015;46(6):851–862
50. McCarthy A, Asghar S, Wilens T, et al. Using a Brief Parent-Report Measure to Track Outcomes for Children and Teens with ADHD. Child Psychiatry Hum Dev. 2016;47(3):407–416
51. Murphy JM, Blais M, Baer L, et al. Measuring outcomes in outpatient child psychiatry: reliable improvement, deterioration, and clinically signifi cant improvement. Clin Child Psychol
DOI: 10.1542/peds.2016-0038 originally published online August 12, 2016;
2016;138;
Pediatrics
Howard, Madelaine R. Abel and Michael Jellinek
J. Michael Murphy, Paul Bergmann, Cindy Chiang, Raymond Sturner, Barbara
National Sample
The PSC-17: Subscale Scores, Reliability, and Factor Structure in a New
Services
Updated Information &
http://pediatrics.aappublications.org/content/138/3/e20160038
including high resolution figures, can be found at:
References
http://pediatrics.aappublications.org/content/138/3/e20160038#BIBL
This article cites 40 articles, 5 of which you can access for free at:
Subspecialty Collections
y_sub
http://www.aappublications.org/cgi/collection/psychiatry_psycholog Psychiatry/Psychology
following collection(s):
This article, along with others on similar topics, appears in the
Permissions & Licensing
http://www.aappublications.org/site/misc/Permissions.xhtml
in its entirety can be found online at:
Information about reproducing this article in parts (figures, tables) or
Reprints
http://www.aappublications.org/site/misc/reprints.xhtml
DOI: 10.1542/peds.2016-0038 originally published online August 12, 2016;
2016;138;
Pediatrics
Howard, Madelaine R. Abel and Michael Jellinek
J. Michael Murphy, Paul Bergmann, Cindy Chiang, Raymond Sturner, Barbara
National Sample
The PSC-17: Subscale Scores, Reliability, and Factor Structure in a New
http://pediatrics.aappublications.org/content/138/3/e20160038
located on the World Wide Web at:
The online version of this article, along with updated information and services, is
http://pediatrics.aappublications.org/content/suppl/2016/08/10/peds.2016-0038.DCSupplemental
Data Supplement at:
by the American Academy of Pediatrics. All rights reserved. Print ISSN: 1073-0397.