Published in J Mater Sci, 2007, Vol 42, pp. 483-489 DOI 10.1007/s10853-006-1067-7
Activation energy determination for linear heating experiments: deviations due to
neglecting the low temperature end of the temperature integral
M.J. Starink
Materials Research Group, School of Engineering Sciences, University of Southampton, Southampton S017 1BJ, UK
Keywords: thermally activated reaction; activation energy; thermal analysis; linear heating; curing
Submitted: 28 July 2005 / Accepted: 18 January 2006
Abstract
Model-free isoconversion methods which use approximations of the temperature integral are generally reliable methods for the calculation of activation energies of thermally activated reactions studied during linear heating. These methods generally neglect the temperature integral at the start of the linear heating, I(To). An analytical equation is
derived which describes the deviations introduced by this approximation. It is shown that for most reactions encountered this assumption does not have a significant influence on the accuracy of the method. However, in cases where To is within about 50 to 70K of the reaction stage to
be investigated and activation energies are relatively low, significant deviations are introduced. It is shown that some of the published thermal analysis work on activation energy analysis of reactions occurring at relatively low temperatures is affected by these deviations. Examples are specific cases of dehydration reactions, cure reactions and cluster formation in Al alloys.
1. Introduction
A general objective of the analysis and prediction of thermally activated reactions is the derivation of a complete description of the progress of a reaction that is valid for any thermal treatment, be it isothermal, by linear heating or any other non-isothermal treatment [1,2,3]. As any given reaction might progress through a range of mechanisms and intermediate stages, all of which can have a different temperature-dependency, this aim can be difficult to achieve. Hence, many researchers make the simplifying assumption that the transformation rate during a reaction is the product of two functions, one depending solely on the temperature,
T, and the other depending solely on the fraction transformed, α[4,5]:
) ( ) ( k T f dt
dα= α (1)
The temperature dependent function is generally assumed to follow an Arrhenius type dependency [6,7].
⎟ ⎠ ⎞ ⎜ ⎝ ⎛− =
RT E k
k oexp
(2)
Thus, to describe the progress of the reaction at all temperatures and for all temperature-time programmes within these assumptions, the function f(α), and the constants ko and E need to be determined. For
non-isothermal experiments, the reaction rate at all times depends on both f(α) and k(T), and the determination of f(α), ko and E (the so-called kinetic triplet) is an interlinked problem (see e.g. [8]). A deviation in the determination of any of the three will cause a deviation in the other parameters of the triplet. Reliable analysis methods generally start by deriving the activation energy using a model-free analysis method [9], i.e. a method which makes no presumptions of f(α).
It has been shown that for analysis of linear heating experiments (heating at constant rate), highly accurate and reliable activation energy analysis methods can be obtained by applying accurate approximations of the temperature integral [10]. This derivation can be formulated as follows. Eq. (2) is inserted in Eq. (1) and this is integrated by separation of variables [10]:
⎥ ⎥ ⎦ ⎤ ⎢
⎢ ⎣ ⎡
⎟⎟ ⎠ ⎞ ⎜⎜ ⎝ ⎛ − − ⎟⎟ ⎠ ⎞ ⎜⎜ ⎝ ⎛ − =
⎟⎟ ⎠ ⎞ ⎜⎜ ⎝ ⎛ −
=
∫
∫
∫
∫
f f o Tf ToT
To o T
To
dT RT
E dT
RT E k
dT RT
E k
f d
0 0
exp exp
exp )
(α β β
α
(3)
where Tf is the temperature at an equivalent (fixed) state of
transformation, To is the start temperature of the linear
on the right hand side are generally termed temperature integrals (or ‘Arrhenius integral’). We can write Eq. 3 as:
[
( ) ( )]
)
( f o
o T
To
T I T I k f
d f
− =
∫
α
α
β
(4)
where I(To), I(Tf) are the temperature integrals on the right
hand side of Eq. 3.
The derivation proceeds by noting that of the last two terms, one is much smaller than the other
∫
∫
⎜⎜⎝⎛− ⎟⎟⎠⎞ << ⎜⎜⎝⎛− ⎟⎟⎠⎞ fT To
dT RT
E dT
RT E
0 0
exp
exp (5)
or I(To)<<I(Tf). And hence I(To), the smaller term in Eq. 4, is
neglected. Thus it follows that:
⎥ ⎥ ⎦ ⎤ ⎢
⎢ ⎣ ⎡
⎟⎟ ⎠ ⎞ ⎜⎜ ⎝
⎛−
≅
∫
∫
f o TfT
To
dT RT
E k
f d
0
exp )
(α β
α (6)
Through applying a suitable approximation for the temperature integral on the right of the latter equation a range of well-known and lesser known isoconversion methods for activation energy analysis can be derived [10]. These methods include the Kissinger method [11], the Kissinger-Akahira-Sunose (KAS) method [12,13] (also termed the generalised Kissinger method), the Flynn-Wall-Ozawa (FWO) method [14,15], a method described by Vyazovkin and co-workers [16,17] and 3 highly accurate methods developed by the present author [10,18,19]. All of these methods involve the plotting of 1/Tf vs. a logarithmic
function which depends on the heating rate and often the temperature and all of these methods neglect the last integral term in Eq. 3 (I(To) in Eq. 4). The general equation is:
C RT
E A
Tf f
+ −
= κ
β
ln (7)
where κ is a constant depending on the approximation of the temperature integral employed [1], and A and C are constants. For the above mentioned methods κ equals 0 (FWO method), 2 (KAS method) and 1.9 to 1.95 for the methods by Starink [10]. Whilst all of these works [9-18] (and a vast range of other works) imply that the approximation involved in neglecting I(To) is appropriate, it
appears that the actual influence of this approximation on the analysed activation energy values has never been
quantitatively determined. The aim of the present short paper is to investigate the accuracy of this approximation.
2 Analysis
In derivation of isoconversion methods it is generally assumed that I(To)<<I(Tf) and I(To) is subsequently
neglected. However, it can be shown that in a limited number of cases this is not justified, and in this section we will derive an expression for the deviations in measured E
introduced as a consequence of neglecting I(To).
We will specifically analyse the case where two experiments at two different heating rates, β1, β2, are conducted. If a
larger range of experiments are performed the analysis should be valid in good approximations provided β1, β2, are
taken as the upper and lower heating rate considered. From Eq. 4 follows that if a certain fixed state of the reaction is attained at the two different heating rates:
[
( ) ( )]
[
( 2) ( )]
21 1
o f
o o f
o I T I T k I T I T
k
− =
−
β
β (8)
Where Tf1 is the temperature at which the fixed state is
reached at heating rate β1 and Tf2 is the temperature at which
the same fixed state is reached at heating rate β2 . From the
latter equation follows:
) ( ) (
) ( ) (
1 2 1 2
o f
o f
T I T I
T I T I
− − =
β
β (9)
and
) ( ) ( 1
) ( ) ( 1
) (
) (
1 2 1
2 1
2
f o
f o
f f
T I T I
T I T I
T I
T I
− − =
β
β (10)
For further evaluation of the temperature integrals, we will employ Doyle’s approximation:
) 00484
. 0 ( ) /
exp( 1.0516
0
RT E T
e R
E dT RT
E ≈ −
−
∫
(11)[
2 1]
1 2 / 1 / 1 0516 . 1 ) ( ) (ln f f
f f T T R E T I T I − ×
≈ (12)
Combining the latter equation with Eq. 10 provides:
[
2 1]
12
1 2 1
2 1.0516 1/ 1/
) ( ) ( ln ) ( ) ( 1 ) ( ) ( 1 ln
ln f f
f f f o f o T T R E T I T I T I T I T I T I − × ≅ = − − − β β (13)
The aim of this paper is to investigate the consequences of neglecting I(To), using I(To)<<I(Tf1), I(Tf2). If we were to do
this the latter equation would simplify to:
[
2 1]
1 2 1
2 1.0516 1/ 1/
) (
) ( ln
ln f f
u f f T T R E T I T I − × ≅ = β
β (14)
Where Eu stands for the activation energy obtained from an
analysis in which I(To) is neglected. (The latter equation is
essentially the Flynn-Wall-Ozawa method [14,15].) Taking the difference of the latter two equations provides:
[
2 1]
1
2 1.0516 1/ 1/
) ( ) ( 1 ) ( ) ( 1
ln f f
f o f o T T R E T I T I T I T I − × Δ ≅ −
− (15)
Where ΔE = Eu – E, the error in E introduced by neglecting I(To). As long as I(To) is small compared to I(Tf1) and I(Tf2) it
is justified to make a first order approximation:
⎟ ⎟ ⎠ ⎞ ⎜ ⎜ ⎝ ⎛ ⎥ ⎥ ⎦ ⎤ ⎢ ⎢ ⎣ ⎡ − − − ⎟ ⎟ ⎠ ⎞ ⎜ ⎜ ⎝ ⎛ ⎥ ⎥ ⎦ ⎤ ⎢ ⎢ ⎣ ⎡ − − ≅ − ≅ ⎥⎦ ⎤ ⎢⎣ ⎡ + − ≅ − − o f o f f o f o f o f o f o f o T T R E T T R E T I T I T I T I T I T I T I T I T I T I T I T I 1 1 0516 . 1 exp 1 1 0516 . 1 exp ) ( ) ( ) ( ) ( ) ( ) ( ) ( ) ( 1 ln ) ( ) ( 1 ) ( ) ( 1 ln 1 2 2 1 2 1 1 2 (16)
Where the last step of the above derivation is achieved by employing Eq. 12.
Thus we obtain:
⎟ ⎟ ⎠ ⎞ ⎜ ⎜ ⎝ ⎛ − ⎟ ⎟ ⎠ ⎞ ⎜ ⎜ ⎝ ⎛ ⎥ ⎥ ⎦ ⎤ ⎢ ⎢ ⎣ ⎡ − − − ⎟ ⎟ ⎠ ⎞ ⎜ ⎜ ⎝ ⎛ ⎥ ⎥ ⎦ ⎤ ⎢ ⎢ ⎣ ⎡ − − ≅ Δ 1 2 1 2 1 1 0516 . 1 1 1 0516 . 1 exp 1 1 0516 . 1 exp f f o f o f T T T T R E T T R E R E (17)
From the latter equation we can see that the deviation ΔE
introduced by neglecting I(To) can be calculated in a direct
and straightforward equation. ΔE is a function of To, Tf1, Tf2
and E, where Tf1 and Tf2 are a function of β1and β2,
respectively.
The temperature differential (Tf2-Tf1) depends on E, β1and β2, and in practical cases (Tf2-Tf1) is between about 10
and 50K. Analysis of Eq. 17 will show that under these conditions E, To and the difference between Tf1 and To are the
dominant parameters determining ΔE. Thus, unless otherwise noted, we will generally set (Tf2-Tf1)=30K, which
will limit the number of independent variables that need to be considered.
3 Experimental
Most of the data presented below is taken from recent literature, and in addition an Al-1.21at%Cu-1.19at%Mg-0.20%Mn alloy has been studied. Details on production route for this alloy are given in Ref. [20]. After solution treatment at 768K, water quenching and stretching by 2.5%, the alloy was left at room temperature for a few months before further ageing at 423K. Differential Scanning Calorimetry (DSC) experiments were conducted using a Perkin-Elmer Pyris 1 in nitrogen atmosphere at a constant heating rate of 10K/min, using disc-shaped DSC samples with a thickness of about 0.9 mm and diameter 5mm. All runs were corrected by subtracting the baseline of the DSC, which was obtained from a run with an empty pan as reference. Further baseline correction procedures are outlined in Ref. [1].
4 Evaluation and Application
4.1 General assessment of consequences of
neglecting I(To).
The analysis presented above shows that neglecting I(To)
causes the activation energy measured by the isoconversion method to be increased. In evaluating the potential importance of this deviation we should consider that other sources of mathematic approximation error are typically in the order of 0.1 to 0.5%, for the more accurate methods [1,10]. But more important sources of measurement error are sample variability and various sources of experimental noise, which combine to produce plots of
(
β κ)
f T
ln vs. 1/Tf that
depend on many factors and can vary wildly, to produce potential errors typically from 0.2 to 5%. In this work we will consider 0.5% as a practical limit below which mathematical errors are mostly irrelevant, but it is noted that even larger mathematical errors can become irrelevant if sample variability and various sources of experimental noise combine to produce large errors.
Evaluation of Eq. 17 for literature reports of determinations of activation energies for linear heating data using an isoconversion method, reveals that ΔE/E caused by neglecting I(To) is negligible for the vast majority reported
studies. (About 500 papers were scanned and only about 1% reported on reactions with a combination of To, Tf1, Tf2 and E
that could introduce a possibly significant deviation.) For instance, for reactions with E>70kJ/mol and Tf1>375K, ΔE/E
is smaller than 0.5% provided Tf1-To>65K, i.e. if the linear
heating is started at least 65K before the reaction stage to be studied, ΔE/E will be negligible under realistic experimental conditions. (Other factors such as measurement noise, sample variability and baseline variations, will generally combine to introduce more significant errors [1,10].) And if
E>100kJ/mol, Tf1-To needs to be larger than 50K to achieve ΔE/E<0.005.
Elsewhere [10] it was shown that the approximation of the temperature integral I(Tf) also causes a deviation in the
activation energy. The latter deviation can be minimised by choosing an accurate approximation, which leads to one of the more accurate isoconversion methods, and deviations due to approximation of the temperature integral can be limited to less than 0.5%. From the present analysis combined with the analysis in Ref. [10] we can thus conclude that the recently derived variants of isoconversion methods [10] are highly accurate in nearly all experimental conditions. The examples discussed below should be considered as very small class of reactions where some caution should be exerted in applying isoconversion methods that use approximations of the temperature integral.
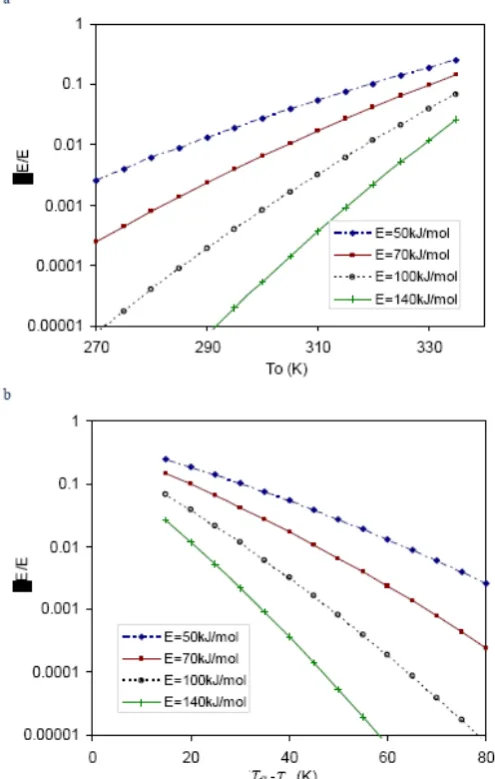
To evaluate Eq. 17 we will plot ΔE/E for a number of potentially relevant cases. In Fig. 1 ΔE/E is plotted for a reaction with Tf1=350K and Tf2=380K, with To varying
around 300K. This represents cases where the linear heating experiment is started around room temperature with a reaction occurring within 100K of the start of the experiment. A start temperature between room temperature and 325K is common practice in many types of studies. The relatively low reaction temperatures are commonly
encountered for three types of reactions: i) GP zone or cluster formation in supersaturated Al based alloys [21,22,23,24,25], where E is typically between about 50 and 80kJ/mol; ii) dehydration reactions [26,27], where E can be substantially higher (mostly between 70 and 140 kJ/mol), and iii) curing reactions, where E is mostly between 50 and 100 kJ/mol [28,29,30].
Fig. 1 The relative error in activation energy, ΔE/E vs. To
(a) and vs. Tf1-To (b) for a reaction with Tf1=350K and Tf2=380K, as obtained from Eq. 17.
(We will consider these reactions in the next section.) Fig 1 shows that ΔE/E increases with increasing To and with
decreasing E. The same data is also plotted as a function of
Tf1–To which represents the temperature interval between the
[image:4.595.315.563.179.569.2]neglecting I(To) can be minimised by ensuring that the start
temperature of the linear heating experiment is well below that of the reaction to be analysed.
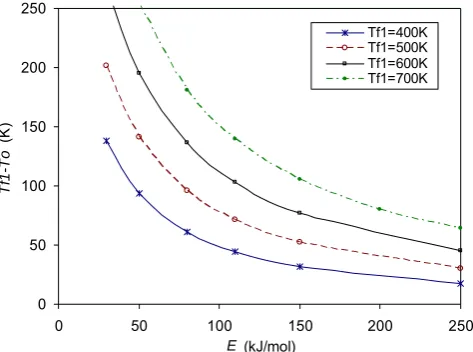
A typical value for the relative error in activation energy determination, ΔE/E, which in most experimental conditions is just about negligible is about 0.5%. Fig. 2 provides a plot of the maximum allowable value of Tf1-To for which ΔE/E=0.005, as a function of the activation energy. Data for various values of Tf1 is plotted, and Tf2-Tf1=30K. This plot
can be used as a quick reference to identify whether errors in activation energy determination are significant. It should be stressed again, that from a (limited) search through the literature it is believed that for about 99% of the papers reporting activation energy analysis using isoconversion methods on linear heating data, these errors are insignificant.
0 50 100 150 200 250
0 50 100 150 200 250
E (kJ/mol)
Tf
1
-To
(K
)
Tf1=400K Tf1=500K Tf1=600K Tf1=700K
Fig. 2 The maximum allowable value of Tf1-To for which
the relative error in activation energy introduced by neglecting I(To) is below 0.5%, as a function of the
activation energy. Data for four values of Tf1 is plotted, Tf2 -Tf1=30K.
4.2 Low temperature reactions: cluster formation,
dehydration reactions, cure reactions.
In this section we will consider some of the published data on activation energy analysis of low temperature reactions involving cluster formation, dehydration and curing. The examples are selected from recent literature and aim to provide an overview of possible deviations in activation energy analyses which assumed I(To) to be negligible.
We will first consider the DSC analysis of Cu-Mg co-cluster formation in a solution treated and quenched Al-1.9Cu-1.6Mg-0.2Mn (at.%) alloy [25]. The relevant parameters for this reaction (To=280K, Tf1=340K, Tf2=370K, E=75kJ/mol,
see Ref. [25]) indicate a ΔE/E value of 0.13%, which is in practice negligible. However, it is interesting to note that if the DSC would have been started above room temperature, say 305K, the relative error ΔE/E in the activation energy determination would increase to 2.1% and inaccuracies would start to become significant.
Dehydration reactions often have an activation energy that is higher than that of cluster formation, and this will limit the relative error ΔE/E in the activation energy determination (see Fig 1 and Fig. 2). For instance, the dehydration reaction of hydrated Co(II) methanesulfonate studied by Su et al [26] the parameters (To=310K, Tf1=340K, Tf2=370K, E≈125kJ/mol) would provide ΔE/E value of 0.1%, which is generally negligible. On the other hand, the dehydration reaction in 1,10-Phenanthroline studied by Vechio et al. [27] the parameters (To=293K, Tf1=305K, Tf2=340K, E≈85kJ/mol)
would provide a ΔE/E value of about 7% for the early stage of the reaction. Thus, the activation energies quoted by Vechio et al. [27] would need to be reassessed in the light of the present findings.
Also in published analyses of cure reactions using linear heating, sometimes significant errors are introduced due to neglecting I(To). Analysis shows that in the most severe
cases published in Refs. [28,29,30] (most severe here means samples and analyses with lowest Tf1 and E), ΔE/E values of
1.2% to 2.6% are encountered. But in a similar number of papers on analysis of cure reactions ΔE/E values are always below 1%.
4.3 Multi-stage reactions with reversion stage.
In addition to the reactions where the start temperature of the linear heating experiment is just below the reaction to be studied, we may also consider cases where the effective To
for a reaction is defined by prior reactions. This could be the case where during heating a sequence of reactions occurs starting with the formation of a phase or structure stable at low temperature, here termed δ', which is stable only below a certain temperature TS, and which is followed by the
formation of the stable phase or structure, here symbolised by δ. If the original unstable state at the start of the linear heating is α, and the three states are the only ones possible, then we could either see the sequence of reaction on heating (reaction A):
α→δ'→δ
[image:5.595.40.277.298.474.2]Or if on passing TSδ' reverts to α (reaction B)
α→δ'→α→δ
(Also, under fast heating rate condition one could see α→δ)
In reaction B, any formation of δ' can only occur after δ' has dissolved, and hence we can think of TS as the effective start
temperature of the linear heating experiment analysing δ
formation. Hence we can consider To to be given by TS.
There are many reactions in the domains of chemistry, physics and materials science that could be influenced by this, and hence influence the activation energy analysis. Again this can be analysed by Eq. 17, with TS substituted for To. Here we will illustrate this by considering precipitation
reactions in Al based alloys.
In Al-Mg based alloys, two main precipitate structures are formed on isothermal ageing below about 360K and subsequent linear heating to about 310C, they are the low temperature L12 ordered precipitates generally indicated by
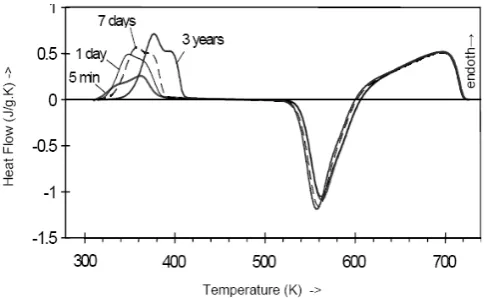
β′′ (other indications: δ′, ordered GP zone) [31,32,33] and the β′ phase, which forms at higher temperatures (typically T>450K) [34]. In Fig 2 we can observe the β′′ dissolution reaction in room temperature aged samples; for samples aged very long times at room temperature this reaction is completed at about 110C, with the β′ phase formation starting at about 220C. With an activation energy for β′
formation of about 75kJ/mol [31], Eq. 17 indicates that ΔE/E
is smaller than 0.3%, and hence neglecting of I(To) could not
have influenced the determination of the activation energy significantly.
Fig. 3 DSC curves of ice water quenched Al-16Mg
samples aged for 5 min, 24 h, 7 days and 3 years at room temperature after solutionising at 713K. (From Ref [32])
In solution treated Al-Cu-Mg based alloys with compositions in the α+S phase field (at around 500K), linear heating will cause the formation Cu-Mg co-clusters (also termed GPB zones) [35,36,37,38] and S phase [39,40,41]. If the alloys are aged at low temperature to cause the formation of Cu-Mg co-clusters, subsequent linear heating will cause the reversion of clusters prior to formation of S phase. Estimating To as the
effective temperature for cluster dissolution (230C) and Tf at
the peak of S phase formation, the relevant parameters for this reaction (To=500K, Tf1=530K, Tf2=545K, E≈130kJ/mol,
see Ref. [1,22] and Fig. 4) indicate a ΔE/E value of ~8%. Thus, the activation energies for S phase formation obtained by linear heating would need to be considered with caution as they may be influenced by neglecting I(To).
-0.06 -0.04 -0.02 0 0.02 0.04 0.06 0.08 0.1 0.12
27 127 227 327 427 527
Temperature (K)
H
eat f
low
(
W
/g
)
RT aged 423K/12h 423K/24h
300 400 500 700 800 900
Fig. 4 DSC curves of samples of an
Al-1.21at%Cu-1.19at%Mg-0.20at%Mn alloy solution treated, quenched, stretched by 2.5%, room temperature aged for several months and (for two of the samples) aged at 423K.
5 Conclusions
Model-free isoconversion methods which use approximations of the temperature integral are generally reliable methods for the calculation of activation energies, E, of thermally activated reactions studied during linear heating. These methods generally neglect the temperature integral at the start of the linear heating, I(To). In the present
work an analytical equation is derived which describes the deviations introduced by neglecting I(To). The ΔE is a
function of To, Tf1, Tf2 and E, where the Tf1, Tf2 are the
temperatures of a fixed stage of the reaction achieved at heating rates β1, β2, respectively. Evaluation of this equation
shows:
exotherm.
[image:6.595.321.562.286.456.2] [image:6.595.34.278.559.708.2]• For most reactions encountered, neglecting I(To) does not
have a significant influence on the accuracy of the isoconversion method. Plots are presented which show the deviations introduced as a function of To, Tf1, Tf2 and E.
• In cases where To is within about 50 to 70K of the
reaction stage to be investigated and activation energies are relatively low, significant deviations can be introduced.
• It is shown that some of the published thermal analysis work on activation energy analysis of reaction occurring at relatively low temperatures is affected. Examples are specific cases of dehydration reactions, cure reactions and cluster formation in Al alloys.
Acknowledgements Dr Nong Gao is gratefully acknowledged for
performing DSC experiments presented in Fig 4.
References
1 M.J. Starink, Int. Mater. Rev. 49 (2004) 191
2 A.K. Galwey and M.E. Brown, in: M.E. Brown (Ed.), Handbook of Thermal Analysis and Calorimetry, Vol. 1, Elsevier, Amsterdam, 1998, p. 147
3 F. Liu, F. Sommer and E.J. Mittemeijer, J. Mater. Sci. 39 (2004) 1621
4 M.J. Starink and A.-M. Zahra, Phil. Mag. A 77 (1998) 187 5 S. Vyazovkin, Thermochim. Acta 355 (2000) 155
6 M.J. Starink and A.-M. Zahra, Thermochim. Acta 298 (1997) 298
7 J.H. Flynn, Thermochim. Acta 300 (1997) 83
8 J. D. Sewry and M. E. Brown, Thermochim. Acta 390 (2002) 217
9 Tang Wanjun and Chen Donghua, Thermochim. Acta 433 (2005) 72
10 M.J. Starink, Thermochim. Acta 404 (2003) 163 11 H. E. Kissinger, Analyt. Chem. 29 (1957) 1702 12 T. Ozawa, J. Therm. Anal. 2 (1970) 301 13 E.J. Mittemeijer, J. Mater. Sci. 27 (1992) 3977
14 J.H. Flynn and L.A. Wall, J Polym Sci Part B 4 (1966) 323 15 T. Ozawa, Thermochim. Acta 203 (1992) 159
16 S. Vyazovkin and V.V. Goriyachko, Thermochim. Acta 194 (1992) 221
17 S. Vyazovkin and A.I. Lesnikovich, Russ. J. Phys. Chem. 62 (1988) 2949
18 M.J. Starink, Thermochim. Acta 288 (1996) 97 19 M.J. Starink, J. Mater. Sci. 32 (1997) 6505
20 M.J. Starink, I. Sinclair, N. Gao, N. Kamp, P.J. Gregson, P. Pitcher, A. Levers and S. Gardiner, Mater. Sci. Forum 396-402 (2002) 601
21 M.J. Starink, N. Gao, J.L. Yan, Mater. Sci. Eng. A 387-389 (2004) 222
22 A. Charai, T. Walther, C. Alfonso, A.-M. Zahra and C. Y. Zahra, Acta Mater. 48 (2000) 2751
23 M.J. Starink and A.-M. Zahra, J. Mater. Sci. Lett. 16 (1997)
1613
24 S. Abis, M. Massazza, P. Mengucci and G. Riontino, Scr. Mater. 45 (2001) 685
25 M.J. Starink, N. Gao, L. Davin, J. Yan, A. Cerezo, Phil. Mag. 85 (2005) 1395
26 Ting-Ting Su, Heng Jiang and Hong Gong, Thermochim. Acta 435 (2005) 1
27 S. Vecchio, R. Di Rocco, C. Ferragina and S. Materazzi, Thermochim. Acta 35 (2005) 181
28 I. Mondragon, L. Solar, I.B. Recalde and C.M. Gómez, Thermochim. Acta 417 (2004) 19
29 Tianle Zhou, Mingyuan Gu, Yanping Jin and Junxiang Wang, Polymer 46 (2005) 6216
30 Guangbo He and Ning Yan, Int. J. Adhesion and Adhesives 25 (2005) 450
31 M.J. Starink and A.-M. Zahra, Acta Mater. 46 (1998) 3381 32 M.J. Starink and A.-M. Zahra, Phil. Mag. A 76 (1997) 701 33 M. Slabanja and G. Wahnström, Acta Mater. 53 (2005) 3721 34 M.J. Starink and A.-M. Zahra, J. Mater. Sci. 34 (1999) 1117 35 N. Gao, L. Davin, S. Wang, A. Cerezo and M.J. Starink,
Mater. Sci. Forum, 396-402 (2002) 923 36 K. Hono, Prog. Mater. Sci. 47 (2002) 621
37 S.C. Wang and M.J. Starink, Mater. Sci. Eng. A 386 (2004) 156
38 M.J. Starink, C.Y. Zahra and A.-M. Zahra, J. Therm. Anal. and Calorim. 51 (1998) 933
39 M.J. Starink and A. Dion, Thermochim. Acta 417 (2004) 5 40 S.C. Wang and M.J. Starink, Int. Mater. Rev. 50 (2005) 193 41 S.C. Wang, M.J. Starink and N. Gao, Scr. Mater. 54 (2006)