Technology (IJRASET)
Structural Analysis of Nano Composites Using
FE-Modeling under Flexural Load
Kausar Sultana E1, Manjunatha Babu N.S2, Mohan Kumar. K3
1
PG Student, 2Assistant Professor, 3Associate Professor
Department of Mechanical Engineering, Dr. T. Thimmaiah Institute of Technology –KGF, Karnataka
Abstract— High strength of Carbon nanotube reinforced composites has motivated us to study and understand the mechanical properties of carbon nanotubes. Carbon nanotubes finds its application in the field of automotive and aerospace industry as there is need of materials with high strength and stiffness in the structural parts of automotive and aerospace components such as panels of automotive sector (sheets) and as slender member structure (struts, frames) and stringers in fuselage and main wing. Most of the research works are carried out to replace some of the structural steel and aluminum alloy usage in the industry with carbon Nano tube (CNT) reinforced with polymer matrix, This paper mainly focuses on the FE modeling and structural analysis of CNT reinforced composites. Here the FE model was analyzed under flexural load and stress, strain, deflection, young’s modulus were obtained.
Keywords— CNT Composite, Polymer Matrix, Von mises, Structural Analysis, Representative Volume Element Modeling.
I. INTRODUCTION
Carbon nanotubes are ‘allotrope’ of carbon. CNTs are in the form of cylindrical carbon molecule. Carbon nanotube belongs to the structural family of fullerene that have Bucky balls with spherical shape [1]. Carbon nanotubes (CNTs) are used in the Applications such as nanotechnology, electronics, and optics. Carbon nanotubes have high heat of conduction and high strength. Nanotubes diameter is of few nanometres (50,000 times less than width of human hair) but its length is in several millimetres.
There are two main types of nanotubes: Single-walled nanotubes (SWNTs) and Multi-walled nanotubes (MWNTs)
The materials which are embedded with nanoscale dimensions in a metal, ceramic or a polymer matrix with one or more phases are known as Nano composites [1]. CNTs are said to be the strongest material occurring in nature. CNTs are in the form of long hollow cylinder made of graphene. Though the symmetry of graphene sheets is 2D, from the geometry of CNT they have different properties occurring in axial direction and also in radial directions. It is found that along the axial direction the CNTs are stronger. The tensile strength and young’s modulus was obtained in the orders of 11 to 63 Giga Pascal. CNTs are soft along the radial direction. Bacon synthesized carbon nanotubes in 1960, but Iijima the genius realized that carbon nanotubes are obtained by rolling a graphene sheet by itself [2]. Multi walled carbon nanotubes are obtained by the concentric arrangements of many single walled nanotubes. The multi walled carbon Nano tubes is referred in this work. Extraordinary mechanical property of Carbon nanotubes were found from the experiments and simulations on comparison with fibers, strength of 100Gpa and stiffness up to 1000Gpa.
II. GEOMETRYMODELINGOFRVEANDCNTCOMPOSITE
The work involves the geometrical modeling of the CNT and later the CNT was meshed using ANSYS and was analyzed for flexural load. The same model was later on reinforced into the matrix which forms the CNT composite. And the model was analyzed for the same flexural load. The results from the FE analysis are compared with the analytical method. The parameters like Deflection, bending Modulus, and stress, strain are obtained for various loading conditions.
The RVE used in the analysis has a length of 120 nm and its cross-section is 20 nm×20 nm which contains 5×5 cells. The structure of the CNT was similar to honeycomb, which was considered for RVE in present numerical analyses [3]. The in-plane axes are numbered 1 and 2 and the longitudinal direction was along 3-axis. The model was analysed for flexural with varios load cases starting from 5MPa to 15 MPa. The model with above dimensions are considered for the geometry of the CNT and with dimensions of 120nmx20nmx20nm.It has 3nm cell diameter and inter pore wall thickness of 0.6nm to 0.8nm and 3.7nm inter pore centre distance. The models were developed with front face of 20nmx20nm dimensions as area in Ansys as shown in figure 1. And extruded 120nm to get RVE. Around the CNT developed the matrix volume of polymer matrix of the dimension 120nmx60nmx20nm was created using co-ordinate points.
Technology (IJRASET)
taken as E=13Gpa and Poisson’s ratio for CNT is taken as 0.3.Fig 1: (a) RVE dimensions (b) Arrangement of internal cells.
III.RESULTSANDDISCUSSIONS
A. FE-Analysis for flexural loading of CNT
In the FE analysis of CNT for three point bending (flexural load) the meshed model was applied with boundary conditions in which the nodes from left extreme down and right extreme down were fixed and load was applied on top mid nodes. Initial loading of 5Mpa and was carried with load steps till 15 Mpa the analysis was focused on the study of deflection plots, stress and strain plots and also the young’s modulus.
The FE analysis gives the enough information about the deflection, stress contours, strain values for the corresponding loads and also shows variation of various parameters like deflection for the load case, stress verses strain and load verses displacement
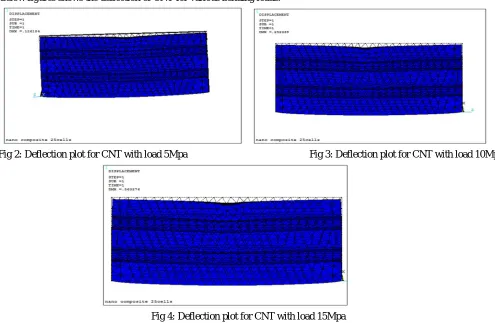
1) Deflection Plots for Flexural Load of CNT: Figure 2, 3 and 4 shows the deflection of CNT for load starting from 5Mpa, 10Mpa and 15Mpa. The deflection at the center was more because of three point loading and it goes on increases with increase in the load. The deflection for 5Mpa was observed 0.126nm, and 0.252nm, 0.536nm for other two loading cases respectively.
[image:3.612.130.482.97.192.2]The below figures shows the deflection of CNT for various bending loads:
Fig 2: Deflection plot for CNT with load 5Mpa Fig 3: Deflection plot for CNT with load 10Mpa
Fig 4: Deflection plot for CNT with load 15Mpa
[image:3.612.58.553.393.716.2]Technology (IJRASET)
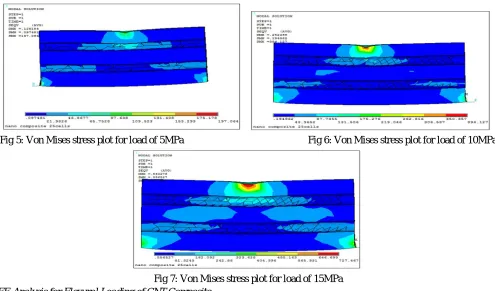
[image:4.612.58.553.142.433.2]5Mpa to 15pa in the step size of 5Mpa. It was observed that initial stress induced in the specimen was very less in magnitude i.e. about 0.097Mpa minimum and 197MPa maximum for first load case. And it was observed that the stress was maximum at the point of application where it shows maximum deflection. As the load was increased the stress value reached to 394MPa and 727MPa for load 10Mpa and 15Mpa respectively. This shows more stress value where the specimen was expected to be under failure mode.
Fig 5: Von Mises stress plot for load of 5MPa Fig 6: Von Mises stress plot for load of 10MPa
Fig 7: Von Mises stress plot for load of 15MPa B. FE-Analysis for Flexural Loading of CNT Composite
FE analysis of CNT composite for three point bending load. The meshed model of CNT was reinforced with matrix of epoxy of dimensions 120 nm X 60 nm X 20 nm. And the combined model was meshed with element size of 1.5nm which gives fair meshed model of CNT composite In the FE analysis of CNT composite for three point bending case (flexural load) the meshed model was applied with boundary conditions in which the nodes from left extreme down and right extreme down are fixed and load was applied on top mid nodes.
1) Deflection Plots for Three Point Bending Load of CNT Composite: Figures 8, 9 and 10 show the deflection of CNT composite for load starting from 5Mpa, 10Mpa and 15Mpa. The deflection at the center was more because of three point loading and it goes on increases with increase in the load. The deflection for 5Mpa was observed 1.254nm, and 2.592nm, 4.279nm respectively for other two loading cases. The below figures shows the deflection of CNT composite for various bending loads:
[image:4.612.56.556.562.685.2]Technology (IJRASET)
Fig 10: Deflection plot for CNT composite with load 15Mpa
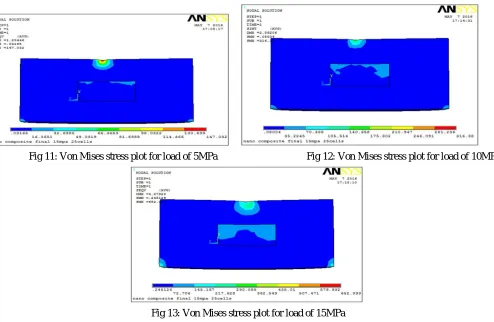
2) Stress Contours for Flexural Load of CNT: Figures 11, 12 and 13 shows the stress contours for all the load cases starting from 5Mpa to 15pa in the step size of 5Mpa. Initially the stress induced in the specimen was very less in magnitude i.e. about 0.031Mpa minimum and 147Mpa maximum for first load case. And stress was maximum at the point of application where it shows maximum deflection. And the stress shows almost constant over the geometry. As the load was increased the stress value reaches to 316mpa and 652Mpa for load 10Mpa and 15Mpa respectively.
Fig 11: Von Mises stress plot for load of 5MPa Fig 12: Von Mises stress plot for load of 10MPa
Fig 13: Von Mises stress plot for load of 15MPa
C. Flexural load of CNT composite analytical Validation with FE
[image:5.612.58.552.322.644.2]Technology (IJRASET)
The below calculation shows deflection for the flexural load of CNT
= 48
= =0.0155nm
The below calculation shows deflection for the flexural load of CNT composite
= 48
[image:6.612.93.501.272.627.2]= =0.0461nm
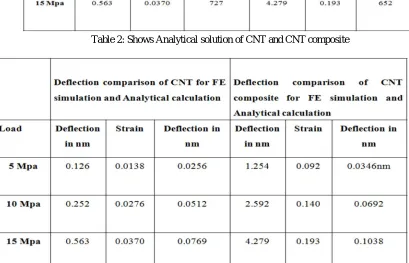
Table 1: Shows Flexural load properties of CNT and CNT composite
[image:6.612.86.495.434.697.2]Technology (IJRASET)
Graph 1 Load Vs deformation plot for CNT and CNT composite with FE analysis for flexural load.
FE analysis and analytical solution for the CNT and CNT composite was carried out with three point loading. From the table and analytical calculations it was observed that the deflection comparison between FE analysis and analytical solution was giving more difference of about 60% on an average.
IV.CONCLUSION
FE modeling of CNT and CNT composite was done and was observed that, The nature of the curve of analytical for both CNT and CNT composite was almost linear with negligible deviations, it was also observed that the deflection in case of finite element analysis and analytical solution was showing more difference of about 60% on an average which does not holds good using the solid mechanics formulae. The values of CNT obtained from ansys were closely related with analytical values and it was observed that the curve obtained was almost linear with negligible deviation. But CNT composite values obtained from ansys varies widely with analytical values of deflection.
REFERENCES
[1] Raghuram Basavanahalli, finite element modeling of carbon nanotubes reinforced Polymer composites and evaluating its Thermal conductivities, the
University of Texas at Arlington, December 2006
[2] Iijima, S., 1991, "Helical Microtubules of Graphitic Carbon," Nature, 354(6348) pp.56.
[3] Ali Alavinasab; Nonlocal Theory and Finite Element Modeling Of Nano-Composites, Clarkson University, August 2009
[4] Bourchak, M., Kada, B., Alharbi, M., & Aljuhany, K.(2009).Nanocompositesdamagecharacterization using finite element analysis. International Journal of Nanoparticles, 2(1-6), 467-475.
[5] S. R. Bakshi, D. Lahiri and A. Agarwal, Carbon nanotubes reinforced metal matrix composites – a review, 2010 Institute of Materials, Minerals and Mining and
ASM International Published by Maney for the Institute and ASM International.
[6] Benedict Thomas, Prasad Inamdar, Tarapada Roy & B. K. Nanda, Finite Element Modeling and Free Vibration Analysis of Functionally Graded
Nanocomposites Beams Reinforced by Randomly Oriented Carbon Nanotubes, International Journal on Theoretical and Applied Research in Mechanical Engineering (IJTARME), ISSN : 2319 – 3182, Volume-2, Issue-4, 2013
[7] Liu, Y.J. and Chen, X.L. (2003) ‘Evaluations of the effective material properties of carbon nanotubes-based composites using a nanoscale representative volume element’, Mechanics of Materials, Vol. 35, pp.69–81.
[8] Yuan Li, Yaolu Liu and Ning Hu (2011). Reinforcement Effects of CNTs for Polymer-Based Nanocomposites, Carbon Nanotubes – Polymer Nanocomposites,
Dr. Siva Yellampalli (Ed.), ISBN: 978-953-307-498-6, InTech.
[9] Njuguna, J. and Pielichowski, K. (2004) ‘Polymer nanocomposites for aerospace applications: characterization’, Advanced Engineering Materials, Vol. 6, No.
4, pp.204–210.
[10] Spanos, P.D. and Kontsos, A. (2008) ‘A multiscale Monte Carlo finite element method for determining mechanical properties of polymer nanocomposites’,
Probabilistic Engineering Mechanics, article in press, corrected proof.
[11] Xu, L.R., Bhamidipati, V., Zhong, W., Li, J., Lukehart, C.M., Lara-Curzio, E., Liu, K.C. and Lance, M.J. (2004) ‘Mechanical property characterization of a
polymeric nanocomposites reinforced by graphitic nanofibres with reactive linkers’, Journal of Composite Materials, Vol. 38, No. 18, pp.1563–1582.
[12] Xu, L.R., Li, L., Lukehart, C.M. and Kuai, H. (2007) ‘Mechanical characterization of nanofibre-reinforced composite adhesives’, Journal of Nanoscience and
Nanotechnology, Vol. 7, pp.1–3.
[13] Sun C.T., Vaidya R.S. (1996). “Prediction of composite properties from a representative volume element,” Composites Science and Technology, 56: 171-179.
[14] Chung J., Waas A.M. (2002). “Compressive Response of Honeycombs under In-Plane Uniaxial Static and Dynamic Loading, Part 2: Simulations,” AIAA
Journal, 40:974-980.
Technology (IJRASET)
[16] Privman V., Dementsov A., Sokolov I. (2007). “Modeling of Self-Healing Polymer Composites Reinforced with Nanoporous Glass Fibers”, Journal of
Computational and Theoretical Nanoscience, 4: 190-193.
[17] Yu, M., Lourie, O., and Dyer, M. J., 2000, "Strength and Breaking Mechanism of Multiwalled Carbon Nanotubes Under Tensile Load," Science, 287(5453) pp.
637-640.
[18] Takahashi, S., Ikuno, T., and Oyama, T., 2002, "Synthesis and Characterization of Carbon Nanotubes Grown on Carbon Particles by using High Vacuum Laser
Ablation," Shinku/Journal of the Vacuum Society of Japan, 45(7) pp. 609-612.
[19] Vander Wal, R. L., Berger, G. M., and Ticich, T. M., 2003, "Carbon Nanotube Synthesis in a Flame using Laser Ablation for in Situ Catalyst Generation,"
Applied Physics A: Materials Science and Processing, 77(7) pp. 885-889.
[20] Kim, H. S., Park, S., and Yang, J. H., 2005, "Synthesis of Carbon Nanotubes on Metal Substrates by Plasma-Enhanced Chemical Vapor Deposition," Key Engineering Materials, 277-279(I) pp. 950-955.
[21] SHYoo, HJ Wang, ST Oh, SG Kang 2006, "Synthesis and Densification of CNTs/Fe/Al2O3 Nano composite Powders by Chemical Vapor Deposition,"Key
Engineering Materials, 317-318pp. 665-668.
[22] Lau, K., and Hui, D., 2002, "Effectiveness of using Carbon Nanotubes as Nano- Reinforcements for Advanced Composite Structures," Carbon, 40(9) pp.
1605-1606.
[23] Ajayan, P.M., Schadler, L.S. and Braun, P.V. (2003) Nanocomposite Science and Technology, p.77, Wiley-VCH Verlag GmbH Co. K GaA, Weinheim.
[24] Yao Z., Zhu C., Cheng M.,Liu J. (2001). “Mechanical properties of carbon nanotube by molecular dynamics simulation,” Computational Materials Science,
22:180-184.
[25] Levy A., Papazian J.M. (1990) “Tensile properties of short fiber-reinforced SiC/Al composites: PartII. Finite-Element Analysis,” Metallurgical Transactions A,
21: 411-420.
[26] Hussain F., Hojjati M., Okamoto M., Gorga R. (2006).“Review article: Polymer-matrix Nanocomposites, processing, Manufacturing, and Application: An
overview,” Journal of Composite Materials, 40: 1511-1575..
[27] Wang Q., Han Q. K., Wen B. C. (2008). “Estimate of material property of carbon nanotubes via nonlocal elasticity,” Advance Theoy of Applied Mechanics, 1:
1-10.
[28] Kroto, H. W., Heath, J. R., and O’Brien, S. C., 1985/11/14/print, "C60: Buckminsterfullerene," Nature, 318(6042) pp. 162.
[29] Kang, G. Z., Gao, Q. (2002a). “Tensile properties of randomly oriented short δ- Al2O3 fiber reinforced aluminum alloy composites: II. Finite element analysis
for stress transfer, elastic modulus and stress-strain curve,” Composites: Part A, 33:657-667.