1
A Study of the Influence of Network Structural Embeddedness
on Organization
Innovativeness
Khalid AlKuaika([email protected]), Nuran Acura, Kepa Mendibilb
a
University of Strathclyde, Department of Design, Manufacture and Engineering Management, James Weir Building - 75 Montrose Street - Glasgow G1 1XJ, UK
b University of Stirling
Abstract:
This paper explores the impact of network structural embeddedness of an organization on its innovativeness. Based on a survey of 104 organizations in the medium and high technology sectors in Saudi Arabia, we explored the relationships between different network characteristics (i.e. network density, centrality) and organization’s type and degree of innovativeness. Using a logistic regression analysis, the study finds that there is a positive and significant relationship between organization’s network density and centrality with both product innovation and process innovation. Additionally, the study investigated the influence of network characteristics on the degree of novelty of innovation (i.e. radical innovation). The findings reveal that having a central network position in terms of betweenness and degree centrality have a positive and significant relationship with novel innovation. However, the study results show insignificant relationship between network density and novel innovation.
Keywords:
Innovativeness, social network, Density, degree centrality, Betweenness centrality
Introduction:
Networking and inter-organizational collaboration is a key strategy in stimulating innovation in organizations (Faems et al., 2005; Pittaway et al., 2004; Soh, 2003). This has resulted in an increased body of literature studying the link between innovation performance and firm participation and position in networks (Ahuja, 2000; Capaldo, 2007; Phelps, 2010; Pittaway et al., 2004; Rowley et al., 2000; Ruef, 2002). Many of these authors have highlighted the need to carry out further research into network characteristics and its impact on innovativeness to overcome some of the fragmented and inconsistent discussion in current literature. From a country perspective, limited studies have examined this area of research in the emerging economies context (Radas and Bozic, 2009; Zeng et al., 2010).
2
relationships and links as external sources of innovation (Coombs et al., 2003; Nieto and Santamaria, 2007; Perkmann and Walsh, 2007).
Recently, extant literature introduces social network perspective into strategic alliances and inter-organizational research in an attempt to in depth investigate organization networks and its effect on innovation performance. In innovation management research, for instance, networks have been viewed as an essential aspect for organizations to gain strategic benefits such as knowledge, information, and resources (Owen-Smith and Powell, 2004). Organization’s position, relations and ties to other actors in the network, and the diversity of these actors could enhance learning, innovation (Phelps, 2010), and access to new knowledge and information (Soh, 2003).
This research study deals with the above challenges and aims to shed light on the relationship between network structural embeddedness- characteristics of the relational structure in an organization’s network (Rowley et al., 2000), and organizational innovation performance in the context of emerging economies. It builds on several innovation management research streams that look into organization’s strategic alliances network characteristics and its effect on organization’s innovativeness. The study contributes to the existing literature by developing a social network analytical approach (SNA) to organization’s innovativeness from an organization’s ego network perspective. Additionally, based on a sample of 104 firms in the medium and high technology sectors in Saudi Arabia and 317 of their network alliances, this study uses logistic regression analysis to examine the impact of organization structural embeddedness (i.e. network density, centrality) in shaping its type of innovation and the degree of innovation novelty.
Literature review:
Social Network: an overview
Social network field of research has considerably attracted scholar’s attention in the recent decades (Wasserman and Faust, 1994; Borgatti and Foster, 2003). Nowadays, there is an increasing interest in the academic literature that organization’s characteristics in a network matters for its economic and innovativeness. The concept of social network has been used to examine many structural and relational aspects of organizations and its effect on innovation in various industries such as biotechnology (Gilsing and Duysters, 2008; Owen-Smith and Powell, 2004; Powell et al., 1996), chemical (Ahuja, 2000; Gilsing et al., 2008), multimedia (Gilsing and Duysters, 2008), telecommunications (Phelps, 2010), semiconductor and steel industries (Rowley et al., 2000). Networks and relations are at the heart of social network analysis where the focus is on the relationships among actors (i.e. individuals, groups, organizations) (Gilsing and Duysters, 2008). Borgatti et al. (2013) defined networks as “a way of thinking about social systems that focus our attention on the relationships among the entities that make up the system, which we call actors or nodes” (Borgatti et al., 2013, p1). Social networks are formally defined as a set of actors (individuals, departments, organizations, etc.) that are connected by one or more types of relations-relations are a collection of ties among actors- (Scott and Carrington, 2011; Wasserman and Faust, 1994).
3
capturing the position and interaction of any actor within the larger field of activities to which the actor belongs (Kilduff and Tsai, 2003). Therefore, by focusing on actors and relationships among them, SNA enables us to gather and investigate network characteristics in terms of actors’ relational and structural properties in great details (Gilsing and Duysters, 2008).
Social Network and Organization Innovativeness:
There is an increasing agreement in the extant academic literature that network characteristics plays an essential role in influencing organization’s economic actions, learning and innovation performance (Gulati et al., 2000; Gulati and Gargiulo, 1999; Kilduff and Tsai, 2003; Powell et al., 1996). Actor’s relational and structural network properties, for instance, determine in part the constrains and opportunities that the actor might encounter. Therefore, identifying such network dimensions is fundamental for predicting actor outcomes (Borgatti et al., 2013; Kilduff and Tsai, 2003; Owen-Smith and Powell, 2004; Phelps, 2010).
There are three network’s dimensions that have been identified in the literature which could influence organization’s innovativeness, relational, structural, and composition properties. First, relational network properties, these properties address the relationships among actors in the network. Such relations are in a form of a collection of ties among actors (i.e. strong ties and weak ties) and the strength and composition of these ties. Second, structural network properties, such as network density and centrality, which are concerned with the pattern of ties and interactions that exist among a set of actors (Powell et al., 1996; Wasserman and Faust, 1994). Third, network composition, which refer to the various aspects of actors attributes in the network, such as actor’s traits and features (i.e., size, industry, profit, etc.) and actors type of partners (partner’s diversity) (Powell et al., 1996; Wasserman and Faust, 1994).
Organizations started to realize the significance of network characteristics in achieving competitive advantage and organization growth. The types and characteristics of network in which organizations are embedded can enhance organization learning and innovation (Ahuja, 2000; Capaldo, 2007; Phelps, 2010; Powell et al., 1996). These network structural characteristics are going to be our main focus in this paper, in order to uncover the different effect on organization innovativeness.
Network Structural properties:
Structural variables considered cornerstone of social network data. Measurements of these variables could be carried out on pairs of actors/nodes (Wasserman and Faust, 1994). Structural variables concerned with the position that an actor occupy in the network (Rowley et al., 2000). Measuring these variables enable exploring the impact of the structure of relations around actors on their propensity to cooperate with one another (Gulati and Gargiulo, 1999). Types of structural variables which include actors position in terms of network density and centrality and their importance to firm’s innovativeness will be discussed in the following sections.
Network Density:
Network density is one of the main measures of network structure. There are two types of network densities; global density and local density. Global network density-considers both types of ties-direct and indirect ties-as a property of the total network (Gilsing et al., 2008). Whereas, local density examines the interconnectedness of relationships among a focal firm’s direct partners (Rowley et al., 2000).
4
reciprocity norms, and a shared identity, which increase cooperation and knowledge sharing among organizations (Phelps, 2010; Schilling and Phelps, 2007). On the other hand, sparse network increase creativity and innovation by constructing structural holes that provides network actors with non-redundant information and timely access to diverse knowledge (Phelps, 2010; Schilling and Phelps, 2007). In fact, there is still argument and disagreement regarding which structure of network density would be a best fit for organizations seeking better performance and innovation. Nevertheless, both views provide different benefits, which are useful for different strategies purposes (Rowley et al., 2000).
In a longitudinal investigation of 77 telecommunications equipment manufacturers, Phelps (2010) examined the influence of network density on firm’s exploratory innovation performance (Phelps, 2010). He adopted the ego network analysis approach to identify all possible undirected pairwise combinations of sample firms, the ego network density was the percentage of all possible ties among an ego’s alters that had been formed (Scott, 2013). In his study, Phelps (2010) concluded that firms which enjoy a dense network among its partners will benefit from a strong influence of partners diversity which in turn increases its exploratory innovation.
According to that, we propose the following hypothesis:
H1a: Network density has a positive relationship with Product innovation.
H1b: Network density has a positive relationship with Process innovation.
H1c: Network density is negatively related to degree of novelty.
Centrality:
In social network analysis, centrality considers one of the most important measures and it is concerned with actor’s position in a network. A central actor is one that is at the centre of a number of connections in the network (Scott, 2013). The actor could be an individual or organization where the strategically centred actor can enjoy a wider access to knowledge and flow of information and control over valued resources (Ibarra, 1993). Centrality could benefit the actor by being on the passage point for the transmitted knowledge and information in the network (Owen-Smith and Powell, 2004). It could be measured based on two main categories as degree, and betweenness centrality.
Degree Centrality:
Degree centrality can be defined as the degree to which an actor is involved with other actors in the network. Central actors could be considered as the most active ones in the sense that they have the most ties to other actors in the network (Wasserman and Faust, 1994).
It can be measured simply by the number of other actors to which the focal actor is adjacent (Scott, 2013). According to Powell et al. (1996), firm's centrality is the number of other firms connected to that firm, ignoring how well those partners are connected (Powell et al., 1996). Organization central position in a network will increase its early access to resources, knowledge and information flow (Lee, 2007). Moreover, this central position could offer returns to the organization in terms of competitive advantage (Owen-Smith and Powell, 2004).
Betweenness centrality:
(Owen-5
Smith and Powell, 2004). Additionally, betweenness centrality could be a measure of the influence a focal firm has over the information through the network (Gilsing et al., 2008). It is measured by the extent to which a firm is located on the shortest path (i.e., geodesic) between any two actors in its network (Schilling and Phelps, 2007).
According to Powell et al. (1996), centrality is a measure of how well connected, or active, a firm is in the overall network. In their analysis of inter-organizational formal agreements at the firm level of 225 firms in Biotechnology industry, Powell et al. (1996) investigated firms’ network position and its influence on collaborative R&D. they have shown that network position (central connectedness) has reciprocal influences on R&D alliances, investment ties, and total collaboration. Moreover, it was found that R&D ties, experience, and diversity produce central connectedness, and this central position cycles back to intensify a firm's commitment to exploring through its network.
Soh (2003) carried out a study on 201 observations for 48 firms in the computer networking market, and found that centrality position in the technology collaboration network of a firm improves its new product performance (Soh, 2003). Another research conducted by Gilsing et al. (2008) to investigate the relationship between explorative innovation performance of companies and network centrality (Betweenness centrality). Acquiring a panel data on the alliance and patenting activities of 116 companies on chemicals, automotive and pharmaceutical industries, the study concluded that highly central firms enjoy the strongest improvements of their explorative innovation performance network (Gilsing et al., 2008). However, Schilling and Phelps (2007) didn’t find statistical significance evidence concerning the effect of betweenness centrality on subsequent firm patenting in their longitudinal study of 1,106 firms. On the contrary, they have concluded that efficiency had a significant negative effect on firm patenting which suggest that the presence of structural holes in a firm's ego network of alliance relationships has negative consequences on its innovative output (Schilling and Phelps, 2007).
Therefore, we propose the following hypothesis for central position in a network in terms of betweenness centrality and degree centrality which is going to be discussed further when we define research variables:
H2a: Central position in a network has a positive relationship with Product innovation.
H2b: Central position in a network has a positive relationship with Process innovation.
H2c: Central position in a network is positively related to degree of novelty.
Research Conceptual Model:
There are two main types of social network research, Whole network and ego network researches. Whole network type of researches concerned with the social structure and relations among all actors in a given set of network (Scott and Carrington, 2011; Wasserman and Faust, 1994). Whereas, ego-centred network (or ego network), by definition, is a network which consists of a particular actor (ego), the actors ego is connected to (ego’s alters), and the measurement on the ties from ego to alters and on the ties between alters (Borgatti et al., 2013; Wasserman and Faust, 1994).
6
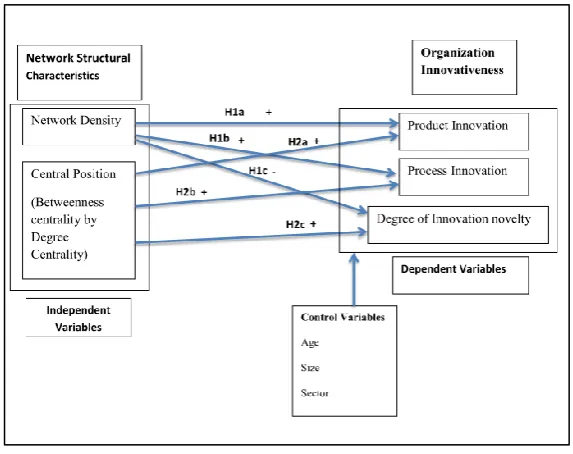
Fig.1 shows the research conceptual framework which will be examined in this paper. The model describes the main ego-network structural embeddedness dimensions and their relevance to innovation output.
Fig.1: Research Conceptual Model
Research Methodology:
Sample and data:
The source of our data comes from innovation survey implemented in 2015. It was conducted on the medium and high technology sectors in Saudi Arabia to collect data about their social network aspects and innovation activities in the period 2012-2014. A questionnaire was developed to collect data on innovation and network characteristics at the organization level, which is an ego network level of analysis in the social network analysis approach. Two different data collection approaches were adopted, 1) innovation data was collected based on the “Oslo Manual” guidelines for collecting and interpreting technological innovation data (Laursen and Salter, 2006; Reichstein and Salter, 2006), 2) network data was collected based on Social Network Analysis (SNA) approach (Borgatti et al. 2013; Scott, 2013; Wasserman and Faust, 1994).
[image:6.595.154.441.121.348.2]7
Concept Innovation Section Network Section
Methodology approach Follow the methodology of conducting innovation surveys based on the “Oslo Manual” guidelines for collecting and interpreting technological innovation data (OECD, 2005).
Social Network Analysis (SNA) methodology is going to be followed
References (Faems et al., 2005), (Laursen and Salter, 2006; Tether and Tajar, 2008a), (Radas and Bozic, 2009)
(Weterings and Boschma, 2009), (Mol and Birkinshaw, 2009)
Research boundary and sampling population
First important initial step: defining Research boundary and sampling population
Research population: Saudi Arabia Firms, in the Medium & High Technology Sectors
References (Wasserman and Faust, 1994), (Scott and Carrington, 2011.), (OECD, 2005).
Level of analysis Subject approach ( Firm level of analysis) Egocentric network analysis
(Actor is the unit of analysis- in this research Firm level of analysis)
Data collection Instrument
This research is following OECD (2005) approach and is adapting similar questions that of community Innovation Survey (CIS). The selection of questions is only going to be the questions related to Product, Process and Organizationalinnovation part of CIS.
Surveys and Questionnaires are the most common method used to gather network data
References (Marsden, 1990) (Burt, 1984), (Wasserman and
Faust, 1994). (Scott, 2013) Table1: Research methodology approach
Since the main objective of this survey is to collect data about individual actors in the network (organizations), an ego network type of network was selected to serve this purpose. Ego centric network can be defined as “An ego-centred network consists of a focal actor, termed ego, as set of alters who have ties to ego, and measurements on the ties among these alter”. (Wasserman and Faust, 1994, p42). Egos can be persons, groups, organizations, or whole societies (Scott and Carrington, 2011). According to Borgatti et al. (2013), collection of ego network data has two main steps, name generator, and name interpreter. First, researcher can ask the respondent to name their alters (partners) which is called “name generator”. The second step, a follow up type of questions in which we ask the respondent about each name that has been mentioned in the name generator part of the survey that is called “name interpreter” (Borgatti et al. 2013). Table2 shows the main aspects of name generator and name interpreter in social network approach.
Name generator Name interpreter
Provide data about a respondent’s ego centric network
Follow the name generator questions
Depend on respondent’s recall Asks about attributes of particular relationships Could require high answering time if alters or name
interpreter are numerous
Allow for measuring many of network properties
Must specify a particular type of relationship Ask about form and content of information usually, asks respondents to identify alters by first
name or initials only
Reference: (Scott and Carrington, 2011; Borgatti et al., 2013) Table2: Name generator and name interpreter in SNA
8
Sector ISCI N %
Manufacturing
20 - Manufacture of chemicals and chemical products 7 7%
202 - Manufacture of plastics products 23 22%
21 - Manufacture of basic pharmaceutical products and pharmaceutical preparations 22 21%
27 - Manufacture of electrical equipment 22 21%
28 - Manufacture of machinery and equipment 5 5%
Total manufacturing firms 79 76%
Service
61 - Telecommunications 9 9%
62 - Computer programming, consultancy and related activities 7 7%
63 - Information service activities 9 9%
Total Service firms 25 24%
Total Respondents 104 100%
Size Medium 64 62%
Large 40 38%
Table3: Composition of respondents
Defining Variables:
Dependent Variables (DV):
As indicated earlier, the objective of this paper is to assess which network structural embeddedness variables have the most impact on organization’s innovativeness. Innovativeness is evaluated in terms of innovation outcome as product innovation, process innovation, and degree of innovation novelty (Radical or incremental innovation). The dependent variables reflect the innovation activities and outcomes by organizations. For product innovation (DV), the respondents were asked how many new or significantly improved goods or services did their company introduce in 2013/2014? For process innovation (DV), the question was to indicate how many new or significantly improved production, or delivery process and methods did their company introduce in 2013/2014? To construct the degree of novelty variable, we flowed the method outlined by Reichstein and Salter (2006) and Vega-Jurado et al. (2008) when organizations was asked whether their introduced innovation new to the market (identified as Radical innovation), or only new to the organization (identified as incremental innovation) (Reichstein and Salter, 2006; Vega-Jurado et al., 2008).
Independent Variables (IV):
The proposed framework model suggests two factors of network structural embeddedness to influence organization innovativeness. The research independent variables network density and central position (in terms of the interaction of degree centrality and betweenness centrality) are defined in Table4. To calculate these measures we followed the social network analysis approach outlined by Borgatti et al. (2013), where we constructed an undirected adjacency matrix for the data on hand. The rows and columns in the adjacency matrix represent the nodes (in this paper are organizations). An entry of 1 in row and column represent a tie or a relationship between two different entities, and the absence of the tie or relationships between nodes is assigned 0. Additionally, the matrix is considered a one-mode matrix where both rows and column refer to the same single set of entities (Borgatti et al., 2013).
9
Fig3: Network layout of organizations and its alliances
Network density:
We measure ego-network density from the constructed undirected adjacency matrix of organizations using UCINET 6.586. The ego-network density measured from the ratio of existing ties or links in the ego-network to the number of all possible ties between organization and its partners. It may range from 0 to 1, with larger values indicating increase in density (Borgatti et al., 2013; Casciaro, 1998; Phelps, 2010; Scott and Carrington, 2011; Schilling and Phelps, 2007). The formula for density is 2L/ [n (n-1)], where n: is the number of alters (partners), and L: the number of ties between alters (partners) (Borgatti et al., 2013; Scott, 2013; Scott and Carrington, 2011).
Degree centrality
We measured degree centrality for our sample using UCINET 6.586. It is measured as the number of direct ties or links that involve a given node (organization). It is measured by N-1, where N is the number of nodes (organizations) in the ego-network (Bellamy et al., 2014; Borgatti et al., 2013; Marsden, 2002; Scott, 2013; Wasserman and Faust, 1994). An example of degree centrality from one of research sample ego-network is illustrated below:
Number of nodes in the ego-network (N) = 6, therefore degree centrality = 6-1=5
Fig4: Ego network example
Betweenness centrality:
10
adjacency matrix for organization 1, then A² contains the number of paths of the length 2. We need to count the number of paths of length 2 for non-adjacent pairs of actors since these will be geodesics. It follows the formula A² *1 − A+i,j, where 1 is a matrix of all 1’s, gives the number of geodesics of length 2 (Borgatti and Everett and, 2005).
Fig5: Betweenness centrality calculation matrix example
The betweenness centrality of organization 1 (the ego) is the sum of the reciprocals of the entries, in the given example the betweenness centrality is equal to 9.
Central position:
As recommended by Ryan T. (2009), in order to perform a logistic regression analysis it is recommended testing for multi-collinearity between variables (Ryan T., 2009). The correlation test showed high correlation (r=0.837) between betweenness centrality and degree centrality variables. Therefore, and to avoid such biased which might affect our analysis, a new variable was constructed (Central position) to investigate network centrality influence on our dependent variables. Additionally, one of Logistic regression advantages is that we can directly compute this new term when executing the LR analysis.
Control variables:
11
Table4: Description of variables
Results and Analysis:
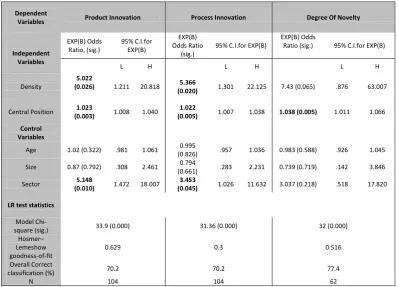
We have applied a logistic regression (LR) for our research analysis. Logistic regression is used to model the categorical type (nominal scale) of data. It is used to predict the relationship between one or multiple predictors (independent variables) and the dependent variable. Table5 shows the result of our regression analysis for the research dependent variables. All three analyses showed an overall goodness of models fit to the data as can be seen from LR statistics. Goodness of model fit could be assessed either from significance Model Chi-square or Hosmer–Lemeshow goodness-of-fit test with higher than 5% p-value, which is further confirmed with correct classification percentage. The results for network density give support to hypothesis 1a (H1a), which suggest that network density has a positive relationship with Product innovation. Since the analysis shows greater than 1 of Odds Ratio (OR). For product innovation, network density, (OR=5.022, p-value= 0.026) suggests a significant positive influence on the likelihood of increase in product innovation for organization with dense network. Furthermore, having high central position (the interaction term between Betweenness centrality and Degree centrality) in the network (RO=1.023, p-value=0.003) is also having a significant positive relationship with product innovation supporting hypothesis 2a (H2a). However, control variables age and size showed insignificant positive and negative relationship respectively. Whereas, organization’s sector have had exerted a significant and positive relationship with product innovation. Moreover, service organizations are more than five times more likely to produce product innovation than the manufacturing organizations.
Our data analysis showed same findings for process innovation, network density showed a highly positive relationship with process innovation (RO=5.366, p-value= 0.020), thus providing support for hypothesis 1b (H1b). Additionally, hypothesis 2b (H2b) was supported were our analysis indicate that being in a central position in the network could positively and significantly enhance process
Variables Description Measurement
Dependent Variables
Product innovation
The market introduction of a new or a significantly improved good or service with respect to its capabilities.
Dummy variable: 1 if the firm has introduced product innovation, 0 otherwise
Process innovation
The implementation of a new or significantly improved production process, distribution method, or supporting activity.
Dummy variable: 1 if the firm has introduced process innovation, 0 otherwise
Degree of Novelty (Radical innovation)
Product or process innovations that are new to the market
Dummy variable: 1 if the firm has introduced product and/or process innovation new to the market, 0 otherwise
Independent Variables
Density a measure of connectedness between members in a network
Calculated as the number of ties between a respondent’s partners, divided by the maximum number of all possible ties between those partners Central Position An interaction term between degree
centrality and Betweenness centrality – see the description of degree centrality and Betweenness centrality – Degree centrality: the degree to which a firm is involved with other actors in the network.
Betweenness centrality: is concerned with the position of a firm which lies between other firms in the network.
Degree centrality: Measured by the number of immediate partners that an actor has in their network. Betweenness centrality: Measure by the extent to which a firm is located on the shortest path (i.e., geodesic) between any two actors in its network
Control Variables
Company age Year of establishment
Company size Number of full time employees Dummy variable: 1 if the firm is Large size firm, and 0 if Medium size Main activity sector classification (
manufacturing/Service)
Dummy variable: 1 if the firm is in the manufacturing sector
12
innovation (RO= 1.022, p-value= 0.005). Nevertheless, only organization sector as a control variable that showed a positive and significant association to process innovation. Likewise, services organizations are more likely to process innovate by over three times the manufacturing sector. Organizations seeking to develop more novel (radical) innovation should pay more attention to its network structure embeddedness in terms of its density and position. As seen in Table5, for the degree of innovation novelty, our analysis suggests that a dense network has a positive and insignificant influence on degree of novelty at 5% level (RO=7.43, p-value=0.065). Therefore, our findings show lack of support for hypothesis 1c (H1c). On the other hand, the regression analysis model displays that occupying a central position seems to have positive and significant impact on degree of novelty (RO=1.038, p-value= 0.005) supporting the research hypothesis2c (H2c). Age and size analysis suggest a negative and insignificant association with degree of novelty. While, sector has positive, but insignificant relationship with the degree of novelty.
Dependent
Variables Product Innovation Process Innovation Degree Of Novelty
Independent Variables EXP(B) Odds Ratio, (sig.) 95% C.I.for EXP(B) EXP(B) Odds Ratio (sig.)
95% C.I.for EXP(B)
EXP(B) Odds
Ratio (sig.) 95% C.I.for EXP(B)
L H L H L H
Density
5.022
(0.026) 1.211 20.818 5.366
(0.020) 1.301 22.125 7.43 (0.065) .876 63.007
Central Position 1.023
(0.003) 1.008 1.040
1.022
(0.005) 1.007 1.038 1.038 (0.005) 1.011 1.066
Control Variables
Age 1.02 (0.322) .981 1.061 0.995
(0.826) .957 1.036 0.983 (0.588) .926 1.045
Size 0.87 (0.792) .308 2.461 0.794
(0.661) .283 2.231 0.739 (0.719) .142 3.846
Sector 5.148
(0.010) 1.472 18.007
3.453
(0.045) 1.026 11.632 3.037 (0.218) .518 17.820
LR test statistics
Model
Chi-square (sig.) 33.9 (0.000) 31.36 (0.000) 32 (0.000)
Hosmer– Lemeshow goodness-of-fit
0.629 0.3 0.516
Overall Correct
classification (%) 70.2 70.2 77.4
N 104 104 62
[image:12.595.99.499.275.562.2]Tests are at 95% confidence Interval
Table5: results of the regression analysis
Discussion and conclusion:
13
For organizations in Saudi High and Medium sectors, the analysis of product innovation and process innovation outcomes are positively and significant associated with organizations that structurally embeddeded in a dense network and have high betweenness centrality and high degree centrality (e.g. high network central position). These findings suggest that organizations active in a dense network which in turn enjoys trust, and a shared identity, which increases knowledge and information transfer among network actors (Phelps, 2010; Schilling and Phelps, 2007). Moreover, being highly central in terms of betweenness centrality and high degree centrality is beneficial in a way that is reflected on focal firm ability and capability to absorb the flow of information in the network (Owen-Smith and Powell, 2004). Hence, as results of the analysis indicated, an increase in the origination’s product and process innovation outcomes. For more novel innovations, network density showed a positive, but insignificant relationship with degree of novelty at 5%. Whereas, central position in the network is highly impacting innovation novelty outcome which stress the importance of how well the focal firm is connected to others.
In respect to the organization specific features such as size and age, the results showed not to have significant impact on its innovativeness or degree of novelty of innovation. However, service and manufacturing sectors show a positive and significant role in determining innovation outcome, shows higher association in service organization than manufacturing. This paper results suggest that it is better for manufacturing firms to reconsider their network structural emmebdencess to more benefit from their connection and gain access to knowledge and information.
This research is not free from Limitation, which may provide directions for future research. First, although we have investigated the network structure characteristics, the data are country specific – Saudi industry-and depend on the type and structure of the sampled organizations. Secondly, the paper looked at network structure properties in isolation of network relational dimension (e.g. tie strength), which could have its effect on the innovation outcome or degree of novelty. Therefore, it seems useful for future research to consider these aspects jointly.
14 References:
Ahuja, G., 2000, Collaboration networks, structural holes, and innovation: A longitudinal study: Administrative Science Quarterly, v. 45, p. 425-455.
Baer, M., 2010, The Strength-of-Weak-Ties Perspective on Creativity: A Comprehensive Examination and Extension: Journal of Applied Psychology, v. 95, p. 592-601.
Battisti, G., and P. Stoneman, 2010, How Innovative are UK Firms? Evidence from the Fourth UK Community Innovation Survey on Synergies between Technological and Organizational Innovations: British Journal of Management, v. 21, p. 187-206.
Bellamy, M. A., S. Ghosh, and M. Hora, 2014, The influence of supply network structure on firm innovation: Journal of Operations Management, v. 32, p. 357-373.
Borgatti, S.P., Everett, M.G. and Freeman, L.C. 2002. Ucinet 6 for Windows: Software for Social Network Analysis. Harvard, MA: Analytic Technologies.
Borgatti, S. P., and P. C. Foster, 2003, The network paradigm in organizational research: A review and typology: Journal of Management, v. 29, p. 991-1013.
Borgatti S., Everett M. & Johnson J. (2013) Analysing Social Network, Thousand Oaks, CA: SAGE Publications.
Bradley, S. W., J. S. McMullen, K. Artz, and E. M. Simiyu, 2012, Capital Is Not Enough: Innovation in Developing Economies: Journal of Management Studies, v. 49, p. 684-717.
Burt, R. S., 1984, NETWORK ITEMS AND THE GENERAL SOCIAL SURVEY: Social Networks, v. 6, p. 293-339.
Capaldo, A., 2007, Network structure and innovation: The leveraging of a dual network as a distinctive relational capability: Strategic Management Journal, v. 28, p. 585-608.
Casciaro, T., 1998, Seeing things clearly: social structure, personality, and accuracy in social network perception: Social Networks, v. 20, p. 331-351.
Coombs, R., M. Harvey, and B. S. Tether, 2003, Analysing distributed processes of provision and innovation: Industrial and Corporate Change, v. 12, p. 1125-1155.
Faems, D., B. Van Looy, and K. Debackere, 2005, Interorganizational collaboration and innovation: Toward a portfolio approach: Journal of Product Innovation Management, v. 22, p. 238-250. Frishammar, J., M. Kurkkio, L. Abrahamsson, and U. Lichtenthaler, 2012, Antecedents and
Consequences of Firms' Process Innovation Capability: A Literature Review and a Conceptual Framework: Ieee Transactions on Engineering Management, v. 59, p. 519-529.
Gilsing, V., B. Nooteboom, W. Vanhaverbeke, G. Duysters, and A. van den Oord, 2008, Network embeddedness and the exploration of novel technologies: Technological distance, betweenness centrality and density: Research Policy, v. 37, p. 1717-1731.
Gilsing, V. A., and G. M. Duysters, 2008, Understanding novelty creation in exploration networks - Structural and relational embeddedness jointly considered: Technovation, v. 28, p. 693-708. Gulati, R., and M. Gargiulo, 1999, Where do interorganizational networks come from?: American
Journal of Sociology, v. 104, p. 1439-1493.
Gulati, R., N. Nohria, and A. Zaheer, 2000, Strategic networks: Strategic Management Journal, v. 21, p. 203-215.
Ibarra, H., 1993, NETWORK CENTRALITY, POWER, AND INNOVATION INVOLVEMENT -
DETERMINANTS OF TECHNICAL AND ADMINISTRATIVE ROLES: Academy of Management Journal, v. 36, p. 471-501.
Kilduff, M., & Tsai, W. (2004) Social networks and organizations, Thousand Oaks, CA: Sage. Lasagni, A., 2012, How Can External Relationships Enhance Innovation in SMEs? New Evidence for
Europe: Journal of Small Business Management, v. 50, p. 310-339.
15
Lee, G. K., 2007, The significance of network resources in the race to enter emerging product markets: The convergence of telephony communications and computer networking, 1989-2001: Strategic Management Journal, v. 28, p. 17-37.
Liao, S.-h., W.-C. Fei, and C.-T. Liu, 2008, Relationships between knowledge inertia, organizational learning and organization innovation: Technovation, v. 28, p. 183-195.
Marsden, P. V., 1990, NETWORK DATA AND MEASUREMENT: Annual Review of Sociology, v. 16, p. 435-463.
Marsden, P. V., 2002, Egocentric and sociocentric measures of network centrality: Social Networks, v. 24, p. 407-422.
Mol, M. J., and J. Birkinshaw, 2009, The sources of management innovation: When firms introduce new management practices: Journal of Business Research, v. 62, p. 1269-1280.
Nieto, M. J., and L. Santamaria, 2007, The importance of diverse collaborative networks for the novelty of product innovation: Technovation, v. 27, p. 367-377.
Owen-Smith, J., and W. W. Powell, 2004, Knowledge networks as channels and conduits: The effects of spillovers in the Boston biotechnology community: Organization Science, v. 15, p. 5-21. Organization For Economic Co-Operation and Development - OECD (2005). Oslo Manual: Guidelines
For Collecting And Interpreting Innovation Data. A joint publication of OECD and Eurostat. 3rd addition
Perkmann, M., and K. Walsh, 2007, University-industry relationships and open innovation: Towards a research agenda: International Journal of Management Reviews, v. 9, p. 259-280.
Phelps, C. C., 2010, A LONGITUDINAL STUDY OF THE INFLUENCE OF ALLIANCE NETWORK STRUCTURE AND COMPOSITION ON FIRM EXPLORATORY INNOVATION: Academy of Management Journal, v. 53, p. 890-913.
Pittaway, L., M. Robertson, K. Munir, D. Denyer, and A. Neely, 2004, Networking and innovation: a systematic review of the evidence: International Journal of Management Reviews, v. 5-6, p. 137-168.
Powell, W. W., K. W. Koput, and L. SmithDoerr, 1996, Interorganizational collaboration and the locus of innovation: Networks of learning in biotechnology: Administrative Science Quarterly, v. 41, p. 116-145.
Radas, S., and L. Bozic, 2009, The antecedents of SME innovativeness in an emerging transition economy: Technovation, v. 29, p. 438-450.
Reichstein, T., and A. Salter, 2006, Investigating the sources of process innovation among UK manufacturing firms: Industrial and Corporate Change, v. 15, p. 653-682.
Rodan, S., and C. Galunic, 2004, More than network structure: How knowledge heterogeneity influences managerial performance and innovativeness: Strategic Management Journal, v. 25, p. 541-562.
Rowley, T., D. Behrens, and D. Krackhardt, 2000, Redundant governance structures: An analysis of structural and relational embeddedness in the steel and semiconductor industries: Strategic Management Journal, v. 21, p. 369-386.
Ruef, M., 2002, Strong ties, weak ties and islands: structural and cultural predictors of organizational innovation: Industrial and Corporate Change, v. 11, p. 427-449.
Ryan, Thomas P. (2009) Modern Regression Methods, 2nd ed. New Jersey: John Wiley & Son, Inc. Schilling, M. A., and C. C. Phelps, 2007, Interfirm collaboration networks: The impact of large-scale
network structure on firm innovation: Management Science, v. 53, p. 1113-1126.
Scott J. & Carrington P. (eds.) (2011) the Sage Handbook of Social Network Analysis, London: Sage Publication.
Scott, J. (2013) Social network analysis, 3rd ed. London: SAGE Publications.
Soh, P. H., 2003, The role of networking alliances in information acquisition and its
16
Tether, B. S., and A. Tajar, 2008a, Beyond industry-university links: Sourcing knowledge for innovation from consultants, private research organisations and the public science-base: Research Policy, v. 37, p. 1079-1095.
Tether, B. S., and A. Tajar, 2008b, The organisational-cooperation mode of innovation and its prominence amongst European service firms: Research Policy, v. 37, p. 720-739.
Vega-Jurado, J., A. Gutierrez-Gracia, I. Fernandez-de-Lucio, and L. Manjarres-Henriquez, 2008, The effect of external and internal factors on firms' product innovation: Research Policy, v. 37, p. 616-632.
Wasserman, S., & Faust, K. (1994) Social network analysis: Methods and applications, Cambridge, UK: Cambridge University Press.
Weterings, A., and R. Boschma, 2009, Does spatial proximity to customers matter for innovative performance? Evidence from the Dutch software sector: Research Policy, v. 38, p. 746-755. Zeng, S. X., X. M. Xie, and C. M. Tam, 2010, Relationship between cooperation networks and