11th Asia-Pacific Conference on Combustion,
The University of Sydney, NSW Australia 10th -14th December 2017.
Effect of Miller Cycle and Fuel Injection Strategy on Performance of Marine
Diesel Engine
Xiuxiu Sun1,3, Xingyu Liang1, Peilin Zhou3, Yuehua Qian2, Teng liu2, Bo Liu2
1Affiliation
1. State key Laboratory of Engines, Tianjin University, Tianjin 300072, China
2Affiliation
2. China Shipbuilding Power Engineering Institute Co. Ltd, Shanghai 200120, China
3Affiliation
3. Naval Architecture, Ocean &Marine Engineering, University of Strathclyde, Glasgow G4 0LZ, UK
Abstract
The computational fluid dynamic (CFD) model is presented to investigate the performance of large two-stroke marine diesel engine. The simulated model is validated with the experiment data. The in-cylinder pressure of simulated model is agreement with the experiment data. The errors of NOx and CO2 are also
in accepted range. The effect of Miller cycle, injection sequence and pilot injection are investigated on the combustion and emissions using this model. The results show that the in-cylinder pressure decreases with deeper of Miler cycle level. However, The NOx has a slight reduced. The quantity of
decreased NOx is not satisfy the requirement of Tier Ⅲ. We also found that the injection interval angle augment of two injectors makes the combustion pressure decrease. The NOx is
decreased to 8.95 g/kWh. However, the ISFC is higher 7.3 g/kWh compared with base value when the injection interval angle is 8 °CA. The appropriate pilot injection strategy can decrease the NOx and ISFC, such as P10I5. These methods are
not reduced the quantity of NOx to meet the requirement.
1 Introduction
The environment protection has been attention by more and more people. The marine diesel engine emissions are limited strictly.The International Maritime Organization (IMO) Tier III limits NOx emissions to 3.4 g/kWh in the emission control areas, which is a 76% reduction compared with the 14.4 g/kWh stipulated in Tier II [[1]. The Tier III [2]is more strictly for the quantity of NOx. So, more measures are used in marine diesel engine for reducing the emissions, such as exhaust gas recirculation (EGR), selective catalytic reduction (SCR), injection strategy and Miller cycle.
Numerical simulation technology has been widely used, because they are efficient in terms of human and financial resource. Kontoulis et al. [3] used the KIVA-3 code as a modeling platform to study the effects of advanced injection strategies. By adding an appropriately timed pilot injection, they achieved fuel savings of approximately 1.7%, without increasing NOx emissions. Verschaeren et al. [4] investigated
NOx emissions in a medium-speed heavy-duty diesel engine
using EGR and Miller timing. An injection advance during low-load operation raised combustion pressures and shortened combustion duration, lowering CO droop and PM emissions and increasing efficiency. Chen et al. [5] studied pilot injection for improvement of combustion characteristics in a heavy-duty diesel engine. Their results demonstrated that with the advance of pilot injection timing, the peak in-cylinder pressure is declined, the ignition delay of the main combustion is shortened, and the NOx and soot emissions are reduced,
whereas the HC and CO emissions are increased. The injection strategy has large effect on marine engine performance and emissions. So, it is necessary to research different reducing NOx methods.
This paper analyzed the effect of Miller cycle, injection sequence and pilot injection on the marine diesel engine performance and emission. The computational fluid dynamic (CFD) is validated with experimental data. The in-cylinder pressure and emissions are compared for different measures. The potential of reducing NOx is analyze. This paper provides
guide direction to choosing appropriate method for researchers to droop the quantity of NOx.
2 Numerical Model
2.1 Marine engine CFD model
The present CFD model is conducted on the 6S35ME-B9. The structure parameter can found in the table 1. The CFD model was established on this structure using CONVERGE 2.3 software.
cylinder number 6
Bore (mm) 350
Stroke (mm) 1550
Displacement (L) 149
Speed (r/min) 142
Power (kWh) 3575
[image:2.595.119.227.276.428.2]Table1: 6S35ME-B9 test engine specifications
Figure 1 shows the three-dimensional structure of model. This model includes a scavenge box, cylinder and exhaust port. The k-ε two-equation mode is used as turbulence model. Kelvin Helmholtz-Rayleigh Taylor model is applied to the simulation of spray breakup. The NTC collision model is implemented to simulate the fuel collision. The wall splash model is used in the O’Rourke model based on Weber number, film thickness and viscosity. The detailed chemical solver combustion model is used to simulate the fuel ignition. For the emissions generate models, the Extend Zeldovich NOx model is applied to simulate
the production of NOx. Hiroyasu-NSC Model is used to
simulate soot production respectively. Those models are chosen in CONVERGE. The injected liquid temperature is set to 345 K. The injection duration is 15.36°CA and the total injection mass is 0.0126 kg, which was obtained from experimental data.
Figure 1:The three-dimensional geometric structure
The CFD model is based upon continuity, momentum and energy conservation laws [6]. Mesh grid size is decided based on the desired calculation time and calculation accuracy. Grid control includes a base grid, adaptive mesh refinement and fixed embedding. The effect of the base grid and the adaptive mesh refinement are shown in Fig. 2. As seen in Fig. 2 (a), the compression pressure of base grid 0.04 m is in agreement with that of base grid 0.03 m. The calculation accuracy increases gradually with decreasing base grid size. If the adaptive mesh refinement is set to 4, the calculated pressure is in good agreement with the experiment data, as shown in Fig. 2 (b). However, the calculation time also increases. Setting the base grid to 0.04 m and the adaptive mesh refinement to 4 can ensure the accuracy of the simulation.
Figure 2: The effect of grid on the pressure: (a) base grid (b) adaptive mesh refinement
The CFD model will be used in the simulation. The simulated value was validated with the experimental data.
2.2 Model Validation
The in-cylinder pressure and emissions were tested when the engine speed is 142 r/min and the load operated 100 %. The calculated value was validated with the experimental data. Stratsianis et al.[7] researched the post-injection on the effect of marine diesel engine performance. The simulated value also validated with the experimental data under the 100 % load. Fig.1 shows the comparison of in-cylinder pressure between in simulation and experiment.
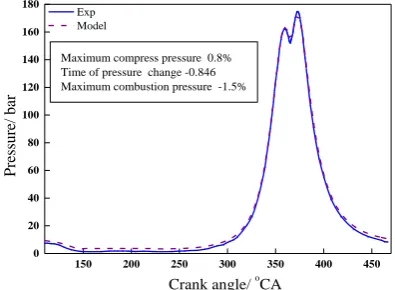
Figure 3 shows the in-cylinder pressure comparison between the calculated value and experimental data. The errors of maximum pressure during compress and combustion process are 0.8% and 1.5%, respectively. The time of change pressure delay is 0.846°CA for the model. The in-cylinder pressure is in good agreement with the experimental data. The model can accurate predicts the pressure of marine diesel engine. The NOx and CO2 emissions are also compared to validate the
accuracy of model, which are shown in Fig 4. For NOx, the
error is 2.8% compared with simulation and experiment value, which is acceptable for predicting the quantity of NOx. The
error for CO2 is larger than that for NOx. The single component
n-tetradecane is used as alternative fuel to simulate the combustion process. And, the new n-tetradecane mechanism is reduced for decreasing the calculated time. Some reactions are disappeared for CO2 produce mechanism. The quantity of NOx
is close to the experimental data, that is to say: the CFD model can accurate predict the quantity of NOx using n-tetradecane as
[image:2.595.324.522.403.548.2]alternative fuel.
[image:2.595.324.526.583.729.2]Figure 3: Comparison of in-cylinder pressure for the simulation and experiment
Figure 4: Comparison of NOx and CO2 for the simulation and
experiment
300 310 320 330 340 350 360
0 40 80 120 160 200 Pressure/ bar 0.03 0.04 0.05 0.06 0.07
Crank angle/ o
CA
150 200 250 300 350 400 450
0 40 80 120 160 200 Pressure/ bar Exp AMR-4 AMR-2 AMR-0
Crank angle/ o
CA
calculation time AMR-4 33.26h AMR-2 15.12h AMR-0 4.29h
(a) base grid (b) adaptive mesh refinement
150 200 250 300 350 400 450
0 20 40 60 80 100 120 140 160 180 Pres su re/ b ar Exp Model
Crank angle/ oCA
Maximum compress pressure 0.8% Time of pressure change -0.846 Maximum combustion pressure -1.5%
[image:2.595.59.288.602.698.2]3 Results and Discussion
3.1 Effect of Miller Cycle
The decreased inlet gas temperature causes the NOx production
less. The Miller cycle makes the in-cylinder gas temperature lower. The result can be realized by delaying the close time of exhaust valve for the two-stroke marine diesel engine.
[image:3.595.312.539.71.221.2]The different Miller cycle patterns were simulated to research the effect on the marine diesel engine performance and emissions. The 5°CA was used as interval angle of exhaust valve delay close time. So, the four methods were named as M5, M10, M15 and M20. The scavenging pressure was improved to offset the loss of fresh charge. Fig.5 shows the changes of intake pressure and air-fuel ratio under different Miller cycle. The intake pressure increases with delaying of exhaust valve close time, which can makes the equivalence ratio almost same for the Miller cycle.
[image:3.595.66.275.279.435.2]Figure 5:The changes of intake pressure and air-fuel ratio using different Miller cycle
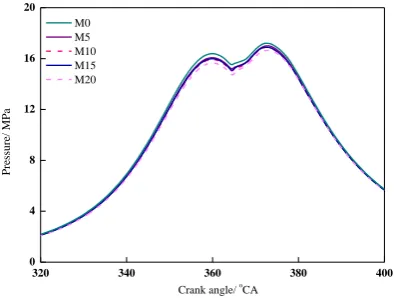
Figure 6:The changes of in-cylinder pressure using different Miller cycle
Figure 6 shows changes of the in-cylinder pressure with crank angle using different Miller cycle. It can be seen that the in-cylinder pressure decrease with the exhaust valve close time delay. The augmented intake pressure makes the in-cylinder pressure higher than that of the original engine in the bottom dead center (BDC) nearby. Because, the equivalence ratio of different cases are almost same.
Figure 7:The changes of NOx and ISFC using different Miller
cycle
The changes of NOx and ISFC are shown in Fig.7. The
in-cylinder temperature decreases with exhaust valve close time delay. The fresh charge reduces residual gas temperature. And, The NOx are produced in higher temperature and rich oxygen condition. The range of high temperature shrinks gradually along with Miller cycle level deepening. The quantity of NOx
decrease 11.5 % than that of original engine. However, it is a great deal of different compared with require of Tier III. The ISFC increases with the exhaust valve close time delay. The compress pressure decreases during compress and power stroke (Fig.6). So, the indicated power also reduces. However, the injection fuel mass is constant. These make the ISFC increasing.
3.2 Effect of injection sequence
[image:3.595.73.271.482.631.2]The marine diesel engine performance also was analyzed under the different injection sequence. Two injectors were distributed uniform on the cylinder head. Two injectors were injected at the same time for the original engine. The different interval angles were investigated between in two injectors. The interval angles of two injectors were set to 2°CA, 4°CA, 6°CA and 8°CA.
Figure 8:The changes of in-cylinder pressure using different injection sequence
The variations of in-cylinder pressure are shown in Fig.8 for the different injection sequence. It is obvious that the maximum combustion pressure is decreased with increasing the interval angles of two injectors. The increasing pressure is caused by the fuel combustion after the top dead center (TDC). The maximum combustion pressure drops with interval angle of two injectors increasing. And, the combustion pressure peak value nearly disappears when the injection interval angles set to
3.6 4.0 4.4 4.8 5.2 intake pressure air-fuel ratio in ta k e p re ssu re /b a r
base M5 M10 M15 M20
0 9 18 27 36 45 A ir -f u e l r a ti o
320 340 360 380 400
0 4 8 12 16 20 M0 M5 M10 M15 M20 P re ss ure / M P a
Crank angle/ o
CA 11 12 13 14 NOx ISFC NO x /g /k Wh
base M5 M10 M15 M20 154 156 158 160 ISFC/ g /k Wh
350 360 370 380 390 400 410 420 0 4 8 12 16 20 0 2 4 6 8 P re ss ure / M P a
[image:3.595.310.520.487.647.2]8 °CA. The less fuel will be burn after the top dead center. The degree of combustion will decrease. So, the in-cylinder pressure will decrease. .
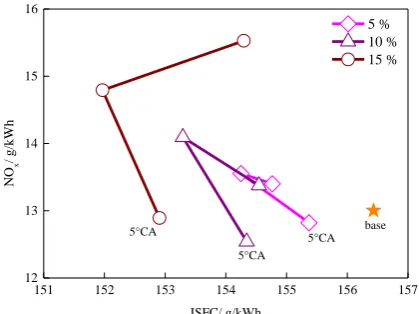
Figure 9:The changes of NOx and ISFC using different
injection sequence
Figure 9 shows the variations of NOx and ISFC using different
injection sequence. The trend of NOx decreases with the
interval angles augment of two injections. The quantity of NOx
is reduced by 4.05 g/kWh when the interval angles increases to 8°CA. The more fuel was uncompleted burn with increment of interval angles. The changes of in-cylinder pressure can explain this phenomenon. The lower temperature makes the NOx
production less. The injection mass is constant. The ISFC is inversely proportional to the power. The lessened combustion pressure also makes the power decreased. So, the ISFC increases with augment of interval angles.
In conclusion, the interval angles augment of two injections reduces the quantity of NOx. The decrement of NOx is larger
using injection sequence than the value using Miller cycle. However, the increased of ISFC is also large. The method is not advised to reduce the quantity of NOx using injection sequence.
3.3 Effect of pilot injection
The pilot injection measure was widely used to reduce the NOx.
Bae et al. [8] studied the effect of pilot injection on combustion and emission characteristics in a marine diesel engine. The results show that variation of pilot injection timing affects auto ignition and heat release rate. Huang et al. [9] also invested the effect of pilot injection on low temperature combustion in diesel engine under a medium EGR rate. The decrease in pilot-main interval can greatly reduce NOx emission and ISFC. So,
the effect of pilot injection will be researched on the performance of marine diesel engine in this paper. The pilot injection quantity and interval time were investigated for reducing the NOx. Table 2 shows the investigated conditions.
The pilot injection quantity is 5 %, the interval time of pilot and main injection is 5 °CA. This condition will be named P5I5. The same naming pattern were used in others conditions.
Pilot injection quantity Interval time (°CA)
5 % 5 10 15
10 % 5 10 15
15 % 5 10 15
Table2: the pilot injection quantity and pilot interval
Figure 10:The changes of in-cylinder pressure using pilot injection strategy
Figure 11:The changes of NOx and ISFC using pilot injection
strategy
The comparisons of in-cylinder pressure are shown in Fig.10. It can be seen that the in-cylinder pressure increases with the argument of pilot injection quantity and interval time. The fuel was burn during compress stroke, which cause the in-cylinder pressure increasing. Due to the quantity of fuel lessen in power stroke, the in-cylinder pressure is almost same for different pilot injection quantity and interval time.
Figure 11 shows the compared relationship between NOx and
ISFC using pilot injection strategy. It can be seen that the ISFC decreases with the augment of interval time of pilot and main injection. The ISFC has lower value when the interval time of pilot and main injection is 15°CA. The P10I5 has minimum NOx value. Nevertheless, the ISFC is medium. Howeer, the
simulated value of NOx and ISFC are lower than the base value for the case P10I5. So, The P10I5 is an optimum method considering the quantity of NOx and ISFC. The quantity of NOx and ISFC are lower than that of base calculated.
In conclusion, the pilot injection can be used to reduce the NOx
for the marine diesel engine. However, the reduced value of NOx and ISFC are less than these values using Miller cycle and
injection sequence. That is to say: the pilot injection method needs to used coupling others strategy, which can reduces NOx
to the required value of Tier Ⅲ .
4 Conclusions
The CFD model of marine diesel engine was established in this
8 10 12 14 16 NO x /g /k Wh
base 2 4 6 8 156 159 162 165 NOx ISFC ISFC/ g /k Wh
320 340 360 380 400
4 8 12 16 20 P5I5 P5I10 P5I15 P10I5 P10I10 P10I15 P15I5 P15I10 P15I15 P re ss ure / M P a
Crank angle/ o
CA
[image:4.595.311.521.277.434.2]paper. The model was validated with the experimental data. Then, the effect of Miller cycle, injection sequence and pilot injection were investigated on the combustion and emission of marine diesel engine. The results as follows:
1. The in-cylinder pressure and emissions by calculated by CFD model were in agreement with the experimental data. 2. The in-cylinder pressure decreases with the exhaust valve close time delay. The NOx also decreases. However, the
decrement of NOx is less. It is not meet the requirement of
Tier Ⅲ.
3. The in-cylinder pressure and NOx decreases with the
injection interval angles augment of two injectors. The NOx is reduced to 8.95 g/kWh when the injection interval
angle set to 8°CA.
4. The in-cylinder pressure increases using the pilot injection. The P10I5 has minimum value of NOx and ISFC. The
pilot injection methods needs to used coupling others strategy.
5 Acknowledgment
This work was supported by National Natural Science Foundation of China (No. 51376136 and No. 91641111) and National Sci-Tech Support of China (2016YFC0205304). The author also wants to appreciate the support of high-tech Ship Research Program of MIIT.
References
. http://www.DieselNet.com/standards, Emission Standards, IMO Marine Engine, 13.07.2017(2017).
Herdzik, J., Emissions from marine engines versus IMO certification and requirements of tier 3. Journal of KONES Powertrain and Transport, 18(2011)
C.C.L.K. P. Kontoulis, The international symposium on diagnostics and modeling of combustion in intern al combustion engines 1(2008).
R. Verschaeren, W. Schaepdryver, T. Serruys, M. Bas tiaen, L. Vervaeke, S. Verhelst, Energy 76(2014) 614-621.
L. Chen, H. Zeng, X.B. Cheng, Applied Mechanics a nd Materials, 651-653(2014)866-874.
A.A. Amsden, P.J. Orourke, T.D. Butler, Nasa Sti/rec on Technical Report N, 89(1989)
Stratsianis, V., P. Kontoulis and L. Kaiktsis, Effects of Fuel Post-Injection on the Performance and Pollut ant Emissions of a Large Marine Engine. 2(2016). M.Bae1․D SikHan․Y J. Chang․J H Song․C H Jeon,,Jo
urnal of the Korean Society of Marine Engineering,(2 010)37-45.
11th Asia-Pacific Conference on Combustion,
The University of Sydney, NSW Australia 10th -14th December 2017.