3T MRI Investigation of Cardiac Left
Ventricular Structure and Function in
a UK Population: The Tayside Screening
for the Prevention of Cardiac Events
(TASCFORCE) Study
Stephen J. Gandy, PhD,
1,2Matthew Lambert, MBChB,
3Jill Belch, FRCP,
3Ian Cavin, PhD,
2Elena Crowe, DDR,
1Roberta Littleford, PhD,
3Jennifer A. MacFarlane, PhD,
2Shona Z. Matthew, PhD,
3Patricia Martin, DDR,
1R. Stephen Nicholas, PhD,
1,2Allan Struthers, FRCP,
3Frank Sullivan, FRSE,
4,5Shelley A. Waugh, PhD,
2Richard D. White, FRCR,
1,6Jonathan R. Weir-McCall, FRCR,
3and J. Graeme Houston, MD, FRCR
1,3*
Purpose:To scan a volunteer population using 3.0T magnetic resonance imaging (MRI). MRI of the left ventricular (LV) structure and function in healthy volunteers has been reported extensively at 1.5T.
Materials and Methods:A population of 1528 volunteers was scanned. A standardized approach was taken to acquire steady-state free precession (SSFP) LV data in the short-axis plane, and images were quantified using commercial soft-ware. Six observers undertook the segmentation analysis.
Results: Mean values (6standard deviation, SD) were: ejection fraction (EF) 5 69 6 6%, end diastolic volume index (EDVI)571613 ml/m2, end systolic volume index (ESVI)5 2267 ml/m2, stroke volume index (SVI)54968 ml/m2, and LV mass index (LVMI)555612 g/m2. The mean EF was slightly larger for females (69%) than for males (68%), but all other variables were smaller for females (EDVI 68v77 ml/m2, ESVI 21v25 ml/m2, SVI 46v52 ml/m2, LVMI 49v64 g/m2, all P < 0.05). The mean LV volume data mostly decreased with each age decade (EDVI males: –2.9 6 1.3 ml/m2, females: –3.1 6 0.8 ml/m2; ESVI males: –1.3 6 0.7 ml/m2, females: –1.7 6 0.5 ml/m2; SVI males: –1.7 6 0.9 ml/m2, females: –1.460.6 ml/m2; LVMI males: –1.661.1 g/m2, females: –0.260.6 g/m2) but the mean EF was virtually stable in males (0.660.6%) and rose slightly in females (1.260.5%) with age.
Conclusion: LV reference ranges are provided in this population-based MR study at 3.0T. The variables are similar to those described at 1.5T, including variations with age and gender. These data may help to support future population-based MR research studies that involve the use of 3.0T MRI scanners.
J. MAGN. RESON. IMAGING 2016;44:1186–1196.
View this article online at wileyonlinelibrary.com. DOI: 10.1002/jmri.25267
Received Jan 6, 2016, Accepted for publication Mar 28, 2016.
*Address reprint requests to: J.G.H., Department of Clinical Radiology, Ninewells Hospital, Dundee, DD1 9SY, UK. E-mail:[email protected]
This is an open access article under the terms of the Creative Commons Attribution License, which permits use, distribution and reproduction in any medium, provided the original work is properly cited.
The copyright line for this article was changed on 23 September 2016 after original online publication.
From the1NHS Tayside Clinical Radiology, Ninewells Hospital, Dundee, UK;2NHS Tayside Medical Physics, Ninewells Hospital, Dundee, UK;3University of
Dundee School of Medicine, Dundee, UK;4Department of Family and Community Medicine, University of Toronto, Toronto, Canada;5Department of
Research and Innovation, North York General Hospital, Toronto, Canada; and6Department of Clinical Radiology, University Hospital of Wales, UK
T
he use of cardiac magnetic resonance (MR) for the assessment of left ventricular (LV) structure and func-tion is a well-established technique that is used for both clinical and research investigations. Volunteer “normal ranges” have been published for data acquired on 1.5Tsys-tems,1–3 with an emphasis on the use of the steady
state-gradient echo sequence since the associatedT2/T1weighting
provides excellent contrast between the myocardium and the blood pool. Other research groups have extended this work to acquire MR LV data on larger-scale populations. Exam-ples of these include the following studies: Framingham
Offspring,4 Dallas Heart,5MESA,6 AGES Reykjavik,7
Ger-man SHIP,8 and Lichfield LARGE Heart.9 Further
large-scale investigations such as the UK Biobank10 are also in
progress. However, to date all population-based cardiac MR studies have been conducted using 1.5T scanners.
With the increasing use of 3.0T MR scanners for clin-ical imaging, there is a need to establish equivalent data for
images acquired at this higher field strength.11 Small
com-parison studies of 1.5T vs. 3.0T MR in healthy volunteers
have previously been undertaken.12,13Recent work from Liu
et al has reported the use of a 3.0T MR system for MR
scanning of a population of healthy African Americans,14
although it is known from previous work that ethnic
varia-tions in LV structure and function do exist,15so there might
be a need to extend this work to a European setting. Early MR investigations that used 3.0T machines tended to recommend the use of spoiled gradient echo imaging since it was less susceptible to flow-related
arti-facts.16 However, with the development over time of better
shimming techniques, the steady-state sequence has become
the sequence of choice for MR at 3.0T.17
The T1 and T2 relaxation times of tissues are
inher-ently affected by the local magnetic field strength to which
they are exposed, and T1 relaxation times in particular are
elevated at higher field strengths.18In cardiac MR, since the
process of computer segmentation involves the precise delin-eation of myocardial boundaries, it therefore follows that boundary delineation could be perceived differently at 1.5T and 3.0T due to possible variations in myocardium-blood
contrast-to-noise ratio (CNR).19 Such systematic differences
could be clinically important in cases where particular LV “cutoff” values are used to determine the future course of patient treatments; or in longitudinal investigations where comparisons may involve datasets acquired on machines of different field strengths. From a clinical perspective, since LV hypertrophy is an indicator of many underlying cardiac conditions and can also be a strong independent predictor for incident cardiovascular events, a precise definition of
population-based ranges is required.20
The objective of this study therefore was to use MR to examine the LV structure and function of a large UK
popu-lation of volunteers using a standard steady-state gradient echo sequence on a 3.0T scanner in order to establish popu-lation range data capable of comparison with similar data acquired at 1.5T.
Materials and Methods
This MR study was conducted as part of a wider population-based cardiovascular MR investigation of volunteers asymptomatic of car-diovascular disease (CVD) (the Tayside Screening for the Preven-tion of Cardiac Events [TASCFORCE] study). The study was allocated an International Standard Randomised Control Trial Number: ISRCTN38976321. Local research ethical committee (REC) approval for the work was obtained and all volunteers gave informed consent. A total of 1528 volunteers were included in the study, which ran from June 2008 until February 2013. Inclusion criteria were as follows: 1) age 40 years; 2) free from CVD or other indication for statin therapy as recommended by the Scottish Intercollegiate Guidelines Network (SIGN) report 97 (www.sign. ac.uk) published in February 2007; 3) 10-year risk of coronary heart disease below 20% as predicted by the Adult Treatment Panel III (ATPIII) algorithm21; and 4) a plasma B type natriuretic pep-tide (BNP) level greater than the gender specific median. Exclusion criteria included: i) pregnancy; ii) known primary muscle disease; iii) known atherosclerotic disease, including unstable angina, previ-ous myocardial infarction, peripheral arterial disease, amputation, revascularization, hypertension, heart failure, or cerebrovascular event; iv) known diabetes; v) active liver disease; vi) other known illness or contraindication to MR; vii) participation in a clinical trial; viii) inability to give informed consent; ix) known alcohol abuse; and x) blood pressure (BP) of greater than 145/95 mmHg.
Each volunteer was grouped into a “decade band” based on their age at the time of the investigation. The decade bands were defined by age as follows: 1) the “40s” (40–49 years); 2) the “50s” (50–59 years); 3) the “60s” (60–69 years); and 4) the “over 70s” (70 years).
The MR protocol has been described in detail elsewhere,22but
in brief imaging was performed in the head-first supine orientation using a 3T [102x32] Scanner (Magnetom Trio, Siemens, Erlangen, Germany). A body matrix radiofrequency (RF) coil (six elements) was used in combination with a spine array (up to 24 elements).
breath-hold. Parallel imaging was also implemented (integrated parallel acquisition technique, iPAT x2), resulting in a scan time of
<15 seconds per breath-hold.
Image Analysis
All datasets were analyzed once by one member of a team of six medical physics observers (S.G., R.N., J.M., S.W., S.M., and I.C., cardiac MR experience ranging from 7 to 12 years). This was per-formed on a rotational basis in order to ensure (as far as possible) that each observer was responsible for segmenting an equal number of datasets. The images were analyzed using Argus (Siemens Multi-modality Work Platform, VB15 and VB17). Region of interest (ROI) contours were placed around endocardial and epicardial LV borders on all image slices at end-diastole and end-systole that con-tained 50% or more full-thickness myocardium. Quantitative measurements of ejection fraction (EF), end-diastolic volume (EDV), end-systolic volume (ESV), stroke volume (SV), and LV mass (LVM) (at end-diastole) were derived. Papillary muscles were included in the LVM if visually indistinguishable from the myocar-dial wall, but otherwise assigned to the left ventricular blood pool. As far as possible (within the constraints of the software capability) the adopted methodology was performed as per the guidance notes provided by Schulz-Menger et al.23
Statistical Analysis
All original study participants were included in the baseline analy-sis, as a representative UK population of individuals asymptomatic of CVD. A subanalysis of the full cohort was also performed in order to identify those volunteers (“subset cohort”;n5782) who, in addition to being asymptomatic, had more stringent low-risk factor criteria for future CVD. Participants were assigned to this
subset if they had BP< 140/90 mmHg and no history of smok-ing,6 together with plasma BNP lower than 2 SDs above the full cohort gender-specific mean (30.60 pg/ml for men and 53.36 pg/ ml for women).
Normalization of MR LV data to body surface area (BSA) was performed using the simple formula described by Mosteller.24 Data were presented as mean6SD in all cases.
Comparison of the mean values of each LV parameter between male and female cohorts was performed using a Student’s t-test, withP< 0.05 indicating significant differences between the two genders. The association of all LV parameters with age (for each gender) was evaluated, and a one-way analysis of variance (ANOVA) (with Tukey post-hoc analysis) was performed (four samples per gender) in order to identify statistical differences between the mean values of each of these variables with age. Regression analysis was also performed to investigate the various associations between each LV variable and age. From this, a “per decade” change in each variable was calculated, based on the assumption that the changes were linear with age. A formal assess-ment of intra- and interobserver repeatability has not been pre-sented since this is reported elsewhere.22 However, reasonable
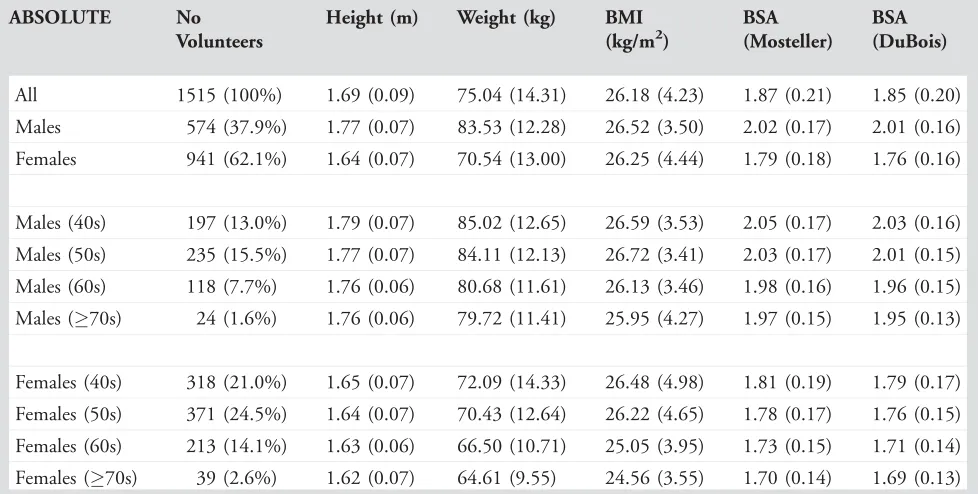
[image:3.612.62.551.92.339.2]estimates of interobserver variation can be extracted from the data generated by different segmentation observers because each of the respective cohorts were age-matched, gender-matched, and normal-ized to BSA. Comparison of 3T data versus 1.5T data was per-formed by tabulating the pooled data reported by Kawel-Boehm et al11against the data acquired in this study. Data were presented for both field strengths as a mean6SD for all LV variables, and stratified according to gender. Full data ranges for each LV variable were also recorded. Differences between the means of each variable TABLE 1. Demographic Information Related to Anatomical Size for All Volunteers in the Study
ABSOLUTE No
Volunteers
Height (m) Weight (kg) BMI (kg/m2)
BSA (Mosteller)
BSA (DuBois)
All 1515 (100%) 1.69 (0.09) 75.04 (14.31) 26.18 (4.23) 1.87 (0.21) 1.85 (0.20)
Males 574 (37.9%) 1.77 (0.07) 83.53 (12.28) 26.52 (3.50) 2.02 (0.17) 2.01 (0.16)
Females 941 (62.1%) 1.64 (0.07) 70.54 (13.00) 26.25 (4.44) 1.79 (0.18) 1.76 (0.16)
Males (40s) 197 (13.0%) 1.79 (0.07) 85.02 (12.65) 26.59 (3.53) 2.05 (0.17) 2.03 (0.16)
Males (50s) 235 (15.5%) 1.77 (0.07) 84.11 (12.13) 26.72 (3.41) 2.03 (0.17) 2.01 (0.15)
Males (60s) 118 (7.7%) 1.76 (0.06) 80.68 (11.61) 26.13 (3.46) 1.98 (0.16) 1.96 (0.15)
Males (70s) 24 (1.6%) 1.76 (0.06) 79.72 (11.41) 25.95 (4.27) 1.97 (0.15) 1.95 (0.13)
Females (40s) 318 (21.0%) 1.65 (0.07) 72.09 (14.33) 26.48 (4.98) 1.81 (0.19) 1.79 (0.17)
Females (50s) 371 (24.5%) 1.64 (0.07) 70.43 (12.64) 26.22 (4.65) 1.78 (0.17) 1.76 (0.15)
Females (60s) 213 (14.1%) 1.63 (0.06) 66.50 (10.71) 25.05 (3.95) 1.73 (0.15) 1.71 (0.14)
Females (70s) 39 (2.6%) 1.62 (0.07) 64.61 (9.55) 24.56 (3.55) 1.70 (0.14) 1.69 (0.13)
were calculated by simple subtraction in order to estimate whether the LV variable means varied randomly between 1.5T and 3.0T, or whether the means were systematically different. All statistical test-ing was performed ustest-ing SPSS (IBM, Armonk, NY).
Results
A total of 1515 volunteers were scanned successfully, and a description of demographic information related to anatomic
size is shown in Table 1. A further n5 13 volunteers were
also scanned (original study size n 5 1528) but were
excluded from the analysis as a result of either radiographic error or significant movement artifacts experienced during the MR scanning process.
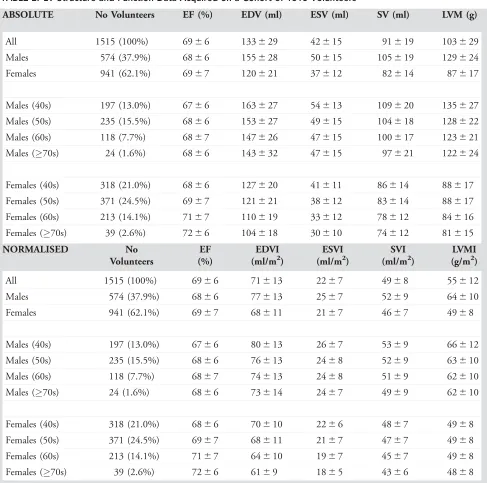
A summary of the results is shown in Table 2. When the normalized data from all female and male participants were examined together the mean EF was higher for females
(P < 0.05), but all other variables (EDV, ESV, SV, and
[image:4.612.64.551.82.565.2]LVM) were higher for males (allP<0.05).
TABLE 2. LV Structure and Function Data Acquired on a Cohort of 1515 Volunteers
ABSOLUTE No Volunteers EF (%) EDV (ml) ESV (ml) SV (ml) LVM (g)
All 1515 (100%) 6966 133629 42615 91619 103629
Males 574 (37.9%) 6866 155628 50615 105619 129624
Females 941 (62.1%) 6967 120621 37612 82614 87617
Males (40s) 197 (13.0%) 6766 163627 54613 109620 135627
Males (50s) 235 (15.5%) 6866 153627 49615 104618 128622
Males (60s) 118 (7.7%) 6867 147626 47615 100617 123621
Males (70s) 24 (1.6%) 6866 143632 47615 97621 122624
Females (40s) 318 (21.0%) 6866 127620 41611 86614 88617
Females (50s) 371 (24.5%) 6967 121621 38612 83614 88617
Females (60s) 213 (14.1%) 7167 110619 33612 78612 84616
Females (70s) 39 (2.6%) 7266 104618 30610 74612 81615
NORMALISED No
Volunteers
EF (%)
EDVI (ml/m2)
ESVI (ml/m2)
SVI (ml/m2)
LVMI (g/m2)
All 1515 (100%) 6966 71613 2267 4968 55612
Males 574 (37.9%) 6866 77613 2567 5269 64610
Females 941 (62.1%) 6967 68611 2167 4667 4968
Males (40s) 197 (13.0%) 6766 80613 2667 5369 66612
Males (50s) 235 (15.5%) 6866 76613 2468 5269 63610
Males (60s) 118 (7.7%) 6867 74613 2468 5169 62610
Males (70s) 24 (1.6%) 6866 73614 2467 4969 62610
Females (40s) 318 (21.0%) 6866 70610 2266 4867 4968
Females (50s) 371 (24.5%) 6967 68611 2167 4767 4968
Females (60s) 213 (14.1%) 7167 64610 1967 4567 4968
Females (70s) 39 (2.6%) 7266 6169 1865 4366 4868
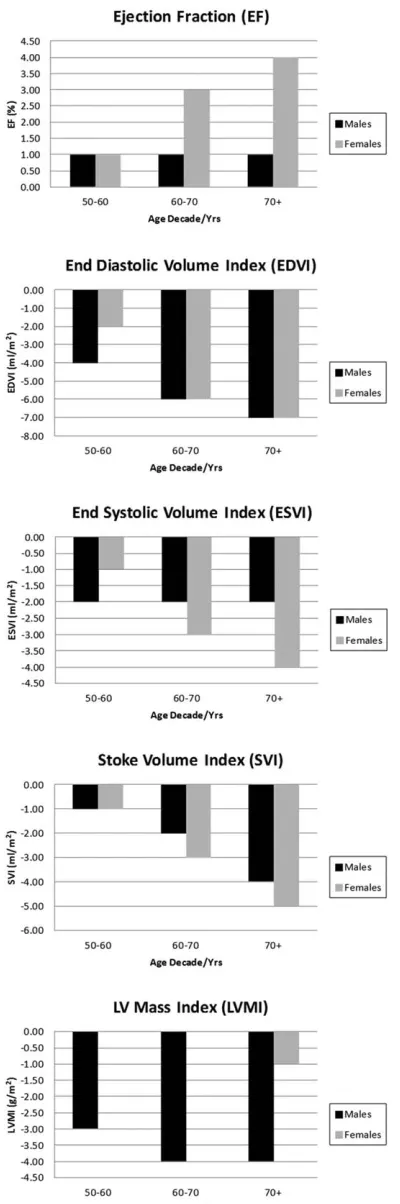
When the LV variables were subdivided into age
decade categories (40s, 50s, 60s, and 70s) a number of
age-related changes were evident. For males, the mean
EF rose slightly over the first decade studied (11%, P <
0.04) but then remained stable across the remaining age decades. However, the means of all other variables were
reduced with age (Fig. 1) (40s vs. 70s; EDVI and SVI
P<0.05).
For females, the mean EF rose marginally with age (a
4.0% increase was noted in the 70 years cohort relative to
the 40–49 years cohort) but the means of all other
volumet-ric variables were noted to decrease with age (40s vs. 70s;
EDVI, ESVI, SVIP<0.05). The most stable of all the
var-iables was found to be the mean LVMI, which was only
reduced by 1 g/m2 in the 70 years cohort relative to the
40s cohort. This pattern appeared different from that observed in the male cohort, which demonstrated a more defined reduction in mean LVMI with age.
The results of regression analysis describing the linear change of each LV variable per decade of age are highlighted in Table 3. All variables except for EF were noted to decrease with age, and the EDVI showed the biggest “per
decade” reduction (–2.9 6 1.3 ml/m2 for males and –3.1
6 0.8 ml/m2 for females). The biggest difference between
the male and female population was noted for LVMI, where greater “per decade” losses were measured in the male
cohort (–1.6 6 1.1 g/m2) relative to the female cohort,
which remained virtually stable (–0.260.6 g/m2).
A total ofn5 782 volunteers satisfied the more stringent
low-risk factor inclusion criteria for the subset cohort, and the resulting data are presented in Appendices 1 (demographics) and 2 (MR parameters). There were no statistically significant differences between the means of any of the normalized LV var-iables when the data from the full cohort and the subset cohort
were compared (P > 0.05 for all LV variables, including all
comparisons when subdivided by gender and age).
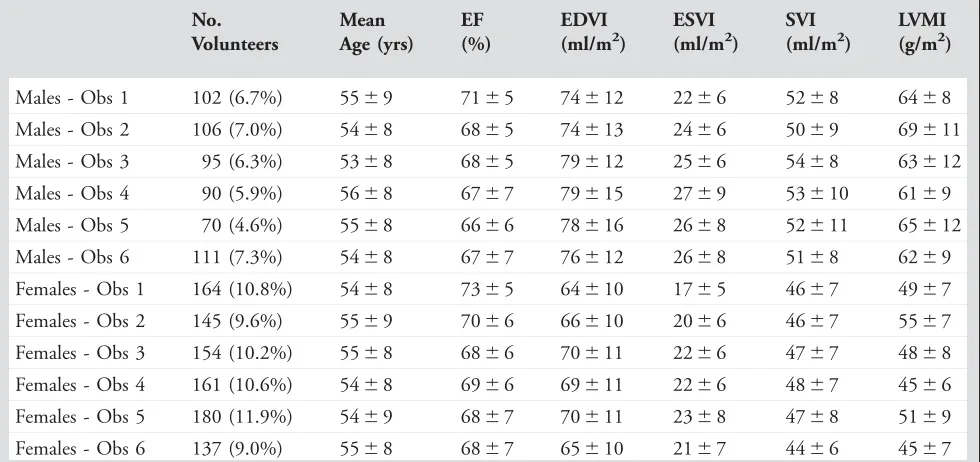
The variation in normalized mean LV measurements between the different segmentation observers is detailed in Table 4, and illustrated graphically in Fig. 2 for LVM (the most variable measurement). Although the group of volun-teers segmented by each observer was different in each case, the data were stratified by age and gender, and normalized to BSA in order to make comparisons closely related to the segmentation technique itself. The consistency of the data
between observers for mean EF data ranged from 66 6 6%
(observer 5) to 71 6 5% (observer 1) for males, and from
6867% (observer 4) to 736 5% (observer 1) for females.
These were similar to the mean EF for the full cohort
(Table 2) of 69 6 6%. For the LV mass index, the
consis-tency of the data ranged from 616 9 g/m2(observer 4), to
69 6 11 g/m2(observer 2) for males, and from 45 6 6 g/
[image:5.612.82.282.70.672.2]m2 (observer 4) to 55 6 7 g/m2 (observer 2) for females.
These also compare favorably to the mean LV mass index
for the entire cohort (Table 2) of 556 12 g/m2.
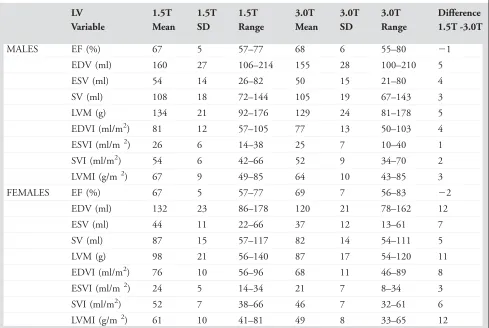
Finally, a comparison of the 3.0T data with 1.5T data from elsewhere is presented in table 5. The mean EF was found to be marginally greater at 3.0T relative to 1.5T, but for all other variables the means were a little lower at 3.0T.
Discussion
In this study we present data describing MR LV structure and function in a large cohort of volunteers. The study
methodology is similar to others performed previously.1–3
This work was prepared in response to the specific need for 3.0T MR data of this type as recently reported by Kawel-TABLE 3. Results of Linear Regression Analysis Performed on the Male and Female Cohorts in Order to Derive “Per Decade” Change for Each of the Measured Indexed LV Variables
Correlation Coefficient r (95% CI)
Slope (95% CI)
y-intercept Per Decade Change (95% CI)
Male Age (x-variable)
EF (%) 0.08 0.06 64.66 0.6 (60.6)
EDVI (ml/m2) 20.18 20.29 92.67 22.9 (61.3)
ESVI (ml/m2) 20.14 20.13 31.81 21.3 (60.7)
SVI (ml/m2) 20.15 20.17 60.86 21.7 (60.9)
LVMI (g/m2) 20.13 20.16 72.69 21.6 (61.1)
Female Age (x-variable)
EF (%) 0.15 0.12 62.87 1.2 (60.5)
EDVI (ml/m2) 20.25 20.31 84.45 23.1 (60.8)
ESVI (ml/m2) 20.22 20.17 30.18 21.7 (60.5)
SVI (ml/m2) 20.17 20.14 54.27 21.4 (60.6)
[image:6.612.67.552.102.352.2]LVMI (g/m2) 20.02 20.02 49.91 20.2 (60.6)
TABLE 4. LV Structure and Function Data (Mean6SD) as Derived by Each of the Six Segmentation Observers
No. Volunteers
Mean Age (yrs)
EF (%)
EDVI (ml/m2)
ESVI (ml/m2)
SVI (ml/m2)
LVMI (g/m2)
Males - Obs 1 102 (6.7%) 5569 7165 74612 2266 5268 6468
Males - Obs 2 106 (7.0%) 5468 6865 74613 2466 5069 69611
Males - Obs 3 95 (6.3%) 5368 6865 79612 2566 5468 63612
Males - Obs 4 90 (5.9%) 5668 6767 79615 2769 53610 6169
Males - Obs 5 70 (4.6%) 5568 6666 78616 2668 52611 65612
Males - Obs 6 111 (7.3%) 5468 6767 76612 2668 5168 6269
Females - Obs 1 164 (10.8%) 5468 7365 64610 1765 4667 4967
Females - Obs 2 145 (9.6%) 5569 7066 66610 2066 4667 5567
Females - Obs 3 154 (10.2%) 5568 6866 70611 2266 4767 4868
Females - Obs 4 161 (10.6%) 5468 6966 69611 2266 4867 4566
Females - Obs 5 180 (11.9%) 5469 6867 70611 2368 4768 5169
Females - Obs 6 137 (9.0%) 5568 6867 65610 2167 4466 4567
[image:6.612.62.552.495.726.2]Boehm et al.11 Statistical limitations associated with small study cohorts have been addressed by extending this work to include a large asymptomatic population, with full
cover-age across the adult cover-age range to account for remodeling processes associated with the heart that occur with age.
In this study the means and ranges obtained for LV structure and function parameters at 3.0T are generally similar to those reported at 1.5T. The mean EF was marginally greater at 3.0T relative to 1.5T, but for all other variables the means were a little lower at 3.0T. The reason for these differ-ences is not clear but may be related to variations in edge
boundary perception due to changes in theT1(andT2)
relax-ation times of the blood pool, myocardium, and other sur-rounding tissue structures. There may also be small differences in our study cohort demographics in relation to those reported from elsewhere. The greatest differences were noted for female volunteers, where the mean EDV and LVM parameters were 12 ml and 11 g lower, respectively, at 3.0T when compared to the previous pooled 1.5T data reported by
Kawel-Boehm et al.11If the individual articles that contribute
to this published range are scrutinized more closely, the best agreement to our 3.0T mean EDV (120 ml) is found in the
work by Maciera et al,3who obtained a mean EDV of 126 ml
for their cohort of female volunteers in the 50–59 years age decade at 1.5T. Similarly, the closest agreement to our mean
[image:7.612.63.300.70.207.2]LVM (87 g) is reported in the work by Alfakih et al,1who
TABLE 5. Comparison of Data Acquired at 1.5T (Taken From Ref. 11) With That Acquired in This Study
LV 1.5T 1.5T 1.5T 3.0T 3.0T 3.0T Difference
Variable Mean SD Range Mean SD Range 1.5T -3.0T
MALES EF (%) 67 5 57–77 68 6 55–80 21
EDV (ml) 160 27 106–214 155 28 100–210 5
ESV (ml) 54 14 26–82 50 15 21–80 4
SV (ml) 108 18 72–144 105 19 67–143 3
LVM (g) 134 21 92–176 129 24 81–178 5
EDVI (ml/m2) 81 12 57–105 77 13 50–103 4
ESVI (ml/m 2) 26 6 14–38 25 7 10–40 1
SVI (ml/m2) 54 6 42–66 52 9 34–70 2
LVMI (g/m 2) 67 9 49–85 64 10 43–85 3
FEMALES EF (%) 67 5 57–77 69 7 56–83 22
EDV (ml) 132 23 86–178 120 21 78–162 12
ESV (ml) 44 11 22–66 37 12 13–61 7
SV (ml) 87 15 57–117 82 14 54–111 5
LVM (g) 98 21 56–140 87 17 54–120 11
EDVI (ml/m2) 76 10 56–96 68 11 46–89 8
ESVI (ml/m 2) 24 5 14–34 21 7 8–34 3
SVI (ml/m2) 52 7 38–66 46 7 32–61 6
LVMI (g/m 2) 61 10 41–81 49 8 33–65 12
[image:7.612.63.552.399.727.2]Data are presented as the mean, SD, and range (defined as62 SD of the mean). With the exception of EF, the calculated figures at 3.0T were all lower than those previously published at 1.5T and the difference was clearer in the female volunteer cohort.
FIGURE 2: Variation in mean left ventricular mass index (LVMI;
obtained a mean LVM of 88.1 g for their cohort of female volunteers in the 40–65 years age range at 1.5T. In other words, although some discrepancy exists between the pooled 1.5T data, there are individual contributions that agree quite closely with our findings at 3.0T.
When our 3.0T data were subdivided into male and female groups, the mean data for females were significantly lower than the means for males in all parameters studied, except for EF. This is expected and consistent with findings
reported elsewhere.2 Alternative subdivision of the data into
age decades (40s, 50s, 60s, and70s) revealed that mean EF
was virtually stable with age in males but rose a little with increasing age in females. Conversely, the mean LVMI was virtually stable with age in females but reduced with age in males. The other mean variables (EDVI, ESVI, and SVI) were found to reduce with age by varying amounts. These patterns of change over time are most similar to those
reported by Hudsmith et al2 at 1.5T, where they compared
cohorts of volunteers in groups with age stratification <35
years and>35 years. Similar patterns of change over time are
also presented by Alfakih et al1and Macieira et al3at 1.5T.
The normalization of cardiac structure and function data is a complex area, and many approaches have been
reported. Normalization to height,25 fat-free mass (FFM),26
and weight27 have been proposed, but the method most
commonly employed is normalization to BSA.28 The
Mos-teller index to BSA was chosen for this work since it is rela-tively simple, widely used, and validated on a wide range of subject sizes. Other normalization methods such as that
pro-posed by DuBois and DuBois29 are also available, but this
latter study was only validated on very small cohorts and is considered to be less meaningful at the lower and upper ranges of height and weight combinations.
In order to maintain optimal consistency, the study was conducted over a 5-year period using the same scanner and the same RF coil combinations. No significant down-time was experienced over the duration of the work and the only minor change to the system over this period was an upgrade from software version VB15 to VB17, which did not noticeably affect the functionality of the MR protocols and analysis packages used. To this end, the experimental equipment was considered to remain stable for the duration of the experiment.
The data were acquired over such a large cohort that we elected to use multiple observers for the segmentation analy-sis. Each observer (six in total) was responsible for segmenting
approximatelyn5250 datasets. These data were stratified by
gender and normalized to BSA (using the Mosteller formula) in order to account for body habitus variations between each of the cohorts allocated to each of the segmentation observers. This approach enables the variations in each LV parameter to be attributable to the segmentation technique, and not be influenced by the physical size or gender distribution of the
cohort populations. The mean age of the cohorts allocated to each segmentation observer is also closely matched, which has ensured further consistency, ie, the segmentation technique itself is the dominant factor that forms the variation between observers. Although the segmentation technique was agreed beforehand and all observers were experienced, some real-world differences between observers were apparent. The mean EF was slightly larger (and the ESVI slightly lower) for volun-teers segmented by observer 1, suggesting that the observer was heavily excluding papillary muscles at end-systole from the ESV blood pool volume. Similarly, the range of values for mean LVMI was variable in places, with observer 4 tending to generate slightly smaller mean values. While some of this vari-ation may be due to the fact that different volunteers were included in each cohort (an accepted limitation of the study design), the likelihood is that it is mostly down to subtle var-iations in the segmentation technique between the observers (similar variability figures are reported in studies by Chuang
et al30 and Suinesiaputra et al31). It was, however, most
encouraging to note that the generated data were generally very similar between all of the observers.
The use of a 3.0T scanner for this work was proposed on the basis that the theoretical improvement to the signal-to-noise ratio might be traded for faster scanning (ie, more LV SA slices per breath-hold) and therefore faster volunteer throughput. However, in reality much of the “time saved” (relative to 1.5T) was required for the process of image opti-mization, eg, the use of optimized volunteer-specific shim-ming techniques (eg, “frequency scout”) and targeted shim regions placed over the area of interest during the examination in order to eradicate resonant-offset banding and flow-related artifacts. Although relatively little “time-saving” was achieved, the comparison with existing 1.5T data should help to pro-vide support data for future population-based research studies that may utilize scanners at both field strengths.
Limitations of the study include the fact that the soft-ware used was not easily able to account for papillary mus-cle volumes, leading to possible small variation between observers as to how the papillary structures would in prac-tice be treated. A further limitation of the study is that no direct equivalent 1.5T data were available and no spoiled gradient echo data were acquired for comparative purposes. The size of the study was such that this was considered pro-hibitive in terms of time, but similar comparisons are
avail-able in the existing literature for 1.5T data12 and it is likely
risk of this significantly confounding the results of this study is minimal: we have knowingly excluded anybody with clinically apparent CVD in this work, and in
addition to which there were no statistical differences detected within any of the cardiac MR parameters when
only those with a BNP <2 SD above the gender-specific
APPENDIX 1. Demographic information related to anatomical size for a subset of volunteers (n5782) with lower risk factors for CVD, based on 1) BP<140/90 mmHg, 2) nonsmokers, and 3) BNP<2 SD above the original cohort gender-specific mean.
ABSOLUTE No
Volunteers
Height (m)
Weight (kg)
BMI (kg/m2)
BSA (Mosteller)
BSA (DuBois)
All 782 1.68 (0.10) 74.99 (14.30) 26.09 (4.23) 1.87 (0.21) 1.85 (0.20)
Males 299 1.78 (0.07) 83.78 (11.26) 26.47 (3.21) 2.03 (0.16) 2.02 (0.15)
Females 483 1.64 (0.07) 69.30 (13.13) 25.85 (4.74) 1.77 (0.18) 1.75 (0.16)
Males (40s) 118 1.79 (0.07) 85.37 (11.24) 26.60 (3.35) 2.06 (0.15) 2.04 (0.15)
Males (50s) 135 1.77 (0.07) 83.64 (11.51) 26.64 (3.09) 2.02 (0.16) 2.01 (0.16)
Males (60s) 38 1.77 (0.07) 79.45 (10.09) 25.38 (3.12) 1.97 (0.14) 1.96 (0.13)
Males (70s) 8 1.76 (0.04) 83.08 (8.20) 26.89 (3.01) 2.01 (0.10) 1.99 (0.09)
Females (40s) 176 1.65 (0.06) 70.68 (13.78) 26.14 (4.84) 1.79 (0.19) 1.77 (0.17)
Females (50s) 185 1.64 (0.07) 70.36 (13.74) 26.24 (5.09) 1.78 (0.18) 1.76 (0.16)
Females (60s) 107 1.63 (0.07) 65.90 (10.53) 24.89 (3.90) 1.72 (0.15) 1.71 (0.14)
Females (70s) 15 1.62 (0.07) 64.43 (9.75) 24.70 (3.89) 1.70 (0.15) 1.68 (0.14)
APPENDIX 2. LV structure and function data acquired in then5782 subset of volunteers. When compared with the equivalent normalized data acquired from the whole cohort (Table 2), there were no significant differences between the means of any variable (P>0.05 for all data, including subcomparisons stratified by age and gender).
ABSOLUTE No Volunteers EF (%) EDV (ml) ESV (ml) SV (ml) LVM (g)
All 782 696 6 1346 29 436 14 92619 1026 28
Males 299 676 6 1586 25 526 14 1066 18 1286 22
Females 483 706 6 1196 20 376 11 83614 86616
Males (40s) 118 666 6 1656 26 566 13 1096 20 1336 24
Males (50s) 135 686 6 1546 24 496 14 1046 17 1266 20
Males (60s) 38 686 7 1536 24 506 17 1036 14 1236 19
Males (70s) 8 676 4 1546 12 516 10 1026 7 1216 13
Females (40s) 176 686 5 1256 20 406 11 85613 86615
Females (50s) 185 706 6 1216 20 376 10 84614 87617
Females (60s) 107 716 6 1096 15 316 9 78612 84614
mean (and therefore associated with normal limits) were included in the analysis.
In conclusion, we describe LV reference ranges in a population-based MR study of volunteers asymptomatic of CVD at 3.0T. The resulting figures are similar to those nor-mal ranges previously reported at 1.5T, and changes with age and gender also follow similar patterns. Data acquired from the full cohort are very similar to those derived from a subgroup with lower risk factors for CVD, suggesting that CVD risk at these levels does not contribute a significant effect. These baseline data might also enable future monitor-ing of LV changes over time as/when individuals within the cohort require future MR examinations.
Acknowledgments
Contract grant sponsor: Souter Charitable Trust, and Chest, Heart and Stroke Scotland; Contract grant sponsor: Well-come Trust; contract grant number: WT 085664 (Clinical Research Fellowship to J.W-McC.)
The authors gratefully acknowledge all members of the TASCFORCE consortium, including Anita Hutcheon and Janice Rowland (trial nurses); Daniel Levin and Simon Ogston (statistical analysis) and Prof Colin Palmer (genetics lead). Finally, the authors thank all NHS Tayside Radio-graphic staff for their assistance with the scanning, and every volunteer who gave their time to participate in the study.
Conflict of Interest
The authors declare that they have no competing interests.
References
1. Alfakih K, Plein S, Thiele H, Jones T, Ridgway JP, Sivananthan MU. Normal human left and right ventricular dimensions for MRI as assessed by turbo gradient echo and steady-state free precession imaging sequences. J Magn Reson Imaging JMRI 2003;17:323–329.
2. Hudsmith LE, Petersen SE, Francis JM, Robson MD, Neubauer S. Nor-mal human left and right ventricular and left atrial dimensions using steady state free precession magnetic resonance imaging. J Cardiovasc Magn Reson 2005;7:775–782.
3. Maciera AM, Prasad SK, Khan M, Pennell DJ. Normalized Left ventric-ular systolic and diastolic function by steady state free precession car-diovascular magnetic resonance. J Cardiovasc Magn Reson 2006;8: 417–426.
4. Yeon SB, Salton CJ, Gona P, et al. Impact of age, sex, and indexation method on MR left ventricular reference values in the Framingham Heart Study offspring cohort. J Magn Reson Imaging 2015;41:1038– 1045.
5. Chung AK, Das SR, Leonard D, et al. Women have higher left ventric-ular ejection fractions than men independent of differences in left ven-tricular volume: the Dallas Heart Study. Circulation 2006;113:1597– 1604.
6. Natori S, Lai S, Finn JP, et al. Cardiovascular function in multi-ethnic study of atherosclerosis: normal values by age, sex, and ethnicity. Am J Roentgenol 2006;186:S357–S365.
7. Schelbert EB, Cao JJ, Sigurdsson S, et al. Prevalence and prognosis of unrecognized myocardial infarction determined by cardiac mag-netic resonance in older adults. JAMA 2012;308:890–897.
8. Hegenscheid K, Seipel R, Schmidt CO, et al. Potentially relevant inci-dental findings on research whole-body MRI in the general adult pop-ulation: frequencies and management. Eur Radiol 2013;23:816–826.
9. Payne R, Eleftheriou KI, James LE, et al. Left ventricular growth response to exercise and cigarette smoking: data from LARGE Heart. Heart 2006;92:1784–1788.
10. Petersen SE, Matthews PM, Bamberg F, et al. Imaging in population science: cardiovascular magnetic resonance in 100,000 participants of UK Biobank — rationale, challenges and approaches. J Cardiovasc Magn Reson 2013;15:46.
11. Kawel-Boehm N, Maceira A, Valsangiacomo-Buechel ER, et al. Normal values for cardiovascular magnetic resonance in adults and children. J Cardiovasc Magn Reson 2015;17:29.
NORMALISED No Volunteers EF (%) EDVI (ml/m2) ESVI (ml/m2) SVI (ml/m2) LVMI (g/m2)
All 782 6966 72612 236 7 496 8 54611
Males 299 6766 78612 266 7 526 8 63610
Females 483 7066 68610 216 6 476 7 4968
Males (40s) 118 6666 80612 276 7 536 9 65611
Males (50s) 135 686 6 76612 256 7 526 8 6369
Males (60s) 38 686 7 78612 266 9 526 7 62610
Males (70s) 8 676 4 7666 266 5 516 3 6067
Females (40s) 176 686 5 70610 236 6 486 7 4867
Females (50s) 185 706 6 68611 216 6 476 8 4968
Females (60s) 107 7166 6368 186 5 456 7 4967
Females (70s) 15 7365 62610 176 5 456 7 4868
12. Hudsmith LE, Petersen SE, Tyler DJ, et al. Determination of cardiac volumes and mass with FLASH and SSFP cine sequences at 1.5 vs. 3 Tesla: a validation study. J Magn Reson Imaging 2006;24:312–318.
13. Chaustre-Mendoza LF, Marti-Bonmati L, Roldan I, Calvillo P, Sanz-Requena R, Moratal D. Resonancia magnetica del ventryculo izquierdo en sujetos sanos: valores normales de morfologya, funcion, perfusion y viabilidad. Radiologia 2009;51:273–281.
14. Liu CY, Bluemke DA, Gerstenblith G, et al. Reference values of myocardial structure, function, and tissue composition by cardiac magnetic resonance in healthy African-Americans at 3T and their relations to serologic and car-diovascular risk factors. Am J Cardiol 2014;114:789–795.
15. Drazner MH, Dries DL, Peshock RM, et al. Left ventricular hypertrophy is more prevalent in blacks than whites in the general population: the Dallas Heart Study. Hypertension 2005;46:124–129.
16. Michaely HJ, Nael K, Schoenberg SO, et al. Analysis of cardiac func-tion — comparison between 1.5 Tesla and 3.0 Tesla cardiac cine magnetic resonance imaging: preliminary experience. Invest Radiol 2006;41:133–140.
17. Tyler DJ, Hudsmith LE, Petersen SE, et al. Cardiac cine MR-imaging at 3T: FLASH vs SSFP. J Cardiovasc Magn Reson 2006;8:709–715.
18. Stanisz GJ, Odrobina EE, Pun J, et al. T1, T2 relaxation and magnet-ization transfer in tissue at 3T. Magn Reson Med 2005;54:507–512.
19. Schar M, Kozerke S, Fischer SE, Boesiger P. Cardiac SSFP imaging at 3 Tesla. Magn Reson Med 2004;51:799–806.
20. Bluemke DA, Kronmal RA, Lima JAC, et al. The relationship of left ventricular mass and geometry to incident cardiovascular events. The MESA (Multi-Ethnic Study of Atherosclerosis) study. J Am Coll Cardiol 2008;52:2148–2155.
21. Cleeman JL, National Cholesterol Education Programme (NCEP) Expert Panel. Executive summary of the third report of the National Cholesterol Education Programme (NCEP) expert panel on detection, evaluation, and treatment of high blood cholesterol in adults (Adult Treatment Panel III). JAMA 2001;285:2486–2497.
22. Gandy SJ, Lambert M, Belch JJF, et al. Technical assessment of whole body angiography and cardiac function within a single MRI examina-tion. Clin Radiol 2015;70:595–603.
23. Schulz-Menger J, Bluemke DA, Bremerich J, et al. Standardized image interpretation and post processing in cardiovascular magnetic resonance: Society for Cardiovascular Magnetic Resonance (SCMR) board of trustees task force on standardized post-processing. J Cardiovasc Magn Reson 2013;15:35–54.
24. Mosteller RD. Simplified calculation of body-surface area. N Engl J Med 1987;317:1098.
25. de Simone G, Daniels SR, Devereux RB, et al. Left ventricular mass and body size in normotensive children and adults: assessment of allometric relations and impact of overweight. J Am Coll Cardiol 1992;20:1251–1260.
26. Kuch B, Hense H-W, Gneiting B, et al. Body composition and preva-lence of left ventricular hypertrophy. Circulation 2000;102:405–410.
27. Marcus JT, DeWaal LK, Gotte MJW, van der Geest RJ, Heethaar RM, Van Rossum AC. MRI-derived left ventricular function parameters and mass in healthy young adults: relation with gender and body size. Int J Cardiac Imaging 1999;15:411–419.
28. Cain PA, Ahl R, Hedstrom E, et al. Age and gender specific normal values of left ventricular mass, volume and function for gradient echo magnetic resonance imaging: a cross sectional study. BMC Med Imaging 2009;9:2.
29. DuBois D, DuBois EF. A formula to estimate the approximate surface area if height and weight be known. Arch Intern Med 1916;17:863–871.
30. Chuang ML, Gona P, Hautvast GLTF, et al. Correlation of trabeculae and papillary muscles with clinical and cardiac characteristics and impact on CMR measures of LV anatomy and function. J Am Coll Car-diol Imaging 2012;5:1115–1123.