Title: Polygenic risk score in post-mortem diagnosed sporadic early onset Alzheimer’s disease Authors: Sultan Chaudhury1, Tulsi Patel1, Imelda S. Barber1, Tamar Guetta-Baranes1, Keeley J. Brookes1, Sally Chappell1, James Turton1, Rita Guerreiro2,3,4, Jose Bras2,3,4, Dena Hernandez5, Andrew Singleton5, John Hardy2,4, David Mann6, ARUK Consortium and Kevin Morgan1.
1. Human Genetics Group, University of Nottingham, Nottingham, UK.
2. Department of Molecular Neuroscience, Institute of Neurology, University College London, London, UK.
3. Department of Medical Sciences, Institute of Biomedicine-iBiMED, University of Aveiro, Aveiro, Portugal
4. UK Dementia Research Institute at UCL (UK DRI), London, UK.
5. Laboratory of Neurogenetics, National Institute of Aging, National Institute of Health, Bethesda, MD, USA.
Abstract
1.0 Introduction
Alzheimer’s disease (AD) is the most common form of dementia, characterised by the deterioration of memory, language, visuospatial skills, and behaviour (Budson and Kowall, 2011). Dementia currently affects an estimated 46.8m people globally (Prince et al., 2015). Hallmarks of AD were originally identified post-mortem from histopathological signs of neuritic plaques, composed of amyloid-β, and neurofibrillary tangle formation; post-mortem examination of brain tissue for these hallmarks remains the most definitive diagnosis of AD. Clinical diagnosis is accurately verified in more than 85% of cases (Naj and Schellenberg, 2016).
AD can be categorised based on age of onset, where presentation of symptoms in individuals before the age of 65 are classified as early-onset Alzheimer’s disease (EOAD), whilst late onset (LOAD) classifies individuals with onset over 65 (Barber et al., 2017; Wingo et al., 2012). LOAD has a heritability estimated to be around 70%, lower than estimates of heritability for EOAD, which vary between 80-100% (Barber et al., 2017; Wingo et al., 2012). An estimated 10% of EOAD cases have a familial aspect and are subsequently classified as early-onset familial AD (EOFAD). Autosomal dominant variants in the genes Amyloid precursor protein (APP), Presenilin 1 (PSEN1) and Presenilin 2 (PSEN2) have been discovered to increase amyloid-β production, increasing risk of EOFAD (Liu, C.
et al., 2013; Wingo et al., 2012). The remainder of early-onset cases, classed as sporadic (sEOAD),
are thought to be predominantly polygenic. The accumulation of variants which independently increase risk of LOAD may lead to sEOAD at an earlier stage of life (Barber et al., 2017; Wingo et al., 2012).
The association of the APOE gene has been the most consistent observation in AD genetics with the presence of an APOE ε4 allele significantly more common amongst individuals diagnosed with AD, whilst the ε2 allele is considered protective (Liu, C. et al., 2013; Naj and Schellenberg, 2016).Through genome wide association studies (GWAS), around 20 genetic loci had been discovered, which affect risk of LOAD (Lambert et al., 2013). Follow-up studies based on the GWAS have identified other potential candidate genes AD risk genes not previously identified, including the TRIP4, SPPL2A genes (Ruiz et al., 2014), and ABI3 gene (Sims et al., 2017). Next-generation sequencing (NGS) has also enabled the identification of rare variants, one of the most consistent being the R47H variant in the
TREM2 gene locus (Guerreiro et al., 2013; Jonsson et al., 2013) which affect risk of AD previously not
identified in GWAS (Giri et al., 2016; Lambert et al., 2013; Naj and Schellenberg, 2016). Although most studies utilise Caucasian populations, further risk variants have been identified through NGS in African American individuals within the gene AKAP9 (Giri et al., 2016; Logue et al., 2014). Conversely protective variants have also been identified including a small coding deletion (rs10553596) within the CASP7 gene associated with reduced incidence of AD amongst individuals with the APOE ε4ε4 genotype in four independent imputed datasets (Ayers et al., 2016). Further protective rare variants have also been identified by imputation of previous datasets such as the PLCG2 gene (Sims et al., 2017).
Following on from these studies Marden and colleagues (Marden et al. 2014, Marden et al. 2016) sought to determine if a summative analysis of GWAS variants would be able to predict a dementia probability score. An AD genetic risk score (AD-GRS) was calculated by multiplying each individual GWAS allele effect size using the beta coefficients obtained from a previous dataset. This type of analysis demonstrated that AD-GRS could predict LOAD phenotype (Verhaaren et al. 2013, Sleegers
et al. 2015, Xiao et al. 2015, Yokoyama et al. 2015, Chouraki et al. 2016, Desikan et al. 2017), MCI
This approach has been expanded to include further polymorphisms of smaller but important effect sizes to develop a polygenic risk score (PRS) (Euesden et al. 2015). This is an improvement on previous tests as they do not perform well when non-associated SNPs are included (Chapman and Whittaker 2008, Basu et al. 2011) and is considered to find SNPs of disease relevance that have too small an effect size to be identified conventionally (Pan et al. 2015) .
In a recent study, polygenic scores were calculated for a cohort of LOAD cases and controls: the study used genotype information of the cohort to identify common variants that affect the risk of developing AD and used polygenic scores to form a risk prediction model (Escott-Price et al., 2015). By producing a model which identifies individuals with a high polygenic risk score, the potential for early screening, diagnosis and determination of disease severity becomes possible (Eusden, et al., 2015).
In this study we have used genotype information generated on the NeuroX chip to generate a PRS in sEOAD. The NeuroX is a customised genotyping array built on the foundation of the Infinium
HumanExome BeadChip v1.1, with additional custom content. The array is designed to collect genotype information at markers across the entire genome. The HumanExome BeadChip foundation is made up of 242,901 markers, identifying variants in a series of metabolic, cancerous, diabetic, and psychiatric disorders (Barber et al., 2017; Nalls et al., 2015). The custom content includes 24,706 markers from candidate loci associated with neurological diseases such as AD, Frontotemporal Dementia, Parkinson’s Disease, Multiple System Atrophy, Amyotrophic Lateral Sclerosis, Myasthenia Gravis, Charcot Marie Tooth, and Progressive Supranuclear Palsy (Nalls et al., 2015).
To calculate a PRS we have used the software package, PRSice, which utilises genotype information from individuals in a target dataset based on the effect scores of single nucleotide polymorphisms (SNPs) from a second dataset, termed the base dataset. The program uses R to define parameters and PLINK for the computational analysis (Purcell et al., 2007; R Core Team, 2013). PRSice is a command line program that allows specific parameters to be considered when generating PRS. The output files of the analysis include a list of individuals’ scores at the best-fit threshold for predicting disease risk and a list of each tested threshold with its corresponding Nagelkerke’s R2 value,
quantifying the level of predictability using that threshold (Eusden et al., 2015).
Linkage disequilibrium (LD) is a common problem when SNPs are scored based on their weighted effect and frequency when comparing cases and controls of a disease. The alleles of two SNPs present on the same chromosome can be commonly inherited together, and the recurrence of particular alleles at loci are an indicator of the degree of LD between SNPs (Bush and Moore, 2012). Given two SNPs in tight LD, both could be perceived as contributing to the disease risk in a functional haplotype, however it may be that only one polymorphism is responsible for the phenotypic effect.
2.0 Methods 2.1 Samples
The cohort genotyped consisted of 451 sEOAD cases (48.6% female) and 528 controls (51.3% female). sEOAD cases were screened for known disease causing variants within exons 16 and 17 of
APP as well as variants in genes PSEN1 and PSEN2 to minimise inclusion of EOFAD cases. The
diseased individuals had a documented or predicted age of onset of ≤65 years. Diagnosis of definite or probable sEOAD had met guidelines set by the National Institute of Neurological and
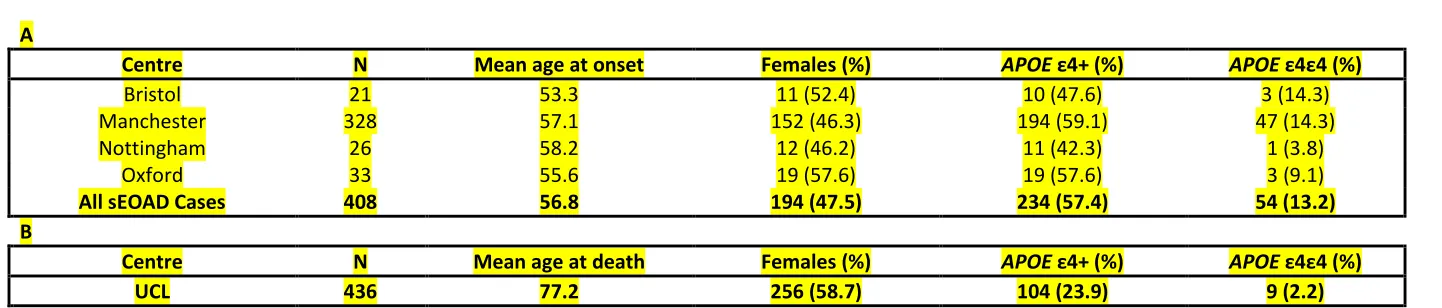
Communicative Disorders and Stroke (NINCDS), the Alzheimer’s disease and Related Disorders Association (ADRDA) and the Consortium to Establish a Registry for Alzheimer’s disease (CERAD). APOE ε status was determined for all individuals. At least one APOE ε4 allele was present in 57.6% of cases, with 22.3% of which being homozygotes (n=58); 22.7% of controls harboured at least one ε4 allele, seven control samples were ε4 homozygotes. These samples are described in greater detail in the paper by Barber et al. (2017). Full details of the samples used in this study are outlined in Table 1. Experimental procedures were completed with informed consent, with approval from local ethics committee (Nottingham Research Ethics Committee 2 (REC reference 04/Q2404/130) and
completed in accordance with approved guidelines. A standard phenol chloroform DNA extraction method was used on 2mls of blood or 100mgs of brain tissue. DNA quality was assessed using gel electrophoresis and quantity was determined by NanoDrop 3300 spectrometry (Barber et al., 2017).
2.2 NeuroX array
Clustering and the first stage of Quality Control (QC) was completed in Illumina GenomeStudio 2011.1. GenomeStudio took raw fluorescent signal results and formed clusters of the individual genotypes for each SNP. A cluster file, provided by the Cohorts for Heart and Aging Research in Genomic Epidemiology (CHARGE), was used to assist in forming the cluster boundaries for most SNPs present on the chip and the remaining SNPs are allocated automatically by the program (Barber et al., 2017).
The SNPs were assessed on how well clusters formed in GenomeStudio: clusters are expected to localise at single points with high intensity, to form in certain locations based on the allele present and whether the genotype is heterozygous, not form too close to one another, and to not be too wide or elliptical. SNPs were grouped into each non-autosomal chromosome whilst all autosomal SNPs were assessed together. Clustering of SNPs in genes of interest such as APOE were also assessed (Barber et al., 2017).
Once QC was completed for clustering, the resulting dataset underwent final QC, SNPs and
contained genotype information for 265,049 SNPs of 408 cases (48.0% female) and 436 controls (58.6% female) (Barber et al., 2017).
2.3 Polygenic Risk Scoring
PRS calculated using PRSice required SNP information (SNP coordinate, affected allele, reference allele, P-value, and effect size as either odds ratio or θ) from an independent cohort, to act as a base dataset (Eusden et al., 2015). The base dataset was collated by the International Genomics of Alzheimer’s Project (IGAP) consortium, with association data for 7,055,881 SNPs from 17,008 LOAD cases and 37,154 controls. The data was accumulated as a meta-analysis of genome wide association studies performed by Genetic and Environmental Risk for Alzheimer’s Disease (GERAD), European Alzheimer’s Disease Initiative (EADI), Cohorts for Heart and Ageing Research in Genomic
Epidemiology (CHARGE), and Alzheimer’s Disease Genetics Consortium (ADGC) (Lambert et al., 2013). There is no equivalent data to this available for sEOAD due to the lower frequency of the disease and its diagnosis, however the shared phenotype between the two forms of AD may be caused by variants which affect risk of developing AD common to both LOAD and sEOAD.
PRSice initially identified all SNPs common between the base and target dataset; PRS were calculated by ordering all SNPs in the base dataset by association tested P-value; SNPs present within the P-value threshold defined by the user were used to provide an accumulative risk score for individuals in the target dataset, based on the alleles present at each SNP. The PRS calculated were compared between sEOAD cases and controls and the ability to successfully identify cases and controls was determined by Nagelkerke’s R2 value: the threshold which contains SNPs that produce the greatest Nagelkerke’s R2 value is the best-fit threshold for analysis.
PRSice was set to calculate polygenic risk scores for all individuals in the cohort at each P-value threshold in increments of one thousandth between 10-3 and 1. Uninformative SNPs determined to be in strong LD (r2 >0.8) within a linkage block when compared to the index SNP were removed. We tested a range of r2 from 0.2 to 0.9 and selected 0.8 as this gave the best predictive model - Nagelkerke’s value of 0.169 for r2 <0.2 versus 0.209 for r2 <0.8.
2.4 Statistical Analyses
Using the best-fit model, as identified by PRSice by the greatest Nagelkerke’s R2 value, the scores for each individual were analysed in SPSS to calculate the sensitivity and specificity of the model. The predictability of the model at correctly identifying cases and controls was calculated from the area under the receiver operating characteristic curve (AUC).
The results produced by PRSice were further analysed by decile scoring as carried out by Escott-Price
et al. (2015). Decile scoring is an alternative to quartile and percentile scoring and provides further
detail of trends in the data. Decile ranges were determined by segmenting the range of PRS into tenths and counting the number of cases and controls within each decile. Average scores of cases and controls within each decile were also calculated.
2.5 Polygenic Risk Score of the APOE locus
within this region from the NeuroX dataset to produce an alternative target dataset (Karolchik et al., 2004). The locus was identified as chr19:45,160,844-45,660,844 (GRCh37) (Kent et al., 2002). This altered version of the target dataset, carrying genotype information for 198 SNPs (including rs7412 but not including rs429358 as this failed QC) within the APOE region, was also tested using PRSice to calculate risk scores.
3.0 Results
In this study sEOAD cases and controls were genotyped on the NeuroX array; the array results were clustered and subjected to QC to produce a target dataset. This, along with the base dataset
provided by the IGAP consortium were used to generate PRS for all cases and controls using PRSice.
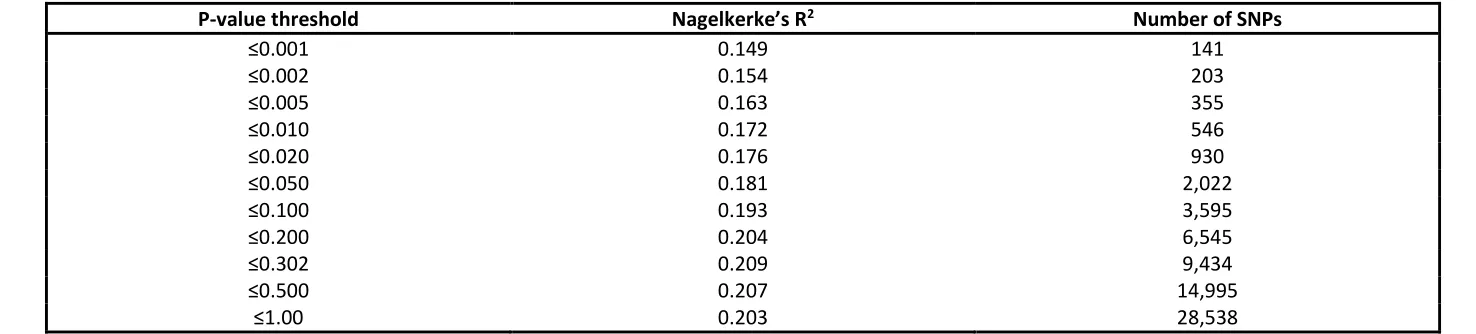
PRSice provides the Nagelkerke’s R2 scores produced at every P-value threshold tested and the number of SNPs used to calculate the scores. A total of 28,538 SNPs were common between the target dataset and the base dataset. The P-value threshold with the highest Nagelkerke’s R2 defines the best-fit for the dataset for identifying cases and controls. The best fit threshold used association data from 9,434 SNPs with a P-value ≤0.302 and produced the highest Nagelkerke’s R2 value of 0.209. A range of scores at different P-value thresholds with their corresponding R2 values and number of SNPs included is presented in Table 2.
The sensitivity and specificity of the best PRSice model was calculated in SPSS. Of the 408 cases in the NeuroX dataset, 59.1% were correctly identified as cases and 72.9% of the 436 controls were correctly identified as controls. The greatest predictive ability, AUC, of the PRS calculated by PRSice for this cohort was 72.9%. The value of Nagelkerke’s R2 calculated in SPSS, 0.209, was identical to the value obtained in PRSice, an indicator of reproductive power.
The average PRS for controls was 3.8E-04±6.75E-04 and 5.8E-04±6.9E-04 for cases - using an unpaired t-test on these PRS values gives a t-value of 12.33 with p<0.0001. Decile scoring was also used to visualise the pattern of PRS distribution between cases and controls. Each decile covered one tenth of the score, however the proportion of individuals within each decile varied. The first four deciles have a majority of controls, with fewer controls having high PRS compared to cases. A
PRS>0.00045 would determine an individual to more likely be a case than control. The details of decile scoring are displayed in figure 1 along with the distribution of scores for cases and controls, with the identification of the average score at each decile presented in figure 2.
A 500kb region surrounding the APOE gene was identified and the SNPs within the locus were isolated in the target dataset; PRS was calculated for individuals using association data from the IGAP consortium. Of the 198 SNPs present on the NeuroX array within this region, 31 were common with the base dataset. The Nagelkerke’s R2 value corresponding with the best-fit threshold of P≤0.001 was 0.124 using association data from 28 SNPs; using only the APOE locus, cases and
controls of AD can be predicted with an AUC of 65.2%. Linear regression was completed on the APOE locus dataset and compared to the PRS model as shown in figure 3. The APOE model identified controls with a specificity similar to the PRS model, calculated as 75.5% and 72.9% respectively; however, the ability to identify cases was not as accurate as the PRS model, with a sensitivity of 51.7% compared to 59.1%.
Variable information can also impact an individuals’ risk of developing AD: identifying an individuals’
APOE ε status is common in diagnosis, whilst gender needs to be controlled for whenever possible. A
combination of these variables using logistic regression produced the best model for identifying controls, with a specificity of 76.8% and sensitivity of 56.9%, most likely due to the protective effect of the ε2 allele. However, combining these three variables (ε2, ε4 and Sex) with individuals’ PRS produced a model with the best overall predictive ability of 75.5%; together with sensitivity of 64.5% and specificity of 73.1%. Results of logistic regression analysis for each risk-scoring model are
4.0 Discussion
A cohort of sEOAD cases and controls were genotyped on the NeuroX array and this information was used to generate PRS in PRSice using SNP association data from the IGAP consortium as the training set. The resulting risk model could successfully recognise an individual to either have sEOAD or be a healthy control with 72.9% accuracy. The addition of variables (number of APOE ε2 alleles, APOE ε4 alleles and Sex) in logistic regression improved the predictability to 75.5%.
There was a significantly higher average PRS in cases than controls (p<0.0001) with most individuals having a PRS above zero. Decile scoring showed most controls were within the lower deciles, with the absence of controls at the highest decile. For this analysis the base dataset we used was formed from LOAD cases rather than sEOAD, however we do not perceive this as an issue since the
pathogenic mechanisms for both sEOAD and LOAD are likely shared (Barber et al, 2017).
The APOE locus (500kb region centred on APOE) had a predictive accuracy of 65.2%, which confirms the high-risk contribution from known variants within this locus. Our analysis demonstrates that additional genetic variation across the rest of the genome also influences the risk of sEOAD. The NeuroX array that we have used genotypes SNPs from regions across the entire genome together with custom content which includes genes associated with several other neurological diseases including AD. These types of arrays provide a practical means to obtain greater accuracy of predictive ability in complex diseases.
The presence of controls with high PRS suggests that individuals can have SNPs that are associated with a greater risk of sEOAD but they may not develop AD. This would support the idea that in addition to risk variants there are uncharacterised protective variants in the genome that modify an individual’s risk of getting the disease. The five controls present within the ninth decile had a high PRS; these individuals might have gone on to develop AD - the average age at death of these individuals was below eighty years. Additionally a high PRS could indicate risk for AD in later life or the risk of other neurological diseases that correlate with AD. Low PRS could be indicative of neuroprotection, however low scores were also be found in some of our sEOAD cases. Healthy controls with high PRS and cases with low PRS are possible indicators of missing heritability or as yet unknown environmental factors affecting the risk of developing AD.
The predictability of disease as estimated by the AUC derived from ε2, ε4 and Sex was 71.4%. The AUC for the best model included these variables but the addition of PRS increased the predictive ability by more than 3%. More extensive genotyping and additional information collected about individuals’ lifestyles could further improve the predictability of AD risk. Further improvements of genetic-based prediction models could increase the predictability to the point where at-risk individuals are readily identified and potentially stratified using genetic testing.
In the study performed by Escott-Price et al. (2015), an AUC of 78.2% was achieved using association data from 87,605 SNPs combined with covariate information for sex, age, and APOE. The study produced a set of scores with more variability, due to more SNPs in common between both datasets, although the indicator for a good model is ultimately determined by the Nagelkerke’s R2 value. A more diverse set of scores for AD could lead to the ability of identifying specific groups within the disease cohort, and introduce treatment plans according to the variants identified (Eusden et al., 2015). In our study using a much-reduced number of pathologically confirmed sEOAD cases (n=408) we have obtained comparable PRS (AUC of 75.5%) to the original study of Escott-Price et al. (2015) generated for 3,049 LOAD cases and 1,554 controls. This demonstrates the increased power that can be realised using pathologically confirmed tissue in comparison to clinically defined samples. In a more recent study, Escott-Price et al. (2017a) used a modified approach to calculate the maximum possible predictive power (AUCmax) thereby improving the AUC produced previously from a value of 78.2% to 82%. More recently Escott-Price et al. (2017b) have performed PRS analysis on
pathologically confirmed samples and found improved scores compared with the previous study on clinically diagnosed cases (Escott-Price et al. (2015)).
Acknowledgements
The ARUK Consortium members are Peter Passmore, David Craig, Janet Johnston, Bernadette McGuinness, Stephen Todd, Reinhard Heun, Heike Kölsch, Patrick G. Kehoe, Emma R.L.C. Vardy, Nigel M. Hooper, Stuart Pickering-Brown, Julie Snowden, Anna Richardson, Matthew Jones, David Neary, Jennifer Harris, James Lowe, A. David Smith, Gordon Wilcock, Donald Warden, and Clive Holmes.
Jose Bras and Rita Guerreiro¹s work is funded by Fellowships from Alzheimer¹s Society. This work was partially funded by Alzheimer¹s Research UK, Alzheimer¹s Society and an anonymous donor.
We thank the International Genomics of Alzheimer's Project (IGAP) for providing summary results data for these analyses. The investigators within IGAP contributed to the design and implementation of IGAP and/or provided data but did not participate in analysis or writing of this report. IGAP was made possible by the generous participation of the control subjects, the patients, and their families. The i-Select chips were funded by the French National Foundation on Alzheimer's disease and related disorders. EADI was supported by the LABEX (laboratory of excellence program investment for the future) DISTALZ grant, Inserm, Institut Pasteur de Lille, Université de Lille 2, and the Lille University Hospital. GERAD was supported by the Medical Research Council (Grant n° 503480), Alzheimer's Research UK (Grant n° 503176), the Wellcome Trust (Grant n° 082604/2/07/Z) and German Federal Ministry of Education and Research (BMBF): Competence Network Dementia (CND) grant n° 01GI0102, 01GI0711, 01GI0420. CHARGE was partly supported by the NIH/NIA grant R01 AG033193 and the NIA AG081220 and AGES contract N01–AG–12100, the NHLBI grant R01
HL105756, the Icelandic Heart Association, and the Erasmus Medical Center and Erasmus University. ADGC was supported by the NIH/NIA grants: U01 AG032984, U24 AG021886, U01 AG016976, and the Alzheimer's Association grant ADGC–10–196728.
References
Adams, H. H., R. F. de Bruijn, A. Hofman, A. G. Uitterlinden, C. M. van Duijn, M. W. Vernooij, P. J. Koudstaal and M. A. Ikram (2015). Genetic risk of neurodegenerative diseases is associated with mild cognitive impairment and conversion to dementia. Alzheimer’s Dementia 11(11): 1277-1285
Ayers, K. L., Mirshahi, U. L., Wardeh, A. H., Murray, M. F., Hao, K., Glicksberg, B. S., Li, S., Carey, D. J. and Chen, R. (2016). A loss of function variant in CASP7 protects against Alzheimer’s disease in homozygous APOE ε4 allele carriers. BMC Genomics. 17: 445.
Barber, I., Braae, A., Clement, N., Patel, T., Guetta-Baranes, T., Brookes, K., Medway, C., Chappell, S., Guerreiro, R., Bras, J., Hernandez, D., Singleton, A., Hardy, J., Mann, D., ARUK Consortium and Morgan, K. (2017). Mutational analysis of sporadic early-onset Alzheimer’s disease using the NeuroX array. Neurobiology of Aging. 49. 215.e1-215.e8.
Basu, S., W. Pan, X. Shen and W. S. Oetting (2011). Multilocus association testing with penalized regression. Genetic Epidemiology 35(8): 755-765.
Blauwendraat, C., Faghri, F., Pihlstrom, L., Geiger, J. T., Elbaz, A., Lesage, S., Corvol, J., May, P., Ryten, M., Ferrari, R., Bras, J., Guerreiro, R., Williams, J., Sims, R., Lubbe, S., Hernandez, D. G., Mok, K. Y., Robak, L., Campbell, R. H., Rogaeva, E., Traynor, B. J., Chia, R., Chung, S. J., International Parkinson’s Disease Genomics Consortium (IPDGC), COURAGE-PD Consortium, Hardy, J. A., Brice, A., Wood, N. W., Houlden, H., Shulman, J. M., Morris, H. R., Gasser, T., Krüger, R., Heutink, P., Sharma, M., Simón Sánchez, J., Nalls, M. A., Singleton, A. B., Scholz, S. W. (2017). Neurobiology of Aging.
http://dx.doi.org/10.1016/j.neurobiolaging.2017.05.009
Budson, A. and Kowall, N. (2011). The Handbook of Alzheimer’s Disease and Other Dementias. Chichester, UK. Wiley-Blackwell. Preface XV-XV.
Bush, W. and Moore, J. (2012). Chapter 11: Genome-Wide Association Studies. PLoS Computational
Biology. 8(12): e1002822.
Chapman, J. and J. Whittaker (2008). Analysis of multiple SNPs in a candidate gene or region. Genetic
Epidemiology 32(6): 560-566.
Chouraki, V., C. Reitz, F. Maury, J. C. Bis, C. Bellenguez, L. Yu, J. Jakobsdottir, S. Mukherjee, H. H. Adams, S. H. Choi, E. B. Larson, A. Fitzpatrick, A. G. Uitterlinden, P. L. de Jager, A. Hofman, V. Gudnason, B. Vardarajan, C. Ibrahim-Verbaas, S. J. van der Lee, O. Lopez, J. F. Dartigues, C. Berr, P. Amouyel, D. A. Bennett, C. van Duijn, A. L. DeStefano, L. J. Launer, M. A. Ikram, P. K. Crane, J. C. Lambert, R. Mayeux and S. Seshadri (2016). Evaluation of a Genetic Risk Score to Improve Risk Prediction for Alzheimer's Disease. J Alzheimer’s Disease 53(3): 921-932.
Desikan, R. S., Fan, C. C., Wang, Y., Schork, A. J., Cabral, H. J., Cupples, L. A., Thompson, W. K., Besser, L., Kukull, W. A., Holland, D., Chen, C., Brewer, J. B., Karow, D. S., Kauppi, K., Witoelar, A., Karch, C. M., Bonham, L. W., Yokoyama, J. S., Rosen, H. J., Miller, B. L., Dillion, W. P., Wilson, D. M., Hess, C. P., Pericak-Vance, M., Haines, J. L., Farrer, L. A., Mayeux, R., Hardy, J., Goate, A. M., Hyman, B. T., Schellenberg, G. D., McEvoy, L. K., Andreassen, O. A., Dale, A. M. (2017). Genetic assessment of age-associated Alzheimer’s disease risk: Development and validation of a polygenic hazard score. PLoS
Medicine. 14(3): e1002258.
Jones, L., Hardy, J., Seshadri, S., Schellenberg, G. D., Amouyel and Williams, J. (2015). Common polygenic variation enhances risk prediction for Alzheimer’s disease. Brain. 138: 3673-3684.
Escott-Price, V., Shoai, M., Pither, R., Williams, J., and Hardy, J. (2017a). Polygenic score prediction captures nearly all common genetic risk for Alzheimer’s disease. Neurobiology of Aging. 49: 214e7-11.
Escott-Price, V., Myers, A. J., Huentelman, M., Hardy, J. (2017b). Annals of Neurology. 10.1002/ana.24999
Euesden, J., Lewis, C. and O'Reilly, P. (2015). PRSice: Polygenic Risk Score software. Bioinformatics. 31(9): 1466-1468.
Giri, M., Zhang, M. and Lü, Y. (2016). Genes associated with Alzheimer’s disease: an overview and current status. Clinical Interventions of Aging. 11: 665-681
Guerreiro R., Wojtas A., Bras J., Carrasquillo M., Rogaeva E., Majounie E., Cruchaga C., Sassi, C., Kauwe J.S.K., Younkin S., Hazrati L., Collinge J., Pocock J., Lashley T., Williams J., Amouyel P., Goate A., Rademakers R., Morgan K., Powell J., George-Hislop P., Singleton A., Hardy J., and the Alzheimer Genetic Analysis Group, (2013). TREM2 variants in Alzheimer’s disease. The New England Journal of
Medicine, 368(2), 117–27.
Harrison, T. M., Z. Mahmood, E. P. Lau, A. M. Karacozoff, A. C. Burggren, G. W. Small and S. Y. Bookheimer (2016). An Alzheimer's Disease Genetic Risk Score Predicts Longitudinal Thinning of Hippocampal Complex Subregions in Healthy Older Adults. eNeuro 3(3).
Illumina. (2012). HumanExome BeadChips. Data Sheet: DNA Analysis. Available at:
www.smd.qmul.ac.uk/gc/Services/InfiniumArrays/datasheet_humanexome_beadchips.pdf
Jonsson T., Stefansson H., Steinberg S., Jonsdottir I., Jonsson P.V., Snaedal J., et al. (2013). Variant of TREM2 associated with the risk of Alzheimer’s disease. The New England Journal of Medicine, 368(2), 107–16.
Karolchik, D., Hinrichs, A. S., Furey, T. S., Roskin, K. M., Sugnet, C. W., Haussler, D. and Kent, W. J. (2004). The USCS Table Browser data retrieval tool. Nucleic Acids Research. 32: D493-496.
Kent, W. J., Sugnet, C. W., Furey, T. S., Roskin, K. M., Pringle, T. H., Zahler, A. M. and Haussler, D. The human genome browser at UCSC. (2002). Genome Research. 12(6): 996-1006.
Lambert, J. C., Ibrahim-Verbaas, C. A., Harold, D., Naj, A. C., Sims, R., Bellenguez, C., DeStafano, A. L., Bis, J. C., Beecham, G. W., Grenier-Boley, B., Russo, G., Thorton-Wells, T. A., Jones, N., Smith, A. V., Chouraki, V., Thomas, C., Ikram, M. A., Zelenika, D., Vardarajan, B. N., Kamatani, Y., Lin, C. F., Gerrish, A., Schmidt, H., Kunkle, B., Dunstan, M. L., Ruiz, A., Bihoreau, M.T., Choi, S.H., Reitz, C., Pasquier, F., Cruchaga, C., Craig, D., Amin, N., Berr, C., Lopez, O.L., De Jager, P. L., Deramecourt, V., Johnston, J. A., Evans, D., Lovestone, S., Letenneur, L., Morón, F. J., Rubinsztein, D. C., Eiriksdottir, G., Sleegers, K., Goate, A. M., Fiévet, N., Huentelman, M. W., Gill, M., Brown, K., Kamboh, M. I., Keller, L., Barberger-Gateau, P., McGuiness, B., Larson, E. B., Green, R., Myers, A. J., Dufouil, C., Todd, S., Wallon, D., Love, S., Rogaeva, E., Gallacher, J., St George-Hyslop, P., Clarimon, J., Lleo, A., Bayer, A., Tsuang, D. W., Yu, L., Tsolaki, M., Bossù, P., Spalletta, G., Proitsi, P., Collinge, J., Sorbi, S., Sanchez-Garcia, F., Fox, N. C., Hardy, J., Deniz Naranjo, M. C., Bosco, P., Clarke, R., Brayne, C., Galimberti, D., Mancuso, M., Matthews, F.; European Alzheimer's Disease Initiative (EADI); Genetic and
W., Hampel, H., Pilotto, A., Bullido, M., Panza, F., Caffarra, P., Nacmias, B., Gilbert, J. R., Mayhaus, M., Lannefelt, L., Hakonarson, H., Pichler, S., Carrasquillo, M. M., Ingelsson, M., Beekly, D., Alvarez, V., Zou, F., Valladares, O., Younkin, S. G., Coto, E., Hamilton-Nelson, K. L., Gu, W., Razquin, C., Pastor, P., Mateo, I., Owen, M. J., Faber, K. M., Jonsson, P. V., Combarros, O., O'Donovan, M. C., Cantwell, L. B., Soininen, H., Blacker, D., Mead, S., Mosley, T. H. Jr., Bennett, D. A., Harris, T. B., Fratiglioni, L., Holmes, C., de Bruijn, R. F., Passmore, P., Montine, T. J., Bettens, K., Rotter, J. I., Brice, A., Morgan, K., Foroud, T. M., Kukull, W. A., Hannequin, D., Powell, J. F., Nalls, M. A., Ritchie, K., Lunetta, K. L., Kauwe, J. S., Boerwinkle, E., Riemenschneider, M., Boada, M., Hiltuenen, M., Martin, E. R., Schmidt, R., Rujescu, D., Wang, L. S., Dartigues, J. F., Mayeux, R., Tzourio, C., Hofman, A., Nöthen, M. M., Graff, C., Psaty, B. M., Jones, L., Haines, J. L., Holmans, P. A., Lathrop, M., Pericak-Vance, M. A., Launer, L. J., Farrer, L. A., van Duijn, C. M., Van Broeckhoven, C., Moskvina, V., Seshadri, S., Williams, J., Schellenberg, G. D. and Amouyel, P. (2013). Meta-analysis of 74,046 individuals identifies 11 new susceptibility loci for Alzheimer’s disease. Nature Genetics. 45(12): 1452-1458.
Liu, C., Kanekiyo, T., Xu, H. and Bu, G. (2013). Apolipoprotein E and Alzheimer’s disease: risk, mechanisms, and therapy. Nature Reviews Neurology. 9(2): 106-118.
Liu, Y., Nyunoya, T., Leng, S., Belinsky, S. A., Tesfaigzi, Y., Bruse, S. (2013). Softwares and methods for estimating genetic ancestry in human populations. Human Genomics. 7(1): 1-7.
Logue, M. W., Schu, M., Vardarajan, B. N., Farrell, J., Bennett, D. A., Buxbaum, J. D., Byrd, G. S., Ertekin-Taner, N., Evans, D., Foroud, T. Goate, A., Graff-Radford, N. R., Kamboh, M. I., Kukull, W. A., Manly, J. J., Alzheimer’s Disease Genetics Consortium, Haines, J. L., Mayeux, R., Pericak-Vance, M. A., Schellenberg, G. D., Lunetta, K. L., Baldwin, C. T., Fallin, M. D., and Farrer, L. A. (2014).Two rare AKAP9 variants are associated with Alzheimer’s disease in African Americans. Alzheimer’s &
Dementia. 10 (6). Pages 609-618.
Lupton, M. K., L. Strike, N. K. Hansell, W. Wen, K. A. Mather, N. J. Armstrong, A. Thalamuthu, K. L. McMahon, G. I. de Zubicaray, A. A. Assareh, A. Simmons, P. Proitsi, J. F. Powell, G. W. Montgomery, D. P. Hibar, E. Westman, M. Tsolaki, I. Kloszewska, H. Soininen, P. Mecocci, B. Velas, S. Lovestone, H. Brodaty, D. Ames, J. N. Trollor, N. G. Martin, P. M. Thompson, P. S. Sachdev and M. J. Wright (2016). The effect of increased genetic risk for Alzheimer's disease on hippocampal and amygdala volume.
Neurobiology of Aging 40: 68-77.
Marden, J. R., S. Walter, E. J. Tchetgen Tchetgen, I. Kawachi and M. M. Glymour (2014). Validation of a polygenic risk score for dementia in black and white individuals. Brain Behaviour 4(5): 687-697.
Marden, J. R., E. R. Mayeda, S. Walter, A. Vivot, E. J. Tchetgen Tchetgen, I. Kawachi and M. M. Glymour (2016). Using an Alzheimer Disease Polygenic Risk Score to Predict Memory Decline in Black and White Americans Over 14 Years of Follow-up. Alzheimer Disease Associated Disorders 30(3): 195-202.
Martiskainen, H., S. Helisalmi, J. Viswanathan, M. Kurki, A. Hall, S. K. Herukka, T. Sarajarvi, T. Natunen, K. M. Kurkinen, J. Huovinen, P. Makinen, M. Laitinen, A. M. Koivisto, K. M. Mattila, T. Lehtimaki, A. M. Remes, V. Leinonen, A. Haapasalo, H. Soininen and M. Hiltunen (2015). Effects of Alzheimer's disease-associated risk loci on cerebrospinal fluid biomarkers and disease progression: a polygenic risk score approach. J Alzheimer’s Disease 43(2): 565-573.
Naj, A. C. and Schellenberg, G. D. (2016). Genomic Variants, Genes, and Pathways of Alzheimer’s Disease: An Overview. American Journal of Medical Genetics Part B: Neuropsychiatric Genetics. 174: 5-26.
Nalls, M. A., Bras, J., Hernandez, D. G., Keller, M. F., Majounie, E., Renton, A. E., Saad, M., Jansen, I., Guerreiro, R., Lubbe, S., Plagnol, V., Gibbs, J. R., Schulte, C., Pankratz, N., Sutherland, M., Bertram, L., Lill, C. M., DeStefano, A. L., Faroud, T., Eriksson, N., Tung, J. Y., Edsall, C., Nichols, N., Brooks, J., Arepalli, S., Pilner, H., Letson, C., Heutink, P., Martinez, M., Gasser, T., Traynor, B. J., Wood, N., Hardy, J., Singleton, A. B. (2015). NeuroX, a fast and efficient genotyping platform for investigation of neurodegenerative diseases. Neurobiology of Aging. 36(3): 1605e7-12.
Pan, W., Y. M. Chen and P. Wei (2015). Testing for polygenic effects in genome-wide association studies. Genetic Epidemiology 39(4): 306-316.
Prince, M., Wimo, A., Guerchet, M., Ali, G., Wu, Y., Prina, M. (2015). World Alzheimer’s Report 2015. The Global Impact of Dementia: An analysis of prevalence, incidence, cost, and trends. Alzheimer’s
Disease International.
Purcell, S. M., Neale, B., Todd-Brown, K., Thomas, L., Ferreira, M. A., Bender, D., Maller, J., Sklar, P., de Bakker, P., Daly, M. and Sham, P. (2007). PLINK: A Tool Set for Whole-Genome Association and Population-Based Linkage Analyses. The American Journal of Human Genetics. 81(3): 559-575.
R Core Team. (2013). R: A language and environment for statistical computing. R Foundation for Statistical Computing, Vienna, Austria. URL http://www.R-project.org/.
Rodriguez-Rodriguez, E., P. Sanchez-Juan, J. L. Vazquez-Higuera, I. Mateo, A. Pozueta, J. Berciano, S. Cervantes, D. Alcolea, P. Martinez-Lage, J. Clarimon, A. Lleo, P. Pastor and O. Combarros (2013). Genetic risk score predicting accelerated progression from mild cognitive impairment to Alzheimer's disease. J Neural Transmission (Vienna) 120(5): 807-812.
Ruiz, A., Heilmann, S., Becker, T., Hernandez, I., Wagner, H., Thelen, M., Mauleon, A., Rosende-Roca, M., Bellenguez, C., Bis, J. C., Harold, D., Gerrish, A., Sims, R., Sotolongo-Grau, O., Espinosa, A., Alegret, M., Arrieta, J. L., Lacour, A., Leber, M., Becker, J., Lafuente, A., Ruiz, S., Vargas, L., Rodriguez, O., Ortega, G., Dominguez, M., IGAP, Mayeux, R., Haines, J. L., Pericak-Vance, M. A., Farrer, L. A., Schellenberg, G. D., Chouraki, V., Launer, L. J., van Duijn, C., Seshradi, S., Atunez, C., Breteler, M. M., Serrano-Rios, M., Jessen, F., Tarraga, L., Nothen, M. M., Maier, W., Boada, M. and Ramirez, A. (2014). Follow-up of loci from the International Genomics of Alzheimer’s Disease Project identifies TRIP4 as a novel susceptibility gene. Translational Psychiatry. 4 (2): e358.
Sabuncu, M. R., R. L. Buckner, J. W. Smoller, P. H. Lee, B. Fischl and R. A. Sperling (2012). The association between a polygenic Alzheimer score and cortical thickness in clinically normal subjects.
Cerebral Cortex 22(11): 2653-2661.
S., Keller, L., Brown, K., Lin, H., Cantwell, L. B., Panza, F., McGuinness, B., Moreno-Grau, S., Burgess, J. D., Solfrizzi, V., Proitsi, P., Adams, H. H., Allen, M., Seripa, D., Pastor, P., Cupples, L. A., Price, N. D., Hannequin, D., Frank-García, A., Levy, D., Chakrabarty, P., Caffarra, P., Giegling, I., Beiser, A. S., Giedraitis, V., Hampel, H., Garcia, M. E., Wang, X., Lannfelt, L., Mecocci, P., Eiriksdottir, G., Crane, P. K., Pasquier, F., Boccardi, V., Henández, I., Barber, R. C., Scherer, M., Tarraga, L., Adams, P. M., Leber, M., Chen, Y., Albert, M. S., Riedel-Heller, S., Emilsson, V., Beekly, D., Braae, A., Schmidt, R., Blacker, D., Masullo, C., Schmidt, H., Doody, R. S., Spalletta, G., Jr, W. T. L., Fairchild, T. J., Bossù, P., Lopez, O. L., Frosch, M. P., Sacchinelli, E., Ghetti, B., Yang, Q., Huebinger, R. M., Jessen, F., Li, S., Kamboh, M. I., Morris, J., Sotolongo-Grau, O., Katz, M. J., Corcoran, C., Dunstan, M., Braddel, A., Thomas, C., Meggy, A., Marshall, R., Gerrish, A., Chapman, J., Aguilar, M., Taylor, S., Hill, M., Fairén, M. D., Hodges, A., Vellas, B., Soininen, H., Kloszewska, I., Daniilidou, M., Uphill, J., Patel, Y., Hughes, J. T., Lord, J., Turton, J., Hartmann, A. M., Cecchetti, R., Fenoglio, C., Serpente, M., Arcaro, M., Caltagirone, C., Orfei, M. D., Ciaramella, A., Pichler, S., Mayhaus, M., Gu, W., Lleó, A., Fortea, J., Blesa, R., Barber, I. S., Brookes, K., Cupidi, C., Maletta, R. G., Carrell, D., Sorbi, S., Moebus, S., Urbano, M., Pilotto, A., Kornhuber, J., Bosco, P., Todd, S., Craig, D., Johnston, J., Gill, M., Lawlor, B., Lynch, A., Fox, N. C., Hardy, J.; ARUK Consortium, Albin, R. L., Apostolova, L. G., Arnold, S. E., Asthana, S., Atwood, C. S., Baldwin, C. T., Barnes, L. L., Barral, S., Beach, T. G., Becker, J. T., Bigio, E. H., Bird, T. D., Boeve, B. F., Bowen, J. D., Boxer, A., Burke, J. R., Burns, J. M., Buxbaum, J. D., Cairns, N. J., Cao, C., Carlson, C. S., Carlsson, C. M., Carney, R. M., Carrasquillo, M. M., Carroll, S. L., Diaz, C. C., Chui, H. C., Clark, D. G., Cribbs, D. H., Crocco, E. A., DeCarli, C., Dick, M., Duara, R., Evans, D. A., Faber, K. M., Fallon, K. B., Fardo, D. W., Farlow, M. R., Ferris, S., Foroud, T. M., Galasko, D. R., Gearing, M., Geschwind, D. H., Gilbert, J. R., Graff-Radford, N. R., Green, R. C., Growdon, J. H., Hamilton, R. L., Harrell, L. E., Honig, L. S., Huentelman, M. J., Hulette, C. M., Hyman, B. T., Jarvik, G. P., Abner, E., Jin, L. W., Jun, G., Karydas, A., Kaye, J. A., Kim, R., Kowall, N. W., Kramer, J. H., LaFerla, F. M., Lah, J. J., Leverenz, J. B., Levey, A. I., Li, G., Lieberman, A. P., Lunetta, K. L., Lyketsos, C. G., Marson, D. C., Martiniuk, F., Mash, D. C., Masliah, E., McCormick, W. C., McCurry, S. M., McDavid, A. N., McKee, A. C., Mesulam, M., Miller, B. L., Miller, C. A., Miller, J. W., Morris, J. C., Murrell, J. R., Myers, A. J., O'Bryant, S., Olichney, J. M., Pankratz, V. S., Parisi, J. E., Paulson, H.L., Perry, W., Peskind, E., Pierce, A., Poon, W. W., Potter, H., Quinn, J. F., Raj, A., Raskind, M., Reisberg, B., Reitz, C., Ringman, J. M., Roberson, E. D., Rogaeva, E., Rosen, H. J., Rosenberg, R. N., Sager, M. A., Saykin, A. J., Schneider, J. A., Schneider, L. S., Seeley, W. W., Smith, A. G., Sonnen, J. A., Spina, S., Stern, R. A., Swerdlow, R. H., Tanzi, R.E., Thornton-Wells, T. A., Trojanowski, J. Q., Troncoso, J. C., Van Deerlin, V. M., Van Eldik, L. J., Vinters, H. V., Vonsattel, J. P., Weintraub, S., Welsh-Bohmer, K. A., Wilhelmsen, K. C., Williamson, J., Wingo, T. S., Woltjer, R. L., Wright, C. B., Yu, C. E., Yu, L., Garzia, F., Golamaully, F., Septier, G., Engelborghs, S., Vandenberghe, R., De Deyn, P. P., Fernadez, C. M., Benito, Y. A., Thonberg, H., Forsell, C., Lilius, L., Kinhult-Stählbom, A., Kilander, L., Brundin, R., Concari, L., Helisalmi, S., Koivisto, A. M., Haapasalo, A., Dermecourt, V., Fievet, N., Hanon, O., Dufouil, C., Brice, A., Ritchie, K., Dubois, B., Himali, J. J., Keene, C. D., Tschanz, J., Fitzpatrick, A. L., Kukull, W. A., Norton, M., Aspelund, T., Larson, E. B., Munger, R., Rotter, J.I., Lipton, R. B., Bullido, M. J., Hofman, A., Montine, T. J., Coto, E., Boerwinkle, E., Petersen, R. C., Alvarez, V., Rivadeneira, F., Reiman, E. M., Gallo, M., O'Donnell, C. J., Reisch, J. S., Bruni, A. C., Royall, D. R., Dichgans, M., Sano, M., Galimberti, D., St George-Hyslop, P., Scarpini, E., Tsuang, D. W.,
Hakonarson, H., Campion, D., Boada, M., Kauwe, J. K., Farrer, L. A., van Broeckhoven, C., Ikram, M. A., Jones, L., Haines, J. L., Tzourio, C., Launer, L .J., Escott-Price V., Mayeux, R., Deleuze, J. F., Amin, N., Holmans, P. A., Pericak-Vance, M. A., Amouyel, P., van Duijn, C. M., Ramirez, A., Wang, L. S., Lambert, J. C., Seshadri S., Williams J. and Schellenberg G. D. (2017). Rare coding variants in PLCG2, ABI3 and TREM2 implicate microglial-mediated innate immunity in Alzheimer’s disease. Nature
Genetics. 49: 1373-1384.
Sleegers, K., K. Bettens, A. De Roeck, C. Van Cauwenberghe, E. Cuyvers, J. Verheijen, H. Struyfs, J. Van Dongen, S. Vermeulen, S. Engelborghs, M. Vandenbulcke, R. Vandenberghe, P. P. De Deyn and C. Van Broeckhoven (2015). A 22-single nucleotide polymorphism Alzheimer's disease risk score
correlates with family history, onset age, and cerebrospinal fluid Abeta42." Alzheimer’s Dementia 11(12): 1452-1460.
Verhaaren, B. F., M. W. Vernooij, P. J. Koudstaal, A. G. Uitterlinden, C. M. van Duijn, A. Hofman, M. M. Breteler and M. A. Ikram (2013). Alzheimer's disease genes and cognition in the nondemented general population. Biol Psychiatry 73(5): 429-434.
Wingo, T. S., Lah, J. J., Levey, A. I. and Cutler, D. J. (2012). Autosomal Recessive Causes Likely in Early-Onset Alzheimer’s Disease. Archives of Neurology. 69: 59.
Xiao, Q., Z. J. Liu, S. Tao, Y. M. Sun, D. Jiang, H. L. Li, H. Chen, X. Liu, B. Lapin, C. H. Wang, S. L. Zheng, J. Xu and Z. Y. Wu (2015). Risk prediction for sporadic Alzheimer's disease using genetic risk score in the Han Chinese population. Oncotarget 6(35): 36955-36964.
Legends
Figure 1 – Proportion of diagnosed sEOAD cases and controls at each decile determined by range of score.
The figure breaks down the range of PRS into deciles. The range of scores which make up each decile are depicted as well as the number of cases and controls, and the percentage of individuals which fall into each decile. Controls are right-skewed whilst cases demonstrate left skewness. These figures were produced from PRS of 408 sEOAD cases and 436 controls. The embedded table lists the decile ranges with the number of cases and controls in each decile along with the proportion of the cohort which make up each decile.
Figure 2 – Distribution of polygenic risk score amongst sEOAD cases and controls with average scores at each decile.
The range of PRS obtained for cases and controls are distributed into deciles. The range of coverage of each decile is shown in the bar plot together with the proportion of cases and controls which make up each decile. The average scores for all cases and controls are indicated by the thick bar whilst the short horizontal bars show PRS for each individual. Average scores at each decile are indicated as hollow circles for cases and filled circles for controls.
Figure 3 – Results of logistic regression with an area under the receiver operating characteristic curve (AUC) for alternative risk scoring models in sEOAD.
Table 1
A
Centre N Mean age at onset Females (%) APOE ε4+ (%) APOE ε4ε4 (%)
Bristol 21 53.3 11 (52.4) 10 (47.6) 3 (14.3)
Manchester 328 57.1 152 (46.3) 194 (59.1) 47 (14.3)
Nottingham 26 58.2 12 (46.2) 11 (42.3) 1 (3.8)
Oxford 33 55.6 19 (57.6) 19 (57.6) 3 (9.1)
All sEOAD Cases 408 56.8 194 (47.5) 234 (57.4) 54 (13.2)
B
Centre N Mean age at death Females (%) APOE ε4+ (%) APOE ε4ε4 (%)
UCL 436 77.2 256 (58.7) 104 (23.9) 9 (2.2)
Table 2
P-value threshold Nagelkerke’s R2 Number of SNPs
≤0.001 0.149 141
≤0.002 0.154 203
≤0.005 0.163 355
≤0.010 0.172 546
≤0.020 0.176 930
≤0.050 0.181 2,022
≤0.100 0.193 3,595
≤0.200 0.204 6,545
≤0.302 0.209 9,434
≤0.500 0.207 14,995
Legends
Table 1 – Demographics of the sEOAD and controls cohort.
The sEOAD cases were recruited from four centres within the UK, the number of individuals from each centre is outlined above. All cases had a documented or calculated age at onset below 65 years. The number of females from each centre is recorded with the percentage per centre together with the percentage of individuals from each centre harbouring at least one APOE ε4 allele (ε4+) along with the number and percentage of individuals from each centre with the ε4ε4 genotype. (B) All controls were recruited from a single centre in the UK (UCL, London), the number of individuals is given above. The mean age at death for controls is given with the number and proportion of
females. The number of individuals harbouring at least one APOE ε4 allele and the number and proportion of controls with the ε4ε4 genotype is also included.
Table 2 – Nagelkerke’s R2 values at varying p-value thresholds
The table lists some of the P-value thresholds tested by PRSice and their corresponding Nagelkerke’s R2 value, along with the number of SNPs used in calculating PRS. A total of 28,438 SNPs were