© 2017, IRJET | Impact Factor value: 5.181 | ISO 9001:2008 Certified Journal | Page 3033
A Predetermined Position-Wise Node Deployment for
Optimizing Lifetime in Visual Sensor Network
Bharati S Pochal
1, Rashmi D Devaba
21
Assistant Professor, Department of Computer Application, VTU PG Centre, Kalaburagi, Karnataka, India
2Department of Computer Applications, VTU PG Centre, Kalaburagi, Karnataka, India
---***---ABSTRACT
-
As per the possible applications of the VisualSensor Networks (VSNs) which are rising as of the inspection and also for area followings are gaining foremost consideration. There is a miss balance in the energy handling between nodes of the visual sensors (SNs), which amplifies and then directs the untimely lessening within the network lifetime and the reason behind this is the cause of the directing. To optimize the existence of a network the channel Rayleigh Fading as well as the forms related to course-plotting is taken into account that stabilizes the using-up of energy. It has been examined and then resulted as the quantity of SNs, the rely nodes as well as the localities of these SNs have pressure onto restricting the difficulty related to energy hole problem and also optimizing the
duration of the network considerably. We develop a
heterogeneous SNs deployment strategy leads to optimize in network lifetime which is based on principle of energy balancing. Firstly to measure the amount of accomplishing our design goal of improving network lifetime while attaining energy harmonizing complete simulation is performed.
Key words: Node deployment, Energy balance, Energy hole
problem, Network lifetime, Visual sensor network.
1. INTRODUCTION
The Visual Sensor Network (VSN) which is the latest ever present pattern has been come forward due to its rapidity in the persistence for the amplification in hi-tech locale within the image sensors. There are a tiny nodes which is given by the VSNs called as the camera nodes that is used to amalgamate the sensors for image, the processors that are implanted as well as the transceiver that are wireless, where the images get confined from this camera nodes from which the images can also be taken out, while the processors are considered to take out the next step of the image dispensation like firmness or else the depiction of the image for making the judgments upon the images. As a final point the data that is been processed using the images is then sent for the apt target within the network and this is promoted into the base-station. The long-established work that is the Wireless Sensor Network (WSN) was worked on just judging on scalars while VSNs takes bulky set of judging particulars of images and the force required to practice it is optimized.
2. RELATED WORK
The resources that are crucial for the wide networks for which the working of the in-queue turns off the packets as well as the nodes accessing options of the channels are recognized here. The packets that are to be reported with respect to the events are treated fairly as compared to the opposed original processing of the packets is depicted here in [1].
The contribution of the force is restricted plus the networks with the nodes presented in the Wireless Sensor Networks (WSNs) have been considered for being in working state for longer occasions. For this reason in [2] it has much more concentrated upon the usage of the power by lowering it and raising the span of the network as an aim.
In [3].The associations that are related to Wireless Sensor Networks have been considered as the predetermined field for the exploring, which achieved lot of the noticeable views from researchers. The special one among many of the works of this network is the gathering up of the data those are scalar one, which includes temperature as well as the vibration.
The nodes which are taken for sensing the scalar information that are pressure, humidity and the temperature are used that causes the restricted production of data where it is considered to be an inconsistent approach still if the large sensory nodules are added in [4]. Hence there was a tremendous intricacy when such inputs were added as they are not the genuine sources so they need secular inputs.
The visual detecting capacity of a VSN makes it an extremely compelling apparatus for applications in [7], for example, huge scale reconnaissance, ecological observing and protest following. The picture detecting, preparing and putting away elements of the VSN, joined to its capacity of transferring and sending information towards the sink, expends further vitality and expands the outstanding vitality gap issue in the system.
© 2017, IRJET | Impact Factor value: 5.181 | ISO 9001:2008 Certified Journal | Page 3034
strategized to resolve the locality wise exploitationprocess. The limitations are.
The packets take a lot of the force in order to drive them.
When the power is thrashed it diminishes the natural life.
The nodes depart its life at the sooner stage. Not vitality productive.
More asset use.
3. SYSTEM DESIGN
How the entire set of the processing is taken up for the bigger range of the work is depicted in this portion, which then offers with the jobs of the application that will be set as well as they will be given with the groups those are smaller ones i.e the modules correctly.
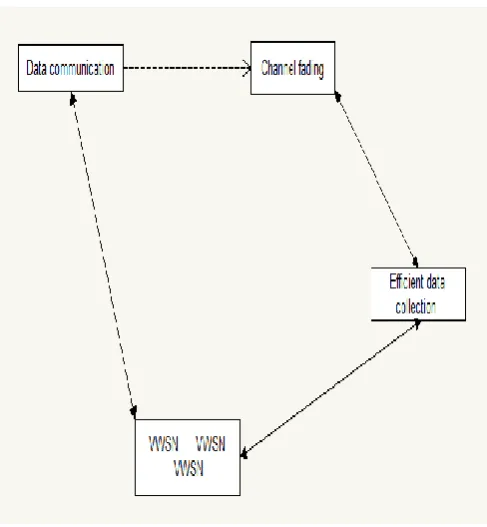
[image:2.595.314.558.117.390.2]Architecture Diagram
Figure 1: System architecture
The figure 1 shows the planning of the network. To begin with the nodes are positioned in the environmental locale, along with that through the nodes the specifics is conversing. Taking into account the Rayleigh fading direct plus course-plotting sections optimization of set-up duration can be catch. Capable statistics is composed as well as sent to the base station all the way through the visual nodes.
[image:2.595.37.281.344.608.2]Sequence Diagram
Figure 2: Sequence diagram
It is evidence for how the tricks are affected successively within the network. To start with nodes they are set out along with nodes force is premeditated. Glancing for nosiness plus the direct desertion is finished. Furthermore, the working-out for inaccuracies in the strait, if no faults then distribution of the essentials headed for the sink node plus force is reasonable.
3.1 Problem Statement
The worry with the past VSNs was that it could not assure the power usage that lead in the decline of the functionality of the network .So, it was obligatory to stabilize the power storing-up, which could be reached through restraining the breakdown of the force that is needed to operate upon the network with regards to sensing.
3.1 Proposed System
The work upon the sensing ways, on behalf of operation of the mixed SNs with the locality based recognition is been primed, so as to attain the stabilization of the power at the advanced area. The advantages of proposed work are.
It takes up extremely lower range of in-taking of the force.
The life of the battery usage is the lesser.
© 2017, IRJET | Impact Factor value: 5.181 | ISO 9001:2008 Certified Journal | Page 3035
Proficient information transmission. Vitality proficient and organize lifetime change. Area mindful makes neighbor hub recognition
simple.
3.2 Objective
To arrive at the optimization level on behalf of harmonizing the power preservation plus the time essential for usage purpose for the network by providing the restraint to the gaps for the power, in addition to that the most chief thing is to come across the location using the sensory nodes and intimate the emergency locale from the target place is the genuine intent of this application.
3.3 Methodology
Dijkstra’s Algorithm is properly prepared for exploring of the charts so as to work out the path related issues that relate to reach the particular source easiest way, which provides the edging based path price tags that are non-negative ones giving out the easy way in a tree layout. It is most probably made use in the concepts like course finding plus the subroutine within another form.
Steps:
Step 1: It keeps up a rundown of unvisited vertices. Step 2: It picks a vertex (the source) and doles out a most extreme conceivable cost to each other vertex.
Step 3: The cost of the source stays zero as it really takes nothing to reach from the source vertex to itself.
Step 4: In each consequent stride of the calculation it tries to enhance the cost for every vertex. Here the cost can be separation, cash or time taken to achieve that vertex from the source vertex. The minimization of cost is a multi-step prepare.
Step 5: For each unvisited neighbor of the present vertex figure the new cost from the vertex.
Step 6: When every one of the neighbors of the present hub are thought of it as, marks the present hub as went to and is expelled from the unvisited hubs and rehash step 4. Step 7: At the end there will be no conceivable outcomes to enhance it further and after that the calculation closes.
4. IMPLEMENTATION
4.1 Modules Description
1. Network Module
This part contains description of the functionalities used in building the topology. The formation of the wireless set up topology and the nodes relating to the portable topology where all of the nodes run upon the enormous channels.
2. Energy Module
This is capable to just hold up the exact amount of the force and will not be able to preserve the conditions of a radio. But it can nonspecifically hold the replications that can be taken up in forthcoming days which include the exploitation of the CPU.
3. Node deployment Module
This will take into account of the setting- up of the diverse nodes that are generally considered to stabilize out the in-taking.
4.2 Algorithm
Node Deployment Algorithm
This algorithm is used for placement if the nodes in the network.
The input to this algorithm contains Number of Nodes and Distance between Nodes. The output contains the map of NodeID and Position of Node.
Algorithm
The pseudocode for initialization of nodes randomly is as follows
a. for i=0 to num_of_nodes b.Initialize mobile nodes c. Enable random motion d. Nodes Energy.
e. Define initial node position f. Initialize agent
g. Attach agent to node. h. End for
5. PERFORMANCE ANALYSIS
It is related with the object oriented approach and is called as a simulator that is being formulated with the VINT plan into the University named California situated in the Berkeley. It is principally primed so as to be practiced in the area with regards to the networking learning region. A simulator is quite obvious that this tool works upon the non-factual-instant layout. It makes use of the forms of the C++, the TCL plus the Object TCL cases as the intermediation while letting the files of the input in expressing the model for the purpose of recreating it.
Data Gathering Technique
© 2017, IRJET | Impact Factor value: 5.181 | ISO 9001:2008 Certified Journal | Page 3036
To hold the images and the location of the crisis area theVSNs make the grouping of the such details so as to intimate the target end with the solution and come up with deterrent outcomes. Hence this conception of assemblage is incorporated in the formulated plan.
Performance Matrices
Energy
Energy is the scarcest asset of WSN hubs, and it decides the lifetime of WSNs.
Energy = Initial Energy-Final Energy
Throughput
Throughput is the limit of connection or system to pass information effectively. Measure of information exchanged over a given timeframe. So if more information exchanged higher throughput.
Transmission Time = File size/Bandwidth(sec) Throughput = File size/Transmission Time(bps)
Overhead
Overhead is any blend of overabundance or round about calculation time, memory, bandwidth, or different assets that are required to play out a particular undertaking.
End-to-End Delay
End-to-end postpone alludes to the time taken for a bundle to be transmitted over a system from source to goal. Delay=Receiving time-Sending time
Packet Delivery Ratio
The quantity of parcels effectively got to the aggregate number of bundles sent by the sender.
Packet Delivery Ratio=Received Packets/Generated Packets*100
[image:4.595.314.562.133.279.2]5.1 Results and Discussion
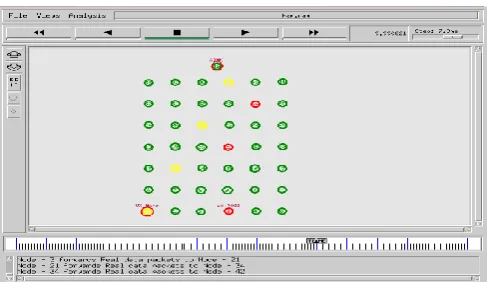
Figure 3: Communication among nodes
[image:4.595.317.561.349.490.2]After positioning the nodes are conversing plus the expanse involving nodes is one and the same.
Figure 4: Selecting Relay nodes
Relay nodes are neighbor nodes, which selected for taking the shortest path for sending data to the destination.
Figure 5: Selecting Shortest path for sending packets
For better improvements in the performance parameters we selecting shortest path for sending data.
Figure 6: Sending packets
[image:4.595.316.560.557.698.2]© 2017, IRJET | Impact Factor value: 5.181 | ISO 9001:2008 Certified Journal | Page 3037
shade is shady green. The starting place node shade is [image:5.595.316.563.101.251.2]yellow with smoothed and the sink or target node paint is green as well as smoothed, the path upon which statistics is sent is yellow paint nodes. The red shade nodes are a sign of an added path.
Figure 7: Simulation time Vs Average residual energy
[image:5.595.35.282.169.309.2]The figure 23 shows that as the replication time amplifies the nodes used up more and more force. This is noticeable fact in any association. But in this application, the liveliness is unbiased on behalf of midway quantity of time. As time reaches to elevated worth (180), force of the nodes initiates to getting zero. Thus, packet pace has to be inadequate to put off this experience.
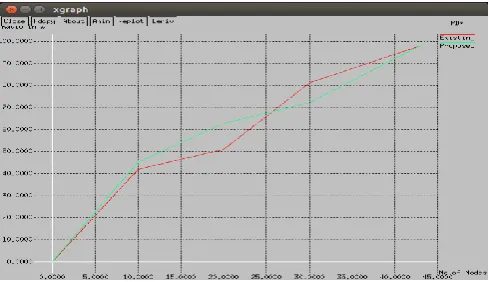
Figure 8: Simulation time Vs Throughput
[image:5.595.316.561.342.489.2]As the throughput is an undeviating utility of Pdr, mutually taken as a whole throughput plus acknowledged packet enlarges with time. But as recreation time is privileged, customary throughput get nearer. This is for the reason that scores of nodes looses liveliness with time which fallouts in numerous packets go down.
Figure 9: Simulation time Vs Delay
[image:5.595.37.283.437.589.2]For the duration of transitional point of recreation, pace of diffusion is exceedingly lofty, which consequences in elevated holdup. As packet pace gets ready then the stoppage is also inundated.
Figure 10: Simulation time Vs overhead
For the period of imitation, if any other procedures like memory, bandwidth or other supplies that are essential to act upon a explicit assignment then the transparency is elevated.
[image:5.595.316.561.580.721.2]© 2017, IRJET | Impact Factor value: 5.181 | ISO 9001:2008 Certified Journal | Page 3038
Packet deliverance share rises with time. Once theassociation fabricates the positions of nodes as well as courses, statistics conduction becomes 100%. Thus, the wished-for devise is confirmed.
6. CONCLUSION
There is one of the major dilemmas in the VSNs related to the utilization of the energy that are unequal which results in the diminishing in the life-span of the network. To achieve solution to this issue, at the start a conduit as well as the representation for routing named as the Rayleigh fading plus the undeviating pathway respectively, has been well thought-out to optimize the existence of the network with making restrictive the difficulty of energy gap. When this was examined the consequences from this examination proved that the amount of the SNs plus the RNs as well as locations have reached in restraining the trouble of the power gap plus has optimized the duration of a network. This gave apt results with organizing the locality-wise format via the nodes that are mixed and also produces impartial power utilization. The outcomes that were attained when applied for replication gave that this work doesn’t compromise when taken into account the working aspects like the throughput plus the stoppage in uninterrupted plans. The stratagem linked to the exploitation in forthcoming days can be formed in still more sensible way with regards to the 3D format. In addition to this, when concerned to the solidity the crisis associated with the defense can be made superior in support of transference of the specifics.
REFERENCES
[1] S. Soro, and W. Heinzelman, “A Survey of Visual Sensor Networks,” Advances in Multimedia, vol. 2009, no. 21,pp.1-21, 2009.
[2] Y. Ye, S. Ci, A. K. Katsaggelos, Y. Liu, and Y. Qian, “Wireless Video Surveillance: A Survey, ” IEEE Access,vol.1, pp. 646-660, 2013.
[3] Y. Durmus, A. Ozgovde, and C. Ersoy, “Distributed and Online Fair Resource Management in Video Surveillance vol. 11, no. 5, pp. 835-848, 2012.Sensor Networks,” IEEE Trans. on Mobile Computing, [4] M. Magno, D. Boyle, D. Brunelli, E. Popovici, and L.
Benini, “Ensuring Survivability of Resource Intensive Sensor Networks Through Ultra- Low Power Overlays,” IEEE Trans. on Industrial Informatics, vol. 10, no. 2, pp. 946-956, 2014.
[5] S. Cosar, and M. Cetin, “Feature Compression: A Framework for Multi- View Multi-Person Tracking in Visual Sensor Networks,” J. of Visual Communication 2014.and Image Representation, vol. 25, no. 5, pp. 864 873,
[6] I. F. Akyildiz, T. Melodia, and K. R. Chowdhury, “A Survey on Wireless Multimedia Sensor Networks,” Computer Networks, vol. 51, no. 4, pp. 921-960, 2007. [7] H. Li, V. Pandit, and D. P. Agrawal, “Gaussian Distributed Deploymentof Relay Nodes for Wireless Visual Sensor Networks,” Proc. of IEEE Global Communications Conference (GLOBECOM), pp. 5374-5379, 2012.
[8] Y. Charfi, N. Wakamiya, and M. Murata, “Challenging Issues in Visual Sensor Networks,” IEEE Wireless Communications, vol. 16, no. 2, pp. 44-49, 2009.
[10] [10] M. Casares, and S. Velipasalar, “Adaptive Methodologies for Energy- Efficient Object Detection and Tracking With Battery-Powered Embedded Smart Cameras,” IEEE Trans. on Circuits and Systems for Video Technology, vol. 21, no. 10, pp. 1438–1452, 2011.
[11] [11] B. Dieber, C. Micheloni, and B. Rinner, “Resource-Aware Coverage and Task Assignment in Visual Sensor Networks,” IEEE Trans. on Circuits and Systems for Video Technology, vol. 21, no. 10, pp. 1424-1437, 2011.
[12] S. Soro, and W. Heinzelman, “Camera Selection in Visual Sensor Networks,” Proc. of Int’l Conf. on Advanced Video and Signal Based Surveillance, pp. 81-86, 2007.
[13] S. Halder, and A. Ghosal, “Enhancing the Lifespan of Visual Sensor Networks using a Predetermined Node Deployment Strategy,” Proc. Of 19th IEEE Int’l Symposium