SPRING BUDGET 2017
SPRING BUDGET 2017
Return to an order of the House of Commons
dated 8 March 2017
Copy of the Budget Report – March 2017 as
laid before the House of Commons by the
Chancellor of the Exchequer when opening
the Budget.
Jane Ellison
Her Majesty’s Treasury
8 March 2017
Ordered by the House of Commons to be
printed 8 March 2017
© Crown copyright 2017
This publication is licensed under the terms of the Open Government Licence v3.0 except where otherwise stated. To view this licence, visit nationalarchives.gov.uk/doc/open-government-licence/version/3 or write to the Information Policy Team, The National Archives, Kew, London TW9 4DU, or email: [email protected].
Where we have identified any third party copyright information you will need to obtain permission from the copyright holders concerned. This publication is available at www.gov.uk/government/publications Any enquiries regarding this publication should be sent to us at [email protected]
Print ISBN 9781474140973 Web ISBN 9781474140980 ID 13021711 03/17 PU2044
Printed on paper containing 75% recycled fibre content minimum
Printed in the UK by the Williams Lea Group on behalf of the Controller of Her Majesty’s Stationery Office
Contents
Page
Executive Summary 1
Budget Report
Chapter 1 Economy and public finances 7
Economic context 7
Outlook for the public finances 13
Chapter 2 Policy decisions 25
Chapter 3 Tax 31
Chapter 4 Productivity 39
Chapter 5 Public services and markets 47
Annex A Financing 51
Office for Budget Responsibility: Budget forecast
Annex B Office for Budget Responsibility’s Economic and fiscal
outlook: selected tables 55
List of abbreviations 63
List of tables 64
Executive summary
As the UK begins the formal process of exiting the European Union, the Spring Budget puts
economic stability first. Following a period of robust economic growth, record levels of employment and a falling deficit, it sets out further progress in restoring the public finances to health. Building on the Industrial Strategy, it goes further in tackling the UK’s productivity challenge.
The Budget sets out actions the government will take to:
•
help young people from ordinary working families across the country get the skills they need to do the high-paid, high-skilled jobs of the future, vital for a competitive workforce•
give more children the chance to go to a good or outstanding school that sets them up to succeed•
support the social care system with substantial additional funding, so people get the care they deserve as they grow older, and support both local NHS plans and improvements to Accident and Emergency with new capital investment•
invest in cutting-edge technology and innovation, so Britain continues to be at the forefront of the global technology revolution•
continue to bring down the deficit so the UK gets back to living within its means, and can fund public services for the long-term through a fair and sustainable tax systemBy investing in the future, the Budget helps make the most of the opportunities ahead by laying the foundations of a stronger, fairer, better Britain – a country that works for everyone.
The Spring Budget also marks the transition to a single fiscal event each year, an autumn Budget.
Economic context
Continuing the trend of robust economic growth across much of the year, real GDP grew by 0.7% in the final quarter of 2016. GDP grew by 1.8% over the year as a whole, and employment reached a new record high.
The OBR expects the level of GDP in 2021 to be broadly the same as it forecast at Autumn Statement 2016, although the profile of growth has changed. The OBR now forecasts GDP growth of 2.0% in 2017, 1.6% in 2018, and then 1.7% in 2019, 1.9% in 2020 and 2.0% in 2021. Household and business spending have been stronger to date than forecast in November. The fall in sterling over the course of 2016 is expected to push inflation to 2.4% in 2017 and 2.3% in 2018, before falling back to 2.0% in 2019. As a result, the OBR expects the pace of consumer spending to slow. It also forecasts private investment to remain subdued.
Outlook for the public finances
These rules take a balanced approach, combining the flexibility to support the economy if necessary in the near term, and the commitment to return the public finances to a sustainable position in the long term.
The government remains on course to meet its fiscal rules, with borrowing lower in every year compared to Autumn Statement 2016. While stronger economic activity in the near term, timing effects and other one-off factors significantly reduce borrowing in 2016-17, the medium-term outlook for the public finances is essentially unchanged since Autumn Statement 2016. The OBR expects that borrowing will fall to 0.7% of GDP by 2021-22, which is forecast to be the lowest level as a share of GDP in two decades. Debt is expected to peak at 88.8% of GDP in 2017-18, before falling to 79.8% of GDP in 2021-22.
To achieve this, and to ensure the UK lives within its means, the government will maintain discipline on public spending. New discretionary commitments made in the Budget are funded over the forecast period. This responsible approach to setting fiscal policy improves the sustainability of the public finances and provides certainty and security to businesses and households.
A fair and sustainable tax system
The tax system needs to be fair and sustainable in order to support critical public services. It also needs to be competitive, to support economic growth and maintain the UK as one of the best places in the world to set up and grow a business. These principles are reflected in the government’s increases to the personal allowance and higher rate threshold, reductions in the rate of corporation tax to 17% by 2020, and significant steps taken since 2010 to tackle tax avoidance and evasion. The Budget takes further steps in line with this:
•
the main rate of Class 4 National Insurance contributions will increase from 9% to 10% in April 2018 and to 11% in April 2019 to reduce the gap in rates paid by the self-employed and employees, and to reflect the introduction of the new State Pension to which the self-employed have the same access•
the dividend allowance will be reduced from £5,000 to £2,000 from April 2018, to reduce the tax differential between the self-employed and employed, and those working through a company, to raise revenue to invest in public services, and to ensure that support for investors is more effectively targetedRaising productivity and living standards
The government is committed to raising living standards. It has taken action to help more people into work and to enable individuals to keep more of what they earn. The personal allowance will rise to £11,500 next month, over 75% higher than in 2010. This will take 1.3 million people out of income tax altogether, compared to the beginning of this Parliament.
Raising productivity – the amount of output per hour worked – is the only sustainable way to raise living standards for people across the UK.
The Budget focuses on creating a highly-skilled workforce. This is the next step in the government’s strategy to improve productivity, building on the recently published Industrial Strategy green paper. Not only will it provide UK businesses with the highly-skilled workers they need to succeed in global markets, it will enhance the options for young adults who want to pursue a technical education. Specifically, the Budget announces policies to:
•
transform technical education for 16-19 year olds, creating sector-specific routes to•
fund maintenance loans for students pursuing technical education at higher levels, opening up the same opportunities available to those studying on the academic route•
expand the free schools programme, to give more parents the choice of a good school for their child, and commit an additional £216 million investment in school maintenanceThe Budget’s focus on skills builds on over £23 billion of additional high-value investment committed at Autumn Statement 2016, through the National Productivity Investment Fund (NPIF). Together, these investments will help build a UK economy supported by world-class infrastructure and world-class talent.
The Budget takes the next steps in delivering the government’s Industrial Strategy by setting out the initial actions being supported by NPIF investment:
•
creating a new National 5G Innovation Network to trial and demonstrate 5G applications, and this year starting to roll out a series of local projects to accelerate market delivery of fast and reliable full-fibre broadband•
competitively allocating £690 million to local authorities to get local transport networks moving•
putting the UK at the forefront of global technological progress including through developing artificial intelligence and robotics, and batteries for the next generation of electric vehicles•
investing £300 million to further develop the UK’s research talent, including through creating an additional 1,000 PhD placesBuilding an economy that works for everyone
The government is committed to building an economy that works for everyone. Alongside policies to boost productivity and living standards over the long term, including by investing in skills and schools, the government is taking action to reduce living costs for families in the short term. The government will shortly be rolling out Tax-Free Childcare for working families with children under 12, providing up to £2,000 a year for each child to help with childcare costs. From September 2017, the free childcare offer will double, from 15 to 30 hours a week for working families with 3 and 4 year olds in England, in total worth up to £5,000 for each child.
The Budget takes further steps to improve the services people care most about, providing more support for health and social care. Building on the short-term actions taken in December 2016, the government will provide £2 billion additional funding for social care to councils in England between 2017-18 and 2019-20, to help ensure people receive the social care support they need and to reduce pressure on the NHS. It will also invest a further £425 million to improve local NHS services and support Accident and Emergency improvement. The government will also set out proposals in a green paper to put the social care system on a more secure and sustainable long-term footing.
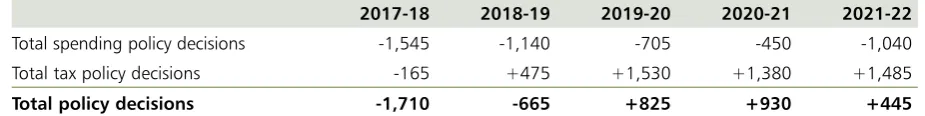
Budget decisions
[image:7.595.65.528.716.774.2]A summary of the fiscal impact of Budget policy decisions is set out in Table 1. Chapter 2 provides further information on the fiscal impact of the Budget.
Table 1: Spring Budget 2017 policy decisions (£ million)1
2017-18 2018-19 2019-20 2020-21 2021-22
Total spending policy decisions -1,545 -1,140 -705 -450 -1,040
Total tax policy decisions -165 +475 +1,530 +1,380 +1,485
Total policy decisions -1,710 -665 +825 +930 +445
Government spending and revenue
Chart 1 shows public spending by main function. Total Managed Expenditure is expected to be around £802 billion in 2017-18.
Chart 1: Public sector spending 2017-18
Sources: Office for Budget Responsibility 2017-18 estimates. Illustrative allocations to functions are based on HMT analysis including capital consumption figures from the Office for National Statistics. Figures may not sum due to rounding.
Social protection £245bn
Personal social services £32bn
Health £149bn Transport £37bn
Education £102bn Defence £48bn Industry, agriculture and employment £23bn Housing and environment £36bn
Public order and safety £34bn Other including EU transactions £50bn
Debt interest £46bn
Chart 2 shows the different sources of government revenue. Public sector current receipts are expected to be around £744 billion in 2017-18.
Chart 2: Public sector receipts 2017-18
Source: Office for Budget Responsibility, 2017-18 forecast. Figures may not sum due to rounding.
Other (taxes) includes capital taxes, stamp duties, vehicle excise duties and other smaller tax receipts. Other (non-taxes) includes interest and dividends, gross operating surplus and other smaller non-tax receipts.
Income tax £175bn
National Insurance £130bn
Excise duties £48bn Corporation tax £52bn
VAT £143bn Business rates £30bn
Council tax £32bn
Other (non-taxes) £54bn
1
Economy and public
finances
Economic context
1.1 Data released since Autumn Statement 2016 have provided further evidence of the
fundamental strength and resilience of the UK economy.1 Real Gross Domestic Product (GDP) is now 8.6% larger than its pre-financial crisis peak in early 2008, and employment is at a record high. It is from this position of strength that the UK enters into a period of negotiation with its European partners.
1.2 The Office for Budget Responsibility (OBR) judges that, in large part, the outlook for the UK economy has not changed since Autumn Statement 2016. The forecast for the level of GDP at the end of 2021 is broadly unchanged, although the expected path of growth has been revised slightly. The OBR continues to judge that growth will moderate during 2017, largely due to a slowdown in consumer demand growth as rising inflation, resulting from sterling’s depreciation, weighs on real incomes. Business investment is also expected to remain subdued due to
economic uncertainty as the UK negotiates its departure from the EU. The OBR has not revised its judgement of the medium-term effect of leaving the EU on the UK economy.
UK economy
Growth
1.3 The Office for National Statistics (ONS) estimates that the economy grew 1.8% in real terms in 2016, second only to Germany among major advanced economies. Growth remained robust in the second half of the year, at 0.6% in Q3 and 0.7% in Q4 2016, stronger than the OBR anticipated at Autumn Statement 2016. On a per capita basis, UK GDP increased 1.1% in 2016.
1.4 All major sectors of the economy made a positive contribution to growth in 2016, with services output increasing 2.9%, construction 1.5% and production 1.2%. Private business surveys suggest that all sectors have continued to expand in the early months of 2017.
1.5 Household consumption accounted for 65% of GDP in 2016 and growth has remained strong, increasing to 3.0% last year. Consumer confidence is near its long-run average and borrowing costs are low, which appear to have supported consumer spending.
1.6 While consumption growth has been robust in recent years, this has not been accompanied by a sharp increase in debt. Total household debt as a proportion of disposable income in Q3 2016 was 10% below the peak reached in Q1 2008. Within this unsecured debt as a proportion of disposable income rose over the year to Q3 2016, but remained 8% below the peak reached in Q1 2007. Consumer credit funded less than a tenth of the growth in consumption over 2016. Household saving as a proportion of disposable income declined gradually over the two years to Q2 2016, before falling more sharply to 5.6% in Q3 2016.
1.7 Business investment fell 1.0% in Q4 2016, following a modest increase of 0.7% in Q3 2016. This resulted in a 1.5% decline in business investment in 2016. Private business surveys cited uncertainty about future demand and the outcome of the EU negotiations as weighing on activity and investment.
1.8 The UK has run a deficit on trade in goods and services for almost twenty years. This continued in 2016, and at 1.9% of GDP was in line with its average since 2010. Within this, the trade in goods deficit widened to 7.0% of GDP, but was partially offset by a larger surplus of 5.1% of GDP on trade in services. A range of private business surveys report that export orders are increasing due to increases in global demand as well as the fall in the value of sterling since mid-2016.
1.9 The current account deficit remains large by international and historical standards, widening to 4.9% of GDP in the first three quarters of 2016. The primary income balance has driven the larger current account deficit in recent years, due to the relatively lower return on assets held overseas by UK investors, and this deficit remained high at 1.6% of GDP in the first three quarters of 2016.
Prices
1.10 Inflation has risen in recent months, with the 12-month increase in the Consumer Prices Index (CPI) reaching 1.8% in January 2017. This has been driven by global oil price rises, amplified by the post-referendum depreciation of sterling, which have led to increases in the contribution of the transport component of CPI inflation. Past decreases in food and fuel prices have dropped out of the annual comparison, further pushing up on inflation. Services inflation has been broadly stable over the last year and remains below its long-run average.
Labour market
1.11 The labour market has remained robust in recent months. The employment rate reached a new record high of 74.6% in the three months to December 2016, while the unemployment rate was 4.8%, the lowest in 11 years. The increase in employment over the past year was primarily driven by a rise in full-time employment, which accounted for 72% of employment growth in 2016.
1.12 UK labour productivity growth was subdued in 2016, continuing to reflect the trends observed in most advanced economies since the financial crisis. Output per hour increased 0.4% in Q4 2016, in line with the average quarterly growth across the year as a whole. Raising productivity growth sustainably remains the central long-term economic challenge facing the UK.
1.13 Earnings growth has been stable in recent months. Both total pay and regular pay
(excluding bonuses) rose 2.6% in the three months to December 2016 compared with the same period a year earlier.
1.14 Real household disposable income (RHDI) per head rose sharply from the end of 2014, and in 2015 recorded its fastest annual growth in 14 years. RHDI per head rose further in the first half of 2016, reaching its highest ever level, and remained close to this level in Q3 2016 as the pick-up in inflation constrained further real income growth.
Global economy
1.16 Global growth remained broadly stable in the second half of 2016, although performance has varied across economies. Momentum has been sustained in advanced economies: euro area growth, which has picked up in recent years, remained steady in the second half of the year, to give annual growth of 1.7%; US activity rebounded after a slower start to last year, with annual growth of 1.6%. Performance in emerging economies was mixed: the Chinese and Indian economies grew 6.7% and 6.6% respectively in 2016, while the Brazilian and Russian economies both contracted.
1.17 The International Monetary Fund forecasts that global growth will increase slightly to 3.4% in 2017. It judges that the outlook has improved in advanced economies, where growth in the second half of 2016 exceeded its earlier forecasts, while growth prospects have marginally worsened in emerging economies. Uncertainty around the global outlook is heightened at present, associated, among other things, with policy and political risks.
Economic outlook
1.18 The OBR’s Spring Budget 2017 forecast for the level of GDP at the end of 2021 is broadly unchanged from Autumn Statement 2016, although the expected profile of growth has been revised. The OBR now forecasts stronger GDP growth in 2017 than previously expected, as a result of stronger economic data over the past few months; in particular, consumption growth has been stronger than anticipated. However, in the near term, rising inflation, largely caused by the post-referendum sterling depreciation, is expected to weigh on household consumption growth. The OBR also continues to judge that business investment will be constrained due to economic uncertainty over the next few years. These effects combine to give a shallower, but slightly longer period of slower growth. Over the medium term, the OBR has not materially changed its main judgements about the economic outlook and its expectation for potential output growth over the next five years is therefore unchanged.
Chart 1.1: UK real GDP level
Source: Office for National Statistics and Office for Budget Responsibility.
GDP level (indexed, Q1 2010 = 100)
95 100 105 110 115 120 125 130
2010 2013 2016 2019 2022
Autumn Statement 2016
1.19 In the longer term, the economy will adjust to new relationships with the EU and the rest of the world. In producing the forecast, the OBR has not attempted to predict the precise outcome of negotiations, nor the breadth and depth of new relationships that may be negotiated bilaterally with the EU or other trading partners. Instead, its assumptions on the effects of leaving the EU on trade, unchanged from those which underpinned the Autumn Statement 2016 forecast, are in line with a range of external studies. The OBR notes that there is a higher than usual degree of uncertainty in this forecast.
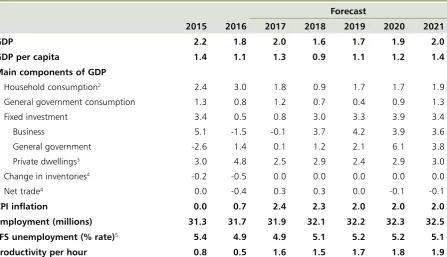
Table 1.1: Summary of the OBR’s central economic forecast1 (Percentage change on a year earlier, unless
otherwise stated)
Forecast
2015 2016 2017 2018 2019 2020 2021
GDP 2.2 1.8 2.0 1.6 1.7 1.9 2.0
GDP per capita 1.4 1.1 1.3 0.9 1.1 1.2 1.4
Main components of GDP
Household consumption2 2.4 3.0 1.8 0.9 1.7 1.7 1.9
General government consumption 1.3 0.8 1.2 0.7 0.4 0.9 1.3
Fixed investment 3.4 0.5 0.8 3.0 3.3 3.9 3.4
Business 5.1 -1.5 -0.1 3.7 4.2 3.9 3.6
General government -2.6 1.4 0.1 1.2 2.1 6.1 3.8
Private dwellings3 3.0 4.8 2.5 2.9 2.4 2.9 3.0
Change in inventories4 -0.2 -0.5 0.0 0.0 0.0 0.0 0.0
Net trade4 0.0 -0.4 0.3 0.3 0.0 -0.1 -0.1
CPI inflation 0.0 0.7 2.4 2.3 2.0 2.0 2.0
Employment (millions) 31.3 31.7 31.9 32.1 32.2 32.3 32.5
LFS unemployment (% rate)5 5.4 4.9 4.9 5.1 5.2 5.2 5.1
Productivity per hour 0.8 0.5 1.6 1.5 1.7 1.8 1.9
1 All figures in this table are rounded to the nearest decimal place. This is not intended to convey a degree of unwarranted accuracy. Components may not sum to total due to rounding and the statistical discrepancy.
2 Includes households and non-profit institutions serving households. 3 Includes transfer costs of non-produced assets.
4 Contribution to GDP growth, percentage points. 5 Labour Force Survey.
Source: Office for National Statistics and Office for Budget Responsibility.
Growth
1.20 With higher than expected growth in Q4 2016 and stronger near-term momentum in the economy, the OBR has revised up its forecast for GDP growth in 2017 by 0.6 percentage points to 2.0%. Thereafter there is a shallower slowdown and a more gradual recovery, with growth revised down to 1.6% in 2018, 1.7% in 2019, and 1.9% in 2020, followed by an unchanged forecast of 2.0% growth in 2021.
1.21 The upward revision to 2017 GDP growth is due in large part to an increase in the expected path of household consumption, which was stronger than anticipated in recent months. However, consumption growth is expected to slow over the year, as the
1.22 The OBR expects a further reduction in the saving ratio to support consumer spending in the near term, as rising inflation weighs on household budgets, before it stabilises during 2017. The OBR forecasts household saving of 4.6% of disposable income in 2017, followed by gradual increases to 5.2% in 2018, 5.4% in 2019, 5.8% in 2020 and 5.9% in 2021.
1.23 Household debt as a proportion of income is forecast to remain below pre-financial crisis levels, but to increase gradually over the forecast period, reaching 153% in 2021. This is higher than at Autumn Statement 2016, due to a small upward revision to the stock of household debt and a downward revision to household disposable income. Average house prices are forecast to increase at an average annual rate of 4.8%; this contributes to expected increases in household net wealth, which is forecast to reach 879% of household income in 2021.
1.24 Small upward revisions to the OBR’s near-term forecast for business investment, based on stronger than expected growth in Q3 2016, also contribute to the improved outlook for GDP growth in 2017. The OBR now judges that the effect of uncertainty on investment will be less severe but more drawn out than previously assumed, leading to downward revisions to investment growth in the later years of the forecast. The OBR forecasts a 0.1% fall in business investment in 2017, before uncertainty begins to dissipate and business investment starts to recover, picking up to 3.7% in 2018, 4.2% in 2019, 3.9% in 2020 and 3.6% in 2021.
1.25 Net trade is forecast to make a positive contribution of 0.3 percentage points to GDP growth in 2017 and 2018, as the post-referendum sterling depreciation is expected to
support exports and reduce imports in the short term. Thereafter, the trade forecast is broadly unchanged from Autumn Statement 2016, as the OBR has not revised its judgement, based on a range of external studies, of the effect of leaving the EU on UK trade.
1.26 The OBR forecasts that the current account deficit will narrow, to 3.5% of GDP in 2017, 3.2% of GDP in 2018, 2.6% of GDP in 2019, 2.2% of GDP in 2020 and 2.0% of GDP in 2021. This is largely driven by an improvement in the primary income balance as the net rate of return on the UK’s stock of foreign assets normalises and the depreciation of sterling increases the value of the income earned on those assets.
1.27 The outlook for potential output growth is unchanged since Autumn Statement 2016. The OBR continues to judge that the subdued path of business investment, which is likely to remain constrained due to economic uncertainty, will in turn weigh on productivity in the medium term.
Prices
1.28 The OBR forecasts that CPI inflation will increase to 2.4% in 2017 before falling back to 2.3% in 2018 and 2.0% from 2019 to 2021. Sterling has appreciated 3.3% on a trade-weighted basis since the beginning of November 2016, but remains 11.9% below its level of early June 2016, while global oil prices have increased 16.3% since the beginning of November. The two effects broadly counterbalance each other. Combined with the OBR’s judgement on the effect of policy measures, this means that inflation is expected to be slightly higher in the near term and slightly lower in later years than forecast at Autumn Statement 2016.
Labour market
1.30 The OBR forecasts that productivity growth will be 1.6% in 2017, 1.5% in 2018, 1.7% in 2019, 1.8% in 2020 and 1.9% in 2021. This is largely unchanged relative to the Autumn Statement 2016 forecast. The OBR has not revised its judgement on trend productivity growth, and continues to emphasise that this is the most important and most uncertain judgement in its economic forecast.
1.31 The OBR’s forecast for earnings growth is little changed in the near term, but has been revised down slightly in later years, largely reflecting small revisions to expected inflation and productivity growth. The OBR anticipates average earnings growth of 2.6% in 2017 and 2.7% in 2018, followed by annual growth at or above 3.0% through to 2021. Earnings growth is an important determinant of the OBR’s forecast for the public finances.
Chart 1.2: Unemployment rate
Source: Office for National Statistics and Office for Budget Responsibility.
% of labour force
4 5 6 7 8 9
2005 2007 2009 2011 2013 2015 2017 2019 2021
Autumn Statement 2016
forecast Spring Budget 2017forecast
Outturn
1.32 Following strong gains in recent years, higher inflation is expected to weigh on RHDI per head in 2017 before growth resumes later in the forecast. The OBR forecast a fall of 0.7% in 2017, as the recent sterling depreciation raises inflation while nominal earnings growth increases slightly. The OBR expects that RHDI per head will return to growth in 2018 with a 0.1% increase, and then pick up to 0.4% in 2019, 1.0% in 2020 and 1.2% in 2021. By the end of the forecast period RHDI per head is expected to be 2.0% above its 2016 level.
Monetary policy
1.33 The Monetary Policy Committee of the Bank of England has full operational independence to set monetary policy to meet the inflation target. Monetary policy is a critical element of the UK’s macroeconomic framework, responsible for maintaining price stability and supporting the economy.
Outlook for the public finances
1.35 Since 2010, the government has made good progress in restoring the public finances to health. The deficit is now forecast to have been cut by almost three-quarters from its post-war peak of 9.9% of GDP in 2009-10 to 2.6% in 2016-17, a level not seen since before the 2008 financial crisis.2 Nevertheless, both borrowing and debt remain too high. And the combination of the need to improve productivity and an ageing population poses a challenge for the public finances in the long run.
1.36 The government’s new fiscal rules, approved by Parliament in January, commit to returning the public finances to balance at the earliest possible date in the next Parliament.3 In the
interim, the government is committed to reducing the cyclically-adjusted deficit below 2% of GDP and putting debt on a downward path by 2020-21. These rules take a balanced approach, combining the flexibility to support the economy, if necessary, in the near term, with the
commitment to return the public finances to a sustainable position in the long term.
1.37 The OBR judges that the government remains on track to meet its interim targets two years early.4 Underscoring its commitment to fiscal discipline, new discretionary policy decisions announced at the Budget are funded over the forecast period. This responsible approach to setting fiscal policy underpins the sustainability of the public finances and provides certainty and security to businesses and households.
The fiscal outlook
1.38 Public sector receipts have proven resilient since Autumn Statement 2016. Total receipts in 2016-17 are expected to significantly outperform the Autumn Statement 2016 forecast, especially corporation tax, income tax and Capital Gains Tax. The OBR attributes this to a combination of economic activity being stronger than expected in the short term, a structural improvement in some taxes, and timing effects and one-off factors, including higher forestalling of dividend income.
1.39 However, the OBR’s medium-term economic outlook is largely unchanged from the autumn and earnings growth and consumption growth are expected to be slightly weaker than in November. This means that much of this near-term strength in receipts does not carry through to the later years of the forecast. Therefore the OBR expects total revenues in 2021-22 to be close to those forecast at Autumn Statement 2016.
1.40 Public spending is significantly lower in 2016-17 than forecast at Autumn Statement 2016, but broadly unchanged by the end of the forecast period. Lower spending in the near term reflects increased forecast underspending by departments, as well as a one-off change in the timing of EU contributions that moves some spending from 2016-17 into 2017-18. Upward revisions to spending in later years result from a combination of higher debt interest and local authority spending. Costs associated with changes to the personal injury discount rate also increase borrowing in every year.
1.41 The OBR notes that the action taken by the Department for Work and Pensions (DWP) to clarify Personal Independence Payment policy offsets most of the cost arising from recent legal judgments. These restore the government’s original policy intent.
2 ‘Public sector finances’, ONS, January 2017, and ‘Economic and fiscal outlook’, OBR, March 2017. 3 ‘Charter for Budget Responsibility: autumn 2016 update’, HM Treasury, January 2017.
1.42 Accounting changes reduce borrowing by £1.1 billion on average in every year relative to Autumn Statement 2016, with the biggest effect being a reduction of £3.0 billion in 2016-17. The most significant change is the completion of the move to an accruals-based recording of onshore corporation tax receipts, in line with the ONS’s updated methodology.5
Table 1.2: Changes to the OBR’s forecast for public sector net borrowing since Autumn Statement 2016 (£ billion)
2016-17 2017-18 2018-19 2019-20 2020-21 2021-22
Autumn Statement 2016 68.2 59.0 46.5 21.9 20.7 17.2
Total forecast changes since
Autumn Statement 20161 -16.4 -3.8 -7.5 -2.3 0.8 0.2
of which
Receipts forecast -7.5 -4.3 -4.6 -1.5 1.5 2.4
Spending forecast -6.0 1.5 -0.7 0.2 -1.5 -1.8
Accounting changes -3.0 -1.0 -2.2 -0.9 0.8 -0.4
Total effect of government decisions since
Autumn Statement 2016 0.0 3.1 1.8 1.7 -1.0 -0.6
Total changes since Autumn Statement 2016 -16.4 -0.7 -5.7 -0.6 -0.2 -0.4
Spring Budget 2017 51.7 58.3 40.8 21.4 20.6 16.8
1 Equivalent to lines from Table 1.3 of the March 2017 Economic and fiscal outlook; full references available in ‘Spring Budget 2017 data sources’. Source: Office for Budget Responsibility and HM Treasury calculations. Figures may not sum due to rounding.
1.43 Mirroring the revisions to the economic outlook, the net effect of these changes is that borrowing is expected to be lower in the near term but essentially unchanged from 2019-20 onwards. The OBR’s public sector net borrowing (PSNB) forecast is £0.4 billion lower in 2021-22 than was forecast at Autumn Statement 2016.
1.44 However, the combination of a stronger than expected economy in the near term, timing effects and one-off factors has significantly lowered the borrowing forecast for 2016-17 relative to other years. The deficit in 2016-17 is predicted to be £16.4 billion lower than had been forecast at Autumn Statement 2016. Over half of this reduction in borrowing results from a range of one-off factors, including changes to the timing of corporation tax receipts, dividend income brought forward ahead of forthcoming tax rises, changes to the timing of EU payments, and lower forecast spending by departments this year – a number of which serve to push up borrowing in 2017-18.
1.45 Borrowing is lower in every year of the forecast compared with Autumn Statement 2016 and expected to fall to £16.8 billion or 0.7% of GDP by 2021-22. This is forecast to be the lowest deficit as a share of GDP in two decades.6
5 ‘Improvements to accruals methodology for Corporation Tax, Bank Corporation Tax Surcharge and the Bank Levy’, ONS, February 2017.
6 ‘Public sector finances’, ONS, January 2017.
Table 1.3: Overview of the OBR’s borrowing forecast as a percentage of GDP
Estimate Forecast
2015-16 2016-17 2017-18 2018-19 2019-20 2020-21 2021-22
Public sector net borrowing 3.8 2.6 2.9 1.9 1.0 0.9 0.7
Cyclically-adjusted public sector net
borrowing 3.6 2.6 2.9 1.9 0.9 0.9 0.7
Treaty deficit1 4.0 2.7 2.8 1.9 1.1 0.9 0.9
Memo: Output gap2 -0.2 0.1 0.1 -0.1 -0.1 -0.1 0.0
Memo: Total policy decisions3 -0.1 0.0 0.0 0.0 0.0
1 General government net borrowing on a Maastricht basis. 2 Output gap measured as a percentage of potential GDP. 3 Equivalent to the ‘Total policy decisions’ line in Table 2.1.
[image:17.595.73.524.588.704.2]1.46 Debt as a percentage of GDP is also lower in every year than forecast at Autumn Statement 2016. Lower borrowing reduces cash debt in each year of the forecast compared to Autumn Statement 2016, although in 2016-17 this is offset by slightly faster take-up of the Bank of England’s Term Funding Scheme. Slightly higher nominal GDP in the near term also reduces the debt-to-GDP ratio. As a result, the OBR now forecasts that public sector net debt (PSND) will peak at 88.8% of GDP in 2017-18, before falling each year thereafter to 79.8% of GDP in 2021-22.
Table 1.4: Overview of the OBR’s debt forecast as a percentage of GDP
Estimate Forecast
2015-16 2016-17 2017-18 2018-19 2019-20 2020-21 2021-22
Public sector net debt1 83.6 86.6 88.8 88.5 86.9 83.0 79.8
Public sector net debt ex Bank of
England1 81.4 80.9 81.1 81.0 79.7 78.2 77.0
Public sector net financial liabilities2 76.4 75.8 76.1 75.0 72.8 70.4 67.7
Treaty debt3 87.6 87.5 87.7 87.7 86.5 84.8 83.6
1 Debt at end of March; GDP centred on end of March.
2 Public sector net financial liabilities at end of March, GDP centred on end of March; outturn for 2015-16 is an experimental ONS statistic. 3 General government gross debt on a Maastricht basis.
Source: Office for National Statistics and Office for Budget Responsibility.
Box 1.A: The long-term fiscal outlook
Over the next Parliament and beyond, the public finances will continue to be influenced by demographic trends, such as the retirement of the large baby-boomer cohort and increasing life-expectancy. The OBR’s recent ‘Fiscal sustainability report’ projects that these demographic trends will drive increased spending in age-related areas such as health, long-term care and the state pension, if policy remains unchanged.7 The OBR projects that factors such as the rising prevalence of chronic health conditions and technological advancements will place further upward pressure on health spending. Spending on the State Pension will rise from 5.0% of GDP in 2021-22 to 7.1% of GDP by 2066-67. However, the same demographic and economic trends will leave revenues broadly stable. Without changes to policy, these pressures would therefore put public sector debt on an unsustainable upward trajectory, almost tripling as a share of GDP over the next 50 years.
The government’s capacity to meet the needs of an ageing population depends crucially on the productive potential of the economy. Productivity is currently 30% higher in the United States and 35% higher in Germany than in the UK.8 At Autumn Statement 2016 the government took further action to address the longstanding need to improve productivity, including through a new National Productivity Investment Fund (NPIF) to support high value investment in innovation, infrastructure, and housing. The Budget focuses on improving skills, in order to boost productivity and living standards over the long term.
78
7 ‘Fiscal sustainability report’, OBR, January 2017.
Performance against the fiscal rules
The fiscal mandate
1.47 The OBR’s ‘Economic and fiscal outlook’ assesses the government against the fiscal mandate. It demonstrates that the government remains on target to bring cyclically-adjusted borrowing below 2% of GDP by the end of this Parliament. The OBR predicts that this target will be met two years early, and that by 2020-21 cyclically-adjusted public sector net borrowing will be 0.9% of GDP. The government therefore remains on track to meet its fiscal mandate, with 1.1% of GDP or £26 billion headroom in 2020-21. Compared with Autumn Statement 2016, the OBR estimates the probability of the government meeting its fiscal mandate to be unchanged at 65%, based on historic forecast errors.
Chart 1.3: Cyclically-adjusted public sector net borrowing
Source: Office for Budget Responsibility.
% GDP
2009-10 2010-11 2011-12 2012-13 2013-14 2014-15 2015-16 2016-17 2017-18 2018-19 2019-20 2020-21 2021-22
Spring Budget 2017
forecast Autumn Statement 2016forecast Outturn
0 2 4 6 8 10
1.48 The government is committed to the 3.0% deficit target set out in the EU’s Stability and Growth Pact. The OBR’s latest forecast indicates that this target will be met in 2016-17, for the first time since 2007-08, and in every year thereafter.
The supplementary debt target
Chart 1.4: Public sector debt
¹ Outturn for 2015-16 is an OBR estimate with GDP based on the ONS 22 February 2017 GDP release. ² Experimental ONS statistic.
Source: Office for National Statistics and Office for Budget Responsibility.
% GDP
50 60 70 80 90 100
2009-10 2010-11 2011-12 2012-13 2013-14 2014-15 2015-16 2016-17 2017-18 2018-19 2019-20 2020-21 2021-22
PSND OBR forecast PSND outturn1
PSND ex BoE OBR forecast PSND ex BoE outturn1
PSNFL OBR forecast PSNFL outturn1,2
Box 1.B: Supplementary fiscal aggregates
Public sector net debt (PSND) is a well-established measure of the government’s debt burden. However, the majority of the increase in PSND as a percentage of GDP over 2016-17 and 2017-18 is due to the Bank of England’s Term Funding Scheme (TFS), which was announced in August 2016. Through the TFS, the Bank of England provides secured lending of central bank reserves backed by the full range of collateral as detailed in the Bank of England’s Sterling Monetary Framework.9 As PSND captures the liabilities of the TFS operations but does not fully capture the assets, these temporary actions are forecast to lead to an increase in debt over the next two years.10 The take-up of the TFS has been slightly faster than the OBR expected at Autumn Statement 2016, and this partly offsets the OBR’s lower borrowing forecast. The TFS will unwind from 2020-21 onwards, as loans are repaid.
At Autumn Statement 2016, the government asked the ONS to develop,11 and the OBR to forecast, these measures, to provide policymakers with two alternative views of the government’s fiscal position. These are:
•
PSND excluding the Bank of England (PSND ex BoE) – which excludes the assets and liabilities held on the Bank of England’s balance sheet from PSND•
Public Sector Net Financial Liabilities (PSNFL) – a broader fiscal aggregate which recognises all public sector financial assets and liabilities recorded in the national accountsPSND is forecast by the OBR to peak at 88.8% of GDP in 2017-18, partly as a result of the effects of the TFS, before falling from that point onwards. In contrast, PSND ex BoE is forecast to remain roughly flat at 81% of GDP until 2018-19. Similarly, PSNFL stabilises at 76% of GDP between 2015-16 and 2017-18. From 2018-19 onwards, both of these alternate measures of debt are expected to fall as a share of GDP.
Welfare cap
910111.51 Between 1980 and 2014 spending on working-age welfare trebled in real terms.12 The government remains committed to ensuring the welfare system is put on a sustainable footing. The welfare cap, designed to improve Parliamentary accountability of welfare spending, was reset at Autumn Statement 2016. The cap is based on the OBR’s forecast at Autumn Statement 2016 of the benefits and tax credits within its scope, and will apply to welfare spending in 2021-22.13
1.52 Performance against the cap will be formally assessed by the OBR in 2020-21; the cap will be breached if spending exceeds the cap plus a 3% margin at the point of assessment. In the interim years, progress towards the cap will be managed internally, based on the OBR’s monitoring of forecasts of welfare spending. The OBR’s forecast of the level of welfare spending against the cap is set out in its ‘Economic and fiscal outlook’, March 2017.
1.53 The OBR forecasts welfare spending to remain within the cap and margin set at Autumn Statement 2016. The government will deliver welfare savings already identified but has no plans to introduce further welfare savings in this Parliament beyond those already announced.
9 ‘Letter from the Chancellor of the Exchequer to the Governor of the Bank of England 04/08/2016’, HM Treasury, August 2016.
10 ‘Economic statistics classification article: statistical treatment of the Bank of England’s Term Funding Scheme in the UK national accounts and public sector finances’, ONS, October 2016.
11 ‘Autumn Statement: Supplementary fiscal aggregates: 2016’, ONS, October 2016. 12 ‘Benefit Caseload and Expenditure Tables’, DWP, 2016.
Public spending
1.54 With the deficit still too high, control of public spending and an ongoing drive to improve the efficiency of public bodies is vital.
1.55 As set out at Autumn Statement 2016, the government will meet the commitments on public spending set out for this Parliament including commitments to priority public services, to international development and defence, and to pensioners. The government will maintain a disciplined approach to public spending to reach a balanced budget and live within its means. The commitments it is able to make on protecting public spending priorities in the next Parliament will need to be determined in light of evolving prospects for the fiscal position. The government will do this at the next Spending Review.
1.56 To ensure that the State Pension remains sustainable and fair across generations, the government is carrying out the first statutory review of State Pension age. The government will consider all the evidence – including an independent report by John Cridland – before publishing its review by 7 May 2017.
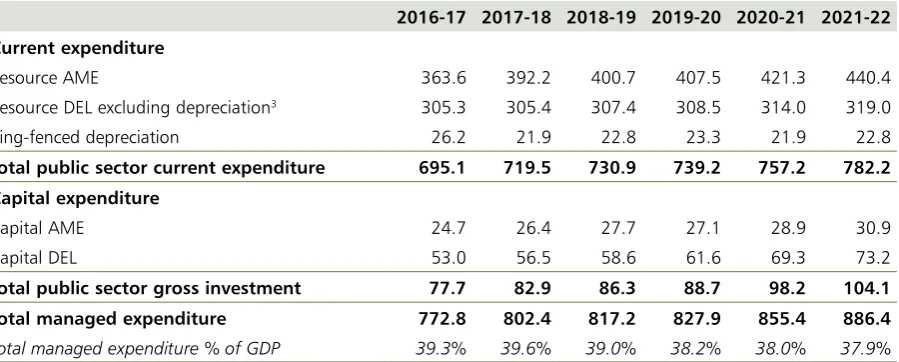
[image:22.595.76.526.389.570.2]1.57 As a result of efforts to reduce the deficit to a level that gets debt falling, government spending as a share of GDP has been brought down from 44.9% in 2010-11 to 40.0% in 2015-16.14 Total Managed Expenditure as a share of GDP is forecast to fall from 39.3% in 2016-17 to 37.9% in 2021-22, roughly the same proportion of GDP as in 2004.15 Table 1.5 sets out the path for Total Managed Expenditure (TME), Public Sector Current Expenditure (PSCE) and Public Sector Gross Investment (PSGI) to 2021-22.
Table 1.5: Total Managed Expenditure (£ billion, unless otherwise stated)1, 2
2016-17 2017-18 2018-19 2019-20 2020-21 2021-22 Current expenditure
Resource AME 363.6 392.2 400.7 407.5 421.3 440.4
Resource DEL excluding depreciation3 305.3 305.4 307.4 308.5 314.0 319.0
Ring-fenced depreciation 26.2 21.9 22.8 23.3 21.9 22.8
Total public sector current expenditure 695.1 719.5 730.9 739.2 757.2 782.2 Capital expenditure
Capital AME 24.7 26.4 27.7 27.1 28.9 30.9
Capital DEL 53.0 56.5 58.6 61.6 69.3 73.2
Total public sector gross investment 77.7 82.9 86.3 88.7 98.2 104.1
Total managed expenditure 772.8 802.4 817.2 827.9 855.4 886.4
Total managed expenditure % of GDP 39.3% 39.6% 39.0% 38.2% 38.0% 37.9%
1 Budgeting totals are shown including the Office for Budget Responsibility (OBR) forecast Allowance for Shortfall. Resource DEL excluding ring-fenced depreciation is the Treasury’s primary control within resource budgets and is the basis on which departmental Spending Review settlements are agreed. The OBR publishes Public Sector Current Expenditure (PSCE) in DEL and AME, and Public Sector Gross Investment (PSGI) in DEL and AME. A
reconciliation is published by the OBR.
2. The treatment of spending on Research and Development (R&D) was updated in the OBR’s November 2016 forecast to align with the revised treatment in the National Accounts. It is now treated as capital rather than resource spending.
3. The Scottish Government’s resource DEL block grant has been adjusted from 2016-17 onwards as agreed in the Scottish Government’s Fiscal Framework. In 2016-17 an adjustment of £5.5bn reflects the devolution of SDLT and Landfill Tax and the creation of the Scottish Rate of Income Tax. In 2017-18 an adjustment of £12.5bn additionally reflects the devolution of further Income Tax powers and revenues from Scottish courts. In 2018-19 and 2019-20, adjustments of £13.0bn and £13.4bn additionally reflect the devolution of Air Passenger Duty. Resource DEL numbers for 2020-21 and 2021-22 are indicative as budgets have not been set.
Source: Office for Budget Responsibility and HM Treasury calculations.
Efficiency Review
1.58 The government will deliver £3.5 billion of resource savings in 2019-20, supported by the Efficiency Review. The government intends to allocate £1 billion of these savings for re-investment in priority areas. The Chief Secretary to the Treasury, supported by the Minister for the Cabinet Office, is leading the Review, and has commissioned relevant Whitehall departments to consider options for reducing departmental spend in 2019-20. In delivering the Review, the government will meet the commitments on public spending set out for this Parliament including commitments to priority public services, to international development and defence, and to pensioners.
1.59 Alongside delivering savings in 2019-20, the Efficiency Review is also committed to embedding a culture of efficiency across government. Incremental improvements to the delivery of public services should be made each year to maximise value for money for taxpayers across government spending. The Chief Secretary to the Treasury has asked Sir Michael Barber to lead a review on strengthening the culture of efficiency in government to support this goal. This work will explore how efficiency is incentivised and measured across government, including considering the analytical frameworks used to inform choices on public spending. The government will report on progress on the Efficiency Review in autumn 2017.
Departmental Expenditure Limits
Table 1.6: Departmental Resource Budgets (£ billion)
Estimate Plans
2016-17 2017-18 2018-19 2019-20 Resource DEL excluding depreciation1
Defence2 26.7 27.5 28.2 29.0
Single Intelligence Account 1.9 1.8 1.9 2.0
Home Office 10.7 10.8 10.7 10.7
Foreign and Commonwealth Office 2.0 1.2 1.2 1.3
International Development 7.5 8.0 9.1 9.1
Health (inc. NHS) 116.1 117.6 120.3 123.2
Work and Pensions 6.1 6.3 6.0 5.4
Education 59.6 61.4 62.1 62.7
Business, Energy and Industrial Strategy 2.0 2.0 1.9 1.7
Transport 1.6 2.1 2.1 1.7
Exiting the European Union 0.0 0.1 0.1 0.1
International Trade 0.3 0.3 0.3 0.3
Culture, Media and Sport 1.4 1.4 1.5 1.5
DCLG Communities 2.6 3.1 2.3 2.2
DCLG Local Government 8.2 6.5 5.5 5.4
Scotland3 20.7 14.2 13.6 13.2
Wales 13.1 13.4 13.4 13.5
Northern Ireland 9.9 10.0 10.0 10.0
Justice 6.9 6.6 6.2 6.0
Law Officers Departments 0.5 0.5 0.5 0.5
Environment, Food and Rural Affairs 1.7 1.6 1.5 1.4
HM Revenue and Customs 3.6 3.5 3.2 2.9
HM Treasury 0.2 0.1 0.1 0.1
Cabinet Office 0.4 0.3 0.2 0.2
Small and Independent Bodies 1.5 1.4 1.3 1.3
Reserves 0.0 5.1 4.9 7.2
Adjustment for Budget Exchange4 0.0 -0.4 0.0 0.0
Adjustment for planned efficiency savings 0.0 0.0 0.0 -3.5
Total Resource DEL excluding depreciation 305.3 306.1 308.1 309.2
OBR allowance for shortfall 0.0 -0.8 -0.8 -0.8
OBR resource DEL excluding depreciation forecast 305.3 305.4 307.4 308.5
1 Resource DEL excluding depreciation is the Treasury’s primary control total within resource budgets and the basis on which Spending Review settlements were made.
2 The defence budget for 2016-17 reflects changes made in-year, such as the drawdown of funding from the special reserve for the net additional cost of military operations. No such allocations have yet been made for 2017-18 onwards.
3 The Scottish Government’s resource DEL block grant has been adjusted from 2016-17 onwards as agreed in the Scottish Government’s Fiscal Framework. In 2016-17 an adjustment of £5.5bn reflects the devolution of SDLT and Landfill Tax and the creation of the Scottish Rate of Income Tax. In 2017-18 an adjustment of £12.5bn additionally reflects the devolution of further Income Tax powers and revenues from Scottish courts. In 2018-19 and 2019-20, adjustments of £13.0bn and £13.4bn additionally reflect the devolution of Air Passenger Duty.
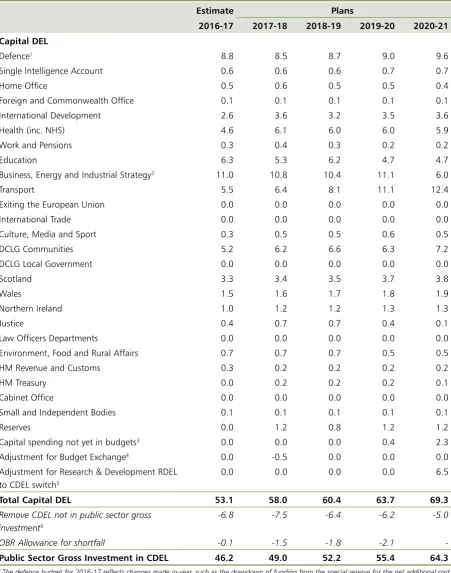
Table 1.7: Departmental Capital Budgets (£ billion)
Estimate Plans
2016-17 2017-18 2018-19 2019-20 2020-21 Capital DEL
Defence1 8.8 8.5 8.7 9.0 9.6
Single Intelligence Account 0.6 0.6 0.6 0.7 0.7
Home Office 0.5 0.6 0.5 0.5 0.4
Foreign and Commonwealth Office 0.1 0.1 0.1 0.1 0.1
International Development 2.6 3.6 3.2 3.5 3.6
Health (inc. NHS) 4.6 6.1 6.0 6.0 5.9
Work and Pensions 0.3 0.4 0.3 0.2 0.2
Education 6.3 5.3 6.2 4.7 4.7
Business, Energy and Industrial Strategy2 11.0 10.8 10.4 11.1 6.0
Transport 5.5 6.4 8.1 11.1 12.4
Exiting the European Union 0.0 0.0 0.0 0.0 0.0
International Trade 0.0 0.0 0.0 0.0 0.0
Culture, Media and Sport 0.3 0.5 0.5 0.6 0.5
DCLG Communities 5.2 6.2 6.6 6.3 7.2
DCLG Local Government 0.0 0.0 0.0 0.0 0.0
Scotland 3.3 3.4 3.5 3.7 3.8
Wales 1.5 1.6 1.7 1.8 1.9
Northern Ireland 1.0 1.2 1.2 1.3 1.3
Justice 0.4 0.7 0.7 0.4 0.1
Law Officers Departments 0.0 0.0 0.0 0.0 0.0
Environment, Food and Rural Affairs 0.7 0.7 0.7 0.5 0.5
HM Revenue and Customs 0.3 0.2 0.2 0.2 0.2
HM Treasury 0.0 0.2 0.2 0.2 0.1
Cabinet Office 0.0 0.0 0.0 0.0 0.0
Small and Independent Bodies 0.1 0.1 0.1 0.1 0.1
Reserves 0.0 1.2 0.8 1.2 1.2
Capital spending not yet in budgets3 0.0 0.0 0.0 0.4 2.3
Adjustment for Budget Exchange4 0.0 -0.5 0.0 0.0 0.0
Adjustment for Research & Development RDEL to CDEL switch5
0.0 0.0 0.0 0.0 6.5
Total Capital DEL 53.1 58.0 60.4 63.7 69.3
Remove CDEL not in public sector gross investment6
-6.8 -7.5 -6.4 -6.2 -5.0
OBR Allowance for shortfall -0.1 -1.5 -1.8 -2.1
-Public Sector Gross Investment in CDEL 46.2 49.0 52.2 55.4 64.3
1 The defence budget for 2016-17 reflects changes made in-year, such as the drawdown of funding from the special reserve for the net additional cost of military operations. No such allocations have yet been made for 2017-18 onwards.
2 Full BEIS CDEL budgets for 2020-21 have not yet been set. See footnote 5.
3 This represents funding not yet allocated to departments. It is presented net of the Office of Budget Responsibility’s (OBR) allowance for shortfall in 2020-21.
4 Departmental budgets in 2017-18 include amounts carried forward from 2016-17 through Budget Exchange, which will be voted at Main Estimates. These increases will be offset at Supplementary Estimates in future years so are excluded from spending totals.
5 Following the implementation of ESA10, all research and development (R&D) spending is classified as capital. Departmental R&D budgets have not been set in full in 2020-21. The table contains a forecast assumption for R&D which is not yet in departments’ budgets. The government will set 2020-21 R&D budgets for all departments in due course.
Devolved administrations
1.61 The application of the Barnett formula to spending decisions taken by the UK government at the Budget will provide each of the devolved administrations with additional funding to be allocated according to their own priorities. The Scottish and Welsh governments’ block grants will be further adjusted as set out in their respective fiscal frameworks.
Financial transactions
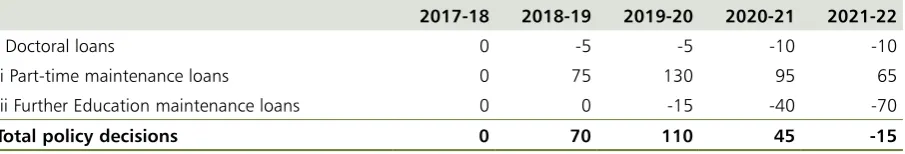
[image:26.595.73.526.247.324.2]1.62 Some policy measures do not directly affect PSNB in the same way as conventional spending or taxation. These include financial transactions that directly affect only the central government net cash requirement (CGNCR) and PSND. Table 1.8 shows the effect of the financial transactions announced at the Budget on CGNCR.
Table 1.8: Financial Transactions from 2017-18 to 2021-22 (£ million)1,2
2017-18 2018-19 2019-20 2020-21 2021-22
i Doctoral loans 0 -5 -5 -10 -10
ii Part-time maintenance loans 0 75 130 95 65
iii Further Education maintenance loans 0 0 -15 -40 -70
Total policy decisions 0 70 110 45 -15
1 Costings reflect the Office for Budget Responsibility’s latest economic and fiscal determinants. 2 Negative numbers in the table represent a cost to the Exchequer.
Asset sales
1.63 The government remains committed to returning the financial sector assets acquired in 2008-09 to the private sector, subject to market conditions and achieving value for taxpayers:
•
Lloyds – The government launched a trading plan on 7 October 2016 to sell its shares in Lloyds Banking Group in the market in an orderly and measured way.16 Sales already exceed its previous 2016-17 projection by £1.0 billion and remain on track to fully return Lloyds to the private sector by the end of 2017-18.17 When taken alongside previous share sales and dividends received the government has recovered over £19.0 billion for the taxpayer18 and is on track to recover all of the £20.3 billion injected in to the bank.•
RBS – The government will continue to seek opportunities for disposals, but the need to resolve legacy issues makes it uncertain as to when these will occur.•
UK Asset Resolution (UKAR) – UKAR’s balance sheet has already reduced from £115.8 billion in 2010 to £36.9 billion as at 30 September 201619 and its £15.65 billion programme of sales of Bradford & Bingley (B&B) mortgage assets continues to progress to plan with full conclusion expected before the end of 2017-1820.16 ‘Sale of public share in Lloyds to restart shortly’, HM Treasury, October 2017.
17 ‘Economic and fiscal outlook’, OBR, November 2016, ‘Economic and fiscal outlook’, OBR, March 2017. 18 ‘Taxpayers’ stake in Lloyds now below 4%’, HM Treasury, February 2017.
19 ‘UK Asset Resolution Limited Group Interim Financial Report for the 6 months to 30 September 2016’, UKAR, November 2016.
1.64 The government continues to explore options for the sale of wider corporate and financial assets, where there is no longer a policy reason to retain them and when value for money can be secured for taxpayers. This is an integral part of the government’s plan to repair the public finances. On 6 February, the government began the process to sell part of the pre-2012 income contingent repayment student loan book21. The sale process is expected to take several months and remains subject to market conditions and a final assessment of value for money. This is the first tranche of a programme of sales which is forecast to raise £12 billion by 2020-21.22 The sale process for the Green Investment Bank is ongoing.
Debt and reserves management
1.65 The government’s financing plans for 2017-18 are summarised in Annex A. They are set out in full in the ‘Debt management report 2017-18’, published alongside the Budget.23
1.66 The government will provide £6.0 billion of sterling financing for the Official Reserves in 2017-18.
21 ‘Government launches first sale from the student loan book’, Department for Education, HM Treasury and Student Loans Company, February 2017.
22 ‘Economic and fiscal outlook’, OBR, March 2017.
2
Policy decisions
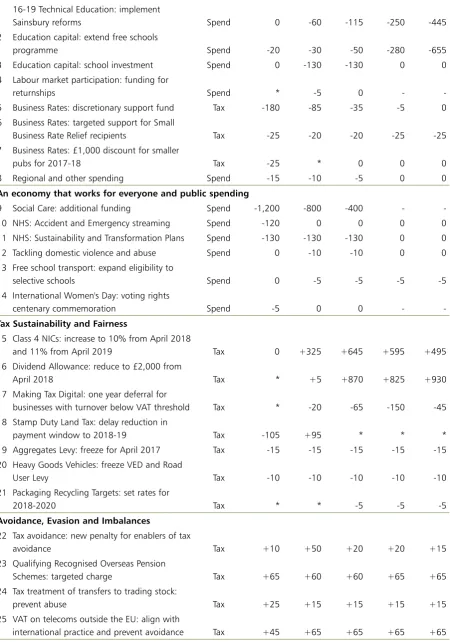
2.1 The following chapters set out all Spring Budget policy decisions. Unless stated otherwise, the decisions set out are ones which are announced at the Budget.
2.2 Table 2.1 shows the cost or yield of all Spring Budget decisions with a direct effect on PSNB in the years up to 2021-22. This includes tax measures, changes to allocated Departmental Expenditure Limits (DEL) and measures affecting annually managed expenditure (AME).
2.3 The government is also publishing the methodology underlying the calculation of the fiscal impact of each policy decision. This is included in the supplementary document ‘Spring Budget 2017: policy costings’1 published alongside the Budget.
2.4 The supplementary document ‘Overview of Tax Legislation and Rates’,2 published alongside the Budget, provides a more detailed explanation of tax measures included in this chapter and a summary of their impacts.
1 ‘Spring Budget 2017: policy costings’, HM Treasury, Department for Work and Pensions, and HM Revenue and
Customs, March 2017.
Table 2.1: Spring Budget 2017 policy decisions (£ million)1
Head 2017-18 2018-19 2019-20 2020-21 2021-222
Raising Productivity and Living Standards
1 16-19 Technical Education: implement Sainsbury reforms
2 Education capital: extend free schools programme
3 Education capital: school investment 4 Labour market participation: funding for
returnships
5 Business Rates: discretionary support fund 6 Business Rates: targeted support for Small
Business Rate Relief recipients
7 Business Rates: £1,000 discount for smaller pubs for 2017-18
8 Regional and other spending
Spend Spend Spend Spend Tax Tax Tax Spend 0 -20 0 * -180 -25 -25 -15 -60 -30 -130 -5 -85 -20 * -10 -115 -50 -130 0 -35 -20 0 -5 -250 -445 -280 -655 0 0 - --5 0 -25 -25 0 0 0 0
An economy that works for everyone and public spending
9 Social Care: additional funding Spend 10 NHS: Accident and Emergency streaming Spend 11 NHS: Sustainability and Transformation Plans Spend 12 Tackling domestic violence and abuse Spend 13 Free school transport: expand eligibility to
selective schools Spend 14 International Women's Day: voting rights
centenary commemoration Spend
-1,200 -120 -130 0 0 -5 -800 0 -130 -10 -5 0 -400 0 -130 -10 -5 0 -0 0 0 -5 -0 0 0 -5
-Tax Sustainability and Fairness
15 Class 4 NICs: increase to 10% from April 2018 and 11% from April 2019
16 Dividend Allowance: reduce to £2,000 from April 2018
17 Making Tax Digital: one year deferral for businesses with turnover below VAT threshold
Tax Tax Tax 0 * * +325 +5 -20 +645 +870 -65 +595 +825 -150 +495 +930 -45 18 Stamp Duty Land Tax: delay reduction in
payment window to 2018-19
19 Aggregates Levy: freeze for April 2017 20 Heavy Goods Vehicles: freeze VED and Road
User Levy
21 Packaging Recycling Targets: set rates for 2018-2020 Tax Tax Tax Tax -105 -15 -10 * +95 -15 -10 * * -15 -10 -5 * -15 -10 -5 * -15 -10 -5
Avoidance, Evasion and Imbalances
22 Tax avoidance: new penalty for enablers of tax
avoidance Tax +10 +50 +20 +20 +15
23 Qualifying Recognised Overseas Pension Schemes: targeted charge
24 Tax treatment of transfers to trading stock: prevent abuse
25 VAT on telecoms outside the EU: align with international practice and prevent avoidance
Head 2017-18 2018-19 2019-20 2020-21 2021-222
Previously announced welfare policy decisions
26 Tax Credit Debt: enhanced collection Spend 0 +60 +180 +145 +135 27 Living Together Data Fraud: enhanced data
collection Spend * +5 * * *
28 Child Tax Credit and Universal Credit: targeted
exceptions to two child limit Spend -5 -15 -35 -55 -70
Total policy decisions -1,710 -665 +825 +930 +445
Total spending policy decisions -1,545 -1,140 -705 -450 -1,040
Total tax policy decisions -165 +475 +1,530 +1,380 +1,485
* Negligible
1 Costings reflect the OBR’s latest economic and fiscal determinants.
2 At Spending Review 2015, the government set departmental spending plans for resource DEL (RDEL) for the years up to and including 2019-20, and capital DEL (CDEL) for the years up to and including 2020-21. Where specific commitments have been made beyond those periods, these have been set out on the scorecard. Where a specific commitment has not been made, adjustments have been made to the overall spending assumption beyond
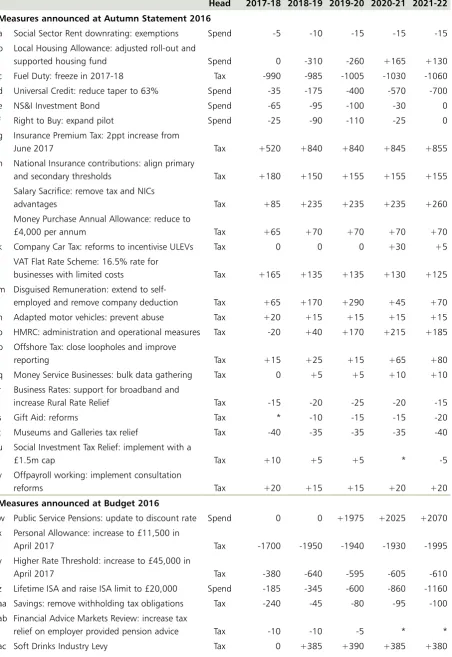
Table 2.2: Measures announced at Autumn Statement 2016 or earlier that will take effect from April 2017 or later (£ million)1
Head 2017-18 2018-19 2019-20 2020-21 2021-22 Measures announced at Autumn Statement 2016
a Social Sector Rent downrating: exemptions Spend -5 -10 -15 -15 -15 b Local Housing Allowance: adjusted roll-out and
supported housing fund Spend 0 -310 -260 +165 +130 c Fuel Duty: freeze in 2017-18 Tax -990 -985 -1005 -1030 -1060 d Universal Credit: reduce taper to 63% Spend -35 -175 -400 -570 -700 e NS&I Investment Bond Spend -65 -95 -100 -30 0 f Right to Buy: expand pilot Spend -25 -90 -110 -25 0 g Insurance Premium Tax: 2ppt increase from
June 2017 Tax +520 +840 +840 +845 +855
h National Insurance contributions: align primary
and secondary thresholds Tax +180 +150 +155 +155 +155 i Salary Sacrifice: remove tax and NICs
advantages Tax +85 +235 +235 +235 +260
j Money Purchase Annual Allowance: reduce to
£4,000 per annum Tax +65 +70 +70 +70 +70
k Company Car Tax: reforms to incentivise ULEVs Tax 0 0 0 +30 +5 l VAT Flat Rate Scheme: 16.5% rate for
businesses with limited costs Tax +165 +135 +135 +130 +125 m Disguised Remuneration: extend to
self-employed and remove company deduction Tax +65 +170 +290 +45 +70 n Adapted motor vehicles: prevent abuse Tax +20 +15 +15 +15 +15 o HMRC: administration and operational measures Tax -20 +40 +170 +215 +185 p Offshore Tax: close loopholes and improve
reporting Tax +15 +25 +15 +65 +80
q Money Service Businesses: bulk data gathering Tax 0 +5 +5 +10 +10 r Business Rates: support for broadband and
increase Rural Rate Relief Tax -15 -20 -25 -20 -15
s Gift Aid: reforms Tax * -10 -15 -15 -20
t Museums and Galleries tax relief Tax -40 -35 -35 -35 -40 u Social Investment Tax Relief: implement with a
£1.5m cap Tax +10 +5 +5 * -5
v Offpayroll working: implement consultation
reforms Tax +20 +15 +15 +20 +20
Measures announced at Budget 2016
w Public Service Pensions: update to discount rate Spend 0 0 +1975 +2025 +2070 x Personal Allowance: increase to £11,500 in
April 2017 Tax -1700 -1950 -1940 -1930 -1995 y Higher Rate Threshold: increase to £45,000 in
April 2017 Tax -380 -640 -595 -605 -610
z Lifetime ISA and raise ISA limit to £20,000 Spend -185 -345 -600 -860 -1160 aa Savings: remove withholding tax obligations Tax -240 -45 -80 -95 -100 ab Financial Advice Markets Review: increase tax
Head 2017-18 2018-19 2019-20 2020-21 2021-22
ad Business Rates: permanently double the Small
Business Rate Relief and extend thresholds Tax -1375 -1390 -1440 -1485 -1530 ae Business Rates: increase threshold for higher
multiplier to £51,000 Tax -110 -110 -115 -115 -125 af Business Rates: switch from RPI in April 2020 Tax 0 0 0 -270 -830 ag Corporation Tax: reduce to 17% in April 2020 Tax 0 0 -510 -2640 -2570 ah Corporation Tax: restrict relief for interest Tax +1105 +1140 +1080 +980 +1020 ai Corporation Tax: reform loss relief Tax +495 +355 +305 +255 +215 aj Corporation Tax: extend first year allowance and
lower emission thresholds for business cars Tax 0 +45 +115 +180 +190 ak Corporation Tax: defer bringing forward
payment for large groups for two years Tax +35 +30 -15 -10 * al Capital Gains Tax: extend reliefs Tax -45 -40 -45 -45 -45 am Self Employed: abolish Class 2 NICs Tax 0 -405 -430 -380 -350 an Sharing Economy: £1,000 allowance for both
trading and property income Tax -30 -235 -195 -200 -215 ao Business Energy: abolish Carbon Reduction
Commitment and offsetting increase to Climate
Change Levy Tax 0 0 +390 +35 +90
ap Carbon Price Support Rate: cap at £18/tCO2 in
April 2019 and uprate in April 2020 Tax 0 0 0 +20 +35 aq Off-payroll working: transfer liability to public
sector employers Tax +185 +105 +150 +170 +190 ar Aligning the tax and employer NICs treatment
of termination payments and preventing
manipulation of the rules Tax +40 +365 +400 +415 +430 as Value Added Tax: tackling overseas trader
evasion Tax +65 +130 +315 +365 +325
at Gambling Duties: reform treatment of freeplays Tax +45 +70 +75 +75 +80
au Help to Save Spend 0 0 -25 -85 -65
av Local Housing Allowance: implement for new
tenancies from April 2017 Spend 0 -130 -75 -35 -20
Measures announced at Spending Review and Autumn Statement 2015
aw Apprenticeship Levy (funding employer
apprenticeship scheme) Tax +2630 +2720 +2810 +2925 +3045 ax Stamp Duty Land Tax: bringing forward
payments Tax +100 +5 +5 +10 +10
ay Capital Gains Tax: reduce payment window for
residential property Tax 0 0 +1190 +315 +105 az Temporary accommodation: impact of new
funding mechanism Spend +225 +235 +245 +260 +270 ba Insurance Premium Tax: reform to motor
insurance claims rules Tax 0 -10 -40 -50 -55 bb Making Tax Digital: reducing errors through
record keeping Tax 0 +10 +400 +805 +965
bc Housing Benefit: limit social sector rates to the
equivalent private sector rate Spend 0 +440 +570 +660 +740 bd Pensions automatic enrolment: align with start
Head 2017-18 2018-19 2019-20 2020-21 2021-22 Measures announced at Summer Budget 2015
be Inheritance Tax: £1m couples allowance from 2020 through new main residence nil-rate band
phased in from 2017 Tax -265 -565 -610 -650 -725 bf Childcare: 30 hour entitle