Official Statistics Release
Policy area:
Learning and skills inspections and outcomes
Theme:
Education, children’s services and skills
Published on:
27 November 2012
Coverage:
England
Period covered:
1 September 2011 to 31 August 2012
Status:
Final
Issued by:
Office for Standards in Education, Children’s Services and
Skills (Ofsted)
125 Kingsway
London
WC2B 6SE
Responsible director:
Matthew Coffey
Statistician:
Jo Parkman
Public enquiries:
Press enquiries:
Link to official statistics release
web page:
http://www.ofsted.gov.uk/resources/official-statistics-
learning-and-skills-inspections-and-outcomes
Introduction
This official statistics release reports on learning and skills inspections that occurred between 1
September 2011 and 31 August 2012 under the common inspection framework for further
education and skills 2009. These statistics are based on final data for the academic year and
support the findings in the learning and skills sector report which is published alongside The Annual
Report of Her Majesty’s Chief Inspector of Education, Children’s Services and Skills 2011/12.
Contents
Introduction ... 2
Key findings ... 4
Methodology ... 5
Chart 1: Overall effectiveness of learning and skills providers inspected between 1 September 2011
and 31 August 2012, percentage (final) ... 7
Chart 2: Key inspection judgements of learning and skills providers inspected between 1 September
2011 and 31 August 2012, percentage (final) ... 7
Chart 3: Overall effectiveness of colleges inspected between 1 September 2005 and 31 August
2012, by academic year, percentage ... 8
Chart 3a: Overall effectiveness of independent learning providers inspected between 1 September
2007 and 31 August 2012, by academic year, percentage ... 8
Chart 3b: Overall effectiveness of adult and community learning providers inspected between 1
September 2007 and 31 August 2012, by academic year, percentage ... 9
Chart 4: Overall effectiveness of learning and skills providers inspected at 31 August 2012,
Table 2b: Inspection outcomes of general further education colleges/tertiary college inspected
between 1 September 2011 and 31 August 2012 (final) ... 14
Table 2c: Inspection outcomes of sixth form colleges inspected between 1 September 2011 and 31
August 2012 (final) ... 15
Table 2d: Inspection outcomes of independent specialist colleges inspected between 1 September
2011 and 31 August 2012 (final) ... 16
Table 2e: Inspection outcomes of higher education institutes inspected between 1 September 2011
and 31 August 2012 (final) ... 17
Table 2f: Inspection outcomes of Dance and Drama Awards schemes in colleges inspected between
1 September 2011 and 31 August 3012 (final) ... 18
Table 2g: Inspection outcomes of independent learning providers inspected between 1 September
2011 and 31 August 2012 (final) ... 19
Table 2h: Inspection outcomes of adult and community learning providers inspected between 1
September 2011 and 31 August 2012 (final) ... 20
Table 2i: Inspection outcomes of Next Step providers inspected between 1 September 2011 and 31
August 2012 (final) ... 21
Table 2j: Inspection outcomes of prison and young offender institutions inspected between 1
September 2011 and 31 August 2012 (final) ... 22
Table 2k: Inspection outcomes of probation trusts inspected between 1 September 2011 and 31
August 2012 (final) ... 23
Table 3: Learning and skills providers judged inadequate between 1 September 2011 and 31
Key findings
Latest inspection outcome
At 31 August 2012, there were 386 colleges which had received an Ofsted inspection and
had been in receipt of funding in 2011/12
1
. Four per cent of the 386 colleges were
inadequate for overall effectiveness at their latest inspection. A further 65%, were either
good or outstanding for overall effectiveness. The remaining 31% were satisfactory at their
most recent inspection.
Variations exist amongst outcomes for different types of college: 36% of sixth form colleges
were judged outstanding for overall effectiveness at their most recent inspection, compared
to 17% of general further education college/tertiary colleges and 14% of independent
specialist colleges. Sixth form colleges also had the highest proportion of inadequate
providers, with 4% inadequate compared to 3% of general further education college/tertiary
colleges.
There were 481 independent learning providers which had received an Ofsted inspection and
had been in receipt of funding in 2011/12. At 31 August, 12% were outstanding for overall
effectiveness at their most recent inspection. A further 49% were good.
Of the 263 adult and community learning providers which had received an Ofsted inspection
and had been in receipt of funding in 2011/12, five per cent were outstanding for overall
effectiveness at their most recent inspection at 31 August 2012. A further 63% of adult and
community learning providers were good.
Inspection year 1 September 2011 to 31 August 2012
In the inspection year between 1 September 2011 and 31 August 2012, there have been
309 inspections of learning and skills providers. This included 70 inspections of colleges, 128
inspections of independent learning providers, 63 inspections of adult and community
learning providers, 17 inspections of prison and young offender institutions, six inspections
of probation trusts, two inspections of Next Step providers, 16 inspections of Dance and
Drama Awards schemes located in 11 colleges and seven inspections of further education in
higher education institutions
2
.
1
The Common Inspection Framework applies to the inspection of provision either wholly or partly funded by the Skills
Funding Agency (SFA) or Education Funding Agency (EFA). For colleges this includes general further education/tertiary
colleges, specialist further education colleges, sixth form colleges and independent specialist colleges.
2
Inspections of Dance and Drama Awards schemes in colleges relate to the specific course only and not providers as a
Of the 70 colleges inspected, six per cent were outstanding for overall effectiveness, 33%
were good and 43% were satisfactory. The remaining 19%, almost one fifth of the colleges
inspected this year, were inadequate.
No college inspected in 2011/12 was judged outstanding overall for teaching and learning,
and only 44% were good
3
. The overall grade for teaching and learning was found to be
satisfactory at 51%, and four per cent was found to be inadequate.
Of the 128 independent learning providers inspected between 1 September 2011 and 31
August 2012, seven per cent were outstanding for overall effectiveness, 48% were good,
34% were satisfactory and 10% were inadequate.
Teaching and learning in more than half of the 128 independent learning providers inspected
in 2011/12 was found to be good or outstanding
4
. Adult and community learning providers
had an even higher proportion – 70% of providers were judged good or outstanding.
Methodology
1.
The data in this release are from inspections undertaken between 1 September 2011 and 31
August 2012. The details of these inspections can be found in the supplementary release
‘Learning and skills inspections and outcomes – Annual report 2011-12’ via the following
link:
http://www.ofsted.gov.uk/resources/official-statistics-learning-and-skills-inspections-and-outcomes
2.
Statistics relating to inspections undertaken in this year are final.
3.
The annual selection of learning and skills providers for inspection comprises three
elements: compulsory inspections, inspections resulting from risk assessment, and a random
selection:
The compulsory inspections are carried out for providers that have reached the
end point of their inspection window (For example a good provider must be
inspected every six years). New providers will also be subject to a compulsory
inspection after their first year of operation but within three years.
The second element of the year’s selection comprises providers selected through
risk assessment. This risk assessment looks at a number of current performance
measures, and also trends in these performance measures.
Finally, random selection is used to try to maintain a balance in the year’s
inspection programme, and resulting inspection judgements.
Only providers who consistently perform at a high level tend to reach the end point of their
inspection window. Risk assessment enables Ofsted to optimise the use of resources,
concentrating inspection activity in areas where it is likely to add most value. The result of
using a risk based approach to selection is that inspection judgements for providers, in any
given year, can look slightly more pessimistic than we know the national picture to be.
4.
In September 2009 Ofsted introduced a new common inspection framework for further
education and skills. For more information about the framework and how Ofsted inspects
learning and skills providers, please go to the Ofsted website:
http://www.ofsted.gov.uk/resources/common-inspection-framework-for-further-education-and-skills-2009
5.
From 1 January 2012, Ofsted will not produce its own summary report for prison
inspections. Ofsted will continue to report within the HMI Prisons report and in line with the
Common Inspection Framework. Further information on how Ofsted inspects prisoner
education and training in the further education and skills sector can be found on the Ofsted
website:
http://www.ofsted.gov.uk/resources/handbook-for-inspection-of-learning-and-skills-training-for-young-adults-and-adults-custody
6.
From September 2012 a revised framework has been introduced – the Common inspection
framework for further education and skills 2012. For more information please go to the
Ofsted website:
http://www.ofsted.gov.uk/resources/common-inspection-framework-for-further-education-and-skills-2012
7.
Revisions are published in line with Ofsted’s revisions policy for official statistics which can
be found on the Ofsted website:
Chart 1: Overall effectiveness of learning and skills providers inspected between 1
September 2011 and 31 August 2012, percentage (final)
1 2
6
4
17
43
31
7
5
33
31
38
33
43
56
48
59
100
50
33
43
49
31
33
14
13
34
32
33
67
19
16
31
17
10
5
17
All colleges (70)³
GFEC/TC (45)
SFC (13)
ISC (12)
HEI (7)
Dada (16)
ILP (128)
ACL (63)
Next Step (2)
Prison/YOI (6)
⁴
Probation (6)
Overall effectiveness of learning and skills providers inspected
between 1 September 2011 and 31 August 2012 (percentage)
Outstanding
Good
Satisfactory
Inadequate
1. Percentages are rounded and may not add to exactly 100. Percentages should be viewed with caution where the number of providers is small.
2. GFEC/TC: general further education college/tertiary college (includes specialist further education colleges); SFC: sixth form college; ISC:
independent specialist college; HEI: Further education in higher education institutions; Dada: Dance and Drama Awards Scheme; ILP: independent
learning provider (includes employer providers); ACL: adult and community learning provider; YOI: young offender institution.
3. Includes general further education college/tertiary college, sixth form college, specialist further education college and independent specialist
college.
4. Prison inspections between 1 September 2011 and 31 December 2011 only. From January 2012 Ofsted no longer awards an overall effectiveness
judgement for prisons.
Chart 2: Key inspection judgements of learning and skills providers inspected between
1 September 2011 and 31 August 2012, percentage (final)
1 2
3
6 5 8 6 3 7 47 47 45 53 53 48 36 38 38 38 41 35 11 10 8 3 3 10 Overall effectiveness (261)
Capacity to improve (256)
Outcomes for learners (261)
Quality of provision (256)
B1. How effectively do teaching, training and assessment support learning and development? (261)
Leadership and management (261)
Outstanding Good Satisfactory Inadequate
1. Percentages are rounded and may not add to exactly 100. Percentages should be viewed with caution where the number of providers is small.
2. Does not include inspections of the Dance and Drama Awards scheme, further education in higher education institute inspections, prison
inspections, probation trust inspections or Next Step inspections.
Chart 3: Overall effectiveness of colleges inspected between 1 September 2005 and 31
August 2012, by academic year, percentage
1 2
6
6
10
19
28
17
11
33
40
47
43
41
41
44
43
49
38
34
24
35
37
19
5
5
4
8
8
8
1 Sep 2011 - 31 Aug 2012 (70)
1 Sep 2010 - 31 Aug 2011 (83)³
1 Sep 2009 - 31 Aug 2010 (92)
1 Sep 2008 - 31 Aug 2009 (94)
1 Sep 2007 - 31 Aug 2008 (133)
1 Sep 2006 - 31 Aug 2007 (120)
1 Sep 2005 - 31 Aug 2006 (100)
Overall effectiveness of colleges inspected between 1 September 2005 and 31 August
2012, by academic year (percentage)
Outstanding Good Satisfactory Inadequate
Introduction
of new
framework
1. Percentages are rounded and may not add to exactly 100. Percentages should be viewed with caution where the number of providers is small.
2. Includes general further education/tertiary college (including specialist further education), sixth form college and independent specialist college.
3. Data vary slightly to that reported in previous years due to Ofsted's change in provider types.
Chart 3a: Overall effectiveness of independent learning providers inspected between 1
September 2007 and 31 August 2012, by academic year, percentage
1 2 3
7
12
6
5
6
48
47
41
36
54
34
36
45
51
34
10
5
8
8
6
1 Sep 2011 - 31 Aug 2012 (128)
1 Sep 2010 - 31 Aug 2011 (155)³
1 Sep 2009 - 31 Aug 2010 (183)³
1 Sep 2008 - 31 Aug 2009 (242)
1 Sep 2007 - 31 Aug 2008 (221)
Outstanding
Good
Satisfactory
Inadequate
Introduction
of new
framework
1. Percentages are rounded and may not add to exactly 100. Percentages should be viewed with caution where the number of providers is small.
2. Includes employer providers.
Chart 3b: Overall effectiveness of adult and community learning providers inspected
between 1 September 2007 and 31 August 2012, by academic year, percentage
1 2
5
3
6
6
59
59
64
44
35
32
36
29
47
45
5
3
7
3
14
1 Sep 2011 - 31Aug 2012 (63)
1 Sep 2010 - 31 Aug 2011 (73)³
1 Sep 2009 - 31 Aug 2010 (69)³
1 Sep 2008 - 31 Aug 2009 (68)
1 Sep 2007 - 31 Aug 2008 (49)
Outstanding
Good
Satisfactory
Inadequate
Introduction
of new
framework
1. Percentages are rounded and may not add to exactly 100. Percentages should be viewed with caution where the number of providers is small.
2. Includes general further education college/tertiary college, sixth form college, specialist further education college and independent specialist
college.
3. Data vary slightly to that reported in previous years due to Ofsted's change in provider types.
Chart 4: Overall effectiveness of learning and skills providers inspected at 31 August
2012, percentage
1
21
17
36
14
12
5
44
46
36
51
49
63
31
34
24
31
35
31
4
3
4
4
4
1 All college (386)²
General further education college/tertiary college (243)
Sixth form college (92)
Independent specialist college (51)
Independent learning provider (481)
Adult and community learning provider (263)
Overall effectiveness of learning and skills providers inspected at 31 August 2012 (percentage)
Outstanding Good Satisfactory Inadequate
Chart 5: Most recent overall effectiveness of learning and skills providers inspected at
31 August 2012 compared to the most recent overall effectiveness at 31 August 2011
and 31 August 2010, percentage (final)
1 2
13
12
11
51
51
49
33
35
38
3
2
2
31 Aug 2012 (1,130)
31 Aug 2011 (1,313)
31 Aug 2010 (1,253)
Most recent overall effectiveness of learning and skills providers inspected at 31
August 2012 compared to the most recent overall effectiveness at 31 August 2011 and
31 August 2010 (percentage)
Outstanding
Good
Satisfactory
Inadequate
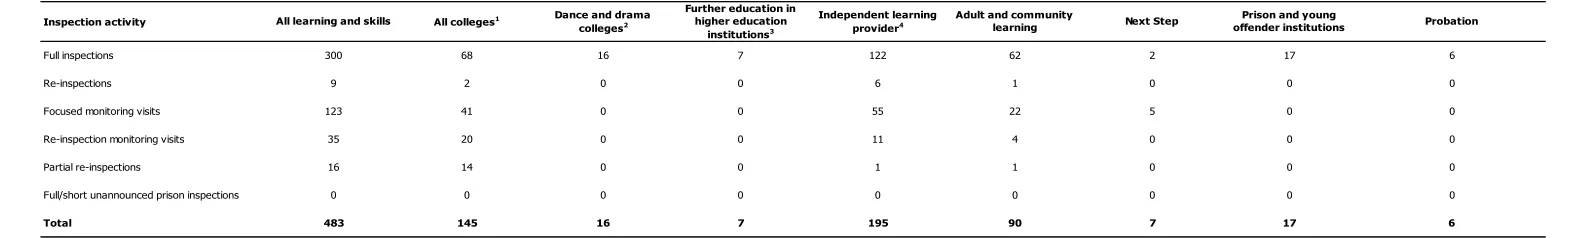
Table 1: Number of learning and skills providers inspected between 1 September 2011 and 31 August 2012, by provider and
inspection type (final)
Inspection activity
Full inspections Re-inspections
Focused monitoring visits
Re-inspection monitoring visits
Partial re-inspections
Full/short unannounced prison inspections
Total
Dance and drama colleges2
16 0
0
0
0
7 0
0
0
0
0 0 0
0 0 0 0 0 0
483 145 16 7 195 90
6
55
All colleges1
All learning and skills
9 300
2 68
Independent learning provider4
Further education in higher education
institutions3
Adult and community learning
11
14 1 1
4 62
1
22 122
16 35 123
20 41
6
0 0
0 0
0 0
0 0
Source: Ofsted 0
0
7 17 6
Next Step
2 0
5
Prison and young
offender institutions Probation
17
1. Includes general further education college/tertiary college (including specialist further education colleges), sixth form college, specialist further education college and independent specialist college.
2. Inspection of the Dance and Drama Awards scheme only not providers as a whole.
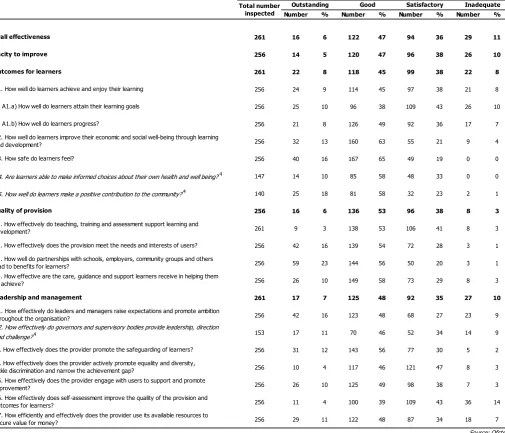
Table 2: Inspection outcomes of learning and skills providers inspected between 1
September 2011 and 31 August 2012 (final)
1 2 3
Select period:
Number % Number % Number % Number %
261 16 6 122 47 94 36 29 11
256 14 5 120 47 96 38 26 10
261 22 8 118 45 99 38 22 8
256 24 9 114 45 97 38 21 8
256 25 10 96 38 109 43 26 10
256 21 8 126 49 92 36 17 7
256 32 13 160 63 55 21 9 4
256 40 16 167 65 49 19 0 0
147 14 10 85 58 48 33 0 0
140 25 18 81 58 32 23 2 1
256 16 6 136 53 96 38 8 3
261 9 3 138 53 106 41 8 3
256 42 16 139 54 72 28 3 1
256 59 23 144 56 50 20 3 1
256 26 10 149 58 73 29 8 3
261 17 7 125 48 92 35 27 10
256 42 16 123 48 68 27 23 9
153 17 11 70 46 52 34 14 9
256 31 12 143 56 77 30 5 2
256 10 4 117 46 121 47 8 3
256 26 10 125 49 98 38 7 3
256 11 4 100 39 109 43 36 14
256 29 11 122 48 87 34 18 7
B4. How effective are the care, guidance and support learners receive in helping them to achieve?
C. Leadership and management
C1. How effectively do leaders and managers raise expectations and promote ambition throughout the organisation?
C2. How effectively do governors and supervisory bodies provide leadership, direction and challenge?4
C7. How efficiently and effectively does the provider use its available resources to secure value for money?
Source: Ofsted
C3. How effectively does the provider promote the safeguarding of learners? C4. How effectively does the provider actively promote equality and diversity, tackle discrimination and narrow the achievement gap?
C5. How effectively does the provider engage with users to support and promote improvement?
C6. How effectively does self-assessment improve the quality of the provision and outcomes for learners?
A4. Are learners able to make informed choices about their own health and well being?4
A5. How well do learners make a positive contribution to the community?4
B. Quality of provision
B1. How effectively do teaching, training and assessment support learning and development?
B2. How effectively does the provision meet the needs and interests of users? B3. How well do partnerships with schools, employers, community groups and others lead to benefits for learners?
A. Outcomes for learners
A1. How well do learners achieve and enjoy their learning
A1.a) How well do learners attain their learning goals
A1.b) How well do learners progress?
A2. How well do learners improve their economic and social well-being through learning and development?
A3. How safe do learners feel?
Satisfactory Inadequate
Overall effectiveness
Capacity to improve
1 September 2011 and 31 August 2012 Total number inspected
Outstanding Good
1. Does not include inspections of the Dance and Drama Awards scheme, further education in higher education institute inspections, prison
inspections probation trust inspections or Next Step inspections.
2. Data include five pilot inspections which grade overall effectiveness, outcomes for learners, teaching and learning and leadership and
management.
Table 2a: Inspection outcomes of colleges inspected between 1 September 2011 and
31 August 2012 (final)
1 2 3
Select period:
Number % Number % Number % Number %
70 4 6 23 33 30 43 13 19
67 4 6 25 37 28 42 10 15
70 4 6 18 26 38 54 10 14
67 4 6 18 27 36 54 9 13
67 3 4 18 27 32 48 14 21
67 2 3 24 36 36 54 5 7
67 7 10 32 48 23 34 5 7
67 17 25 44 66 6 9 0 0
65 8 12 36 55 21 32 0 0
65 15 23 34 52 15 23 1 2
67 5 7 26 39 33 49 3 4
70 0 0 31 44 36 51 3 4
67 8 12 34 51 25 37 0 0
67 25 37 32 48 10 15 0 0
67 7 10 32 48 24 36 4 6
70 4 6 27 39 26 37 13 19
67 8 12 32 48 15 22 12 18
67 7 10 31 46 20 30 9 13
67 15 22 35 52 14 21 3 4
67 1 1 31 46 33 49 2 3
67 12 18 27 40 28 42 0 0
67 3 4 20 30 29 43 15 22
67 6 9 25 37 28 42 8 12
B3. How well do partnerships with schools, employers, community groups and others lead to benefits for learners?
B4. How effective are the care, guidance and support learners receive in helping them to achieve?
C. Leadership and management
C1. How effectively do leaders and managers raise expectations and promote ambition throughout the organisation?
C6. How effectively does self-assessment improve the quality of the provision and outcomes for learners?
C7. How efficiently and effectively does the provider use its available resources to secure value for money?
C2. How effectively do governors and supervisory bodies provide leadership, direction and challenge?4
C3. How effectively does the provider promote the safeguarding of learners?
C4. How effectively does the provider actively promote equality and diversity, tackle discrimination and narrow the achievement gap?
C5. How effectively does the provider engage with users to support and promote improvement?
A1.b) How well do learners progress?
A2. How well do learners improve their economic and social well-being through learning and development?
A3. How safe do learners feel?
Satisfactory Inadequate
Outstanding Good
Overall effectiveness
1 September 2011 and 31 August 2012 Total number inspected
Source: Ofsted A4. Are learners able to make informed choices about their own health and well being?4
Capacity to improve
A. Outcomes for learners
A1. How well do learners achieve and enjoy their learning?
A1.a) How well do learners attain their learning goals?
A5. How well do learners make a positive contribution to the community?4
B. Quality of provision
B1. How effectively do teaching, training and assessment support learning and development?
B2. How effectively does the provision meet the needs and interests of users?
1. Includes general further education college/tertiary college (including specialist further education college), sixth form college and independent
specialist college.
2. Data include three pilot inspections which grade overall effectiveness, outcomes for learners, teaching and learning and leadership and
management.
Table 2b: Inspection outcomes of general further education colleges/tertiary college
inspected between 1 September 2011 and 31 August 2012 (final)
1 2 3
Select period:
Number % Number % Number % Number %
45 2 4 14 31 22 49 7 16
43 2 5 15 35 20 47 6 14
45 2 4 9 20 28 62 6 13
43 2 5 9 21 26 60 6 14
43 1 2 8 19 25 58 9 21
43 1 2 14 33 26 60 2 5
43 3 7 24 56 13 30 3 7
43 10 23 29 67 4 9 0 0
41 3 7 26 63 12 29 0 0
41 7 17 26 63 8 20 0 0
43 2 5 17 40 22 51 2 5
45 0 0 18 40 25 56 2 4
43 3 7 26 60 14 33 0 0
43 18 42 22 51 3 7 0 0
43 2 5 21 49 16 37 4 9
45 2 4 18 40 18 40 7 16
43 5 12 22 51 9 21 7 16
43 4 9 22 51 12 28 5 12
43 9 21 25 58 7 16 2 5
43 0 0 22 51 21 49 0 0
43 6 14 21 49 16 37 0 0
43 1 2 14 33 19 44 9 21
43 3 7 17 40 19 44 4 9
Source: Ofsted
Outstanding Good Satisfactory Inadequate
C5. How effectively does the provider engage with users to support and promote improvement?
C4. How effectively does the provider actively promote equality and diversity, tackle discrimination and narrow the achievement gap?
C1. How effectively do leaders and managers raise expectations and promote ambition throughout the organisation?
C3. How effectively does the provider promote the safeguarding of learners? C2. How effectively do governors and supervisory bodies provide leadership, direction and challenge?4
Total number inspected
C7. How efficiently and effectively does the provider use its available resources to secure value for money?
C6. How effectively does self-assessment improve the quality of the provision and outcomes for learners?
A4. Are learners able to make informed choices about their own health and well being?4
B3. How well do partnerships with schools, employers, community groups and others lead to benefits for learners?
B2. How effectively does the provision meet the needs and interests of users? B1. How effectively do teaching, training and assessment support learning and development?
B. Quality of provision
C. Leadership and management
B4. How effective are the care, guidance and support learners receive in helping them to achieve?
1 September 2011 and 31 August 2012
Capacity to improve
A. Outcomes for learners
A1. How well do learners achieve and enjoy their learning?
Overall effectiveness
A5. How well do learners make a positive contribution to the community?4 A1.a) How well do learners attain their learning goals?
A1.b) How well do learners progress?
A2. How well do learners improve their economic and social well-being through learning and development?
A3. How safe do learners feel?
1. Includes specialist further education college.
2. Data include two pilot inspections which grade overall effectiveness, outcomes for learners, teaching and learning and leadership and
management.
3. Percentages are rounded and may not add to 100.
Where the number of inspections is small percentages should be treated with
caution.
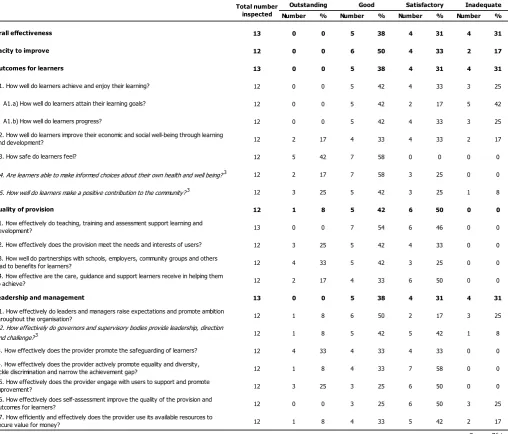
Table 2c: Inspection outcomes of sixth form colleges inspected between 1 September
2011 and 31 August 2012 (final)
1 2
Select period:
Number % Number % Number % Number %
13 0 0 5 38 4 31 4 31
12 0 0 6 50 4 33 2 17
13 0 0 5 38 4 31 4 31
12 0 0 5 42 4 33 3 25
12 0 0 5 42 2 17 5 42
12 0 0 5 42 4 33 3 25
12 2 17 4 33 4 33 2 17
12 5 42 7 58 0 0 0 0
12 2 17 7 58 3 25 0 0
12 3 25 5 42 3 25 1 8
12 1 8 5 42 6 50 0 0
13 0 0 7 54 6 46 0 0
12 3 25 5 42 4 33 0 0
12 4 33 5 42 3 25 0 0
12 2 17 4 33 6 50 0 0
13 0 0 5 38 4 31 4 31
12 1 8 6 50 2 17 3 25
12 1 8 5 42 5 42 1 8
12 4 33 4 33 4 33 0 0
12 1 8 4 33 7 58 0 0
12 3 25 3 25 6 50 0 0
12 0 0 3 25 6 50 3 25
12 1 8 4 33 5 42 2 17
A5. How well do learners make a positive contribution to the community?3
Total number inspected
A1.a) How well do learners attain their learning goals?
A1.b) How well do learners progress?
A2. How well do learners improve their economic and social well-being through learning and development?
1 September 2011 and 31 August 2012
Capacity to improve
A. Outcomes for learners
A1. How well do learners achieve and enjoy their learning?
Overall effectiveness
C4. How effectively does the provider actively promote equality and diversity, tackle discrimination and narrow the achievement gap?
A3. How safe do learners feel?
A4. Are learners able to make informed choices about their own health and well being?3
C1. How effectively do leaders and managers raise expectations and promote ambition throughout the organisation?
C. Leadership and management
B4. How effective are the care, guidance and support learners receive in helping them to achieve?
B3. How well do partnerships with schools, employers, community groups and others lead to benefits for learners?
B2. How effectively does the provision meet the needs and interests of users? B1. How effectively do teaching, training and assessment support learning and development?
B. Quality of provision
Source: Ofsted
Outstanding Good Satisfactory Inadequate
C3. How effectively does the provider promote the safeguarding of learners? C2. How effectively do governors and supervisory bodies provide leadership, direction and challenge?3
C7. How efficiently and effectively does the provider use its available resources to secure value for money?
C6. How effectively does self-assessment improve the quality of the provision and outcomes for learners?
C5. How effectively does the provider engage with users to support and promote improvement?
1. Data include one pilot inspection which grades overall effectiveness, outcomes for learners, teaching and learning and leadership and
management.
Table 2d: Inspection outcomes of independent specialist colleges inspected between 1
September 2011 and 31 August 2012 (final)
1
Select period:
Number % Number % Number % Number %
12 2 17 4 33 4 33 2 17
12 2 17 4 33 4 33 2 17
12 2 17 4 33 6 50 0 0
12 2 17 4 33 6 50 0 0
12 2 17 5 42 5 42 0 0
12 1 8 5 42 6 50 0 0
12 2 17 4 33 6 50 0 0
12 2 17 8 67 2 17 0 0
12 3 25 3 25 6 50 0 0
12 5 42 3 25 4 33 0 0
12 2 17 4 33 5 42 1 8
12 0 0 6 50 5 42 1 8
12 2 17 3 25 7 58 0 0
12 3 25 5 42 4 33 0 0
12 3 25 7 58 2 17 0 0
12 2 17 4 33 4 33 2 17
12 2 17 4 33 4 33 2 17
12 2 17 4 33 3 25 3 25
12 2 17 6 50 3 25 1 8
12 0 0 5 42 5 42 2 17
12 3 25 3 25 6 50 0 0
12 2 17 3 25 4 33 3 25
12 2 17 4 33 4 33 2 17
C4. How effectively does the provider actively promote equality and diversity, tackle discrimination and narrow the achievement gap?
C. Leadership and management
C3. How effectively does the provider promote the safeguarding of learners? C2. How effectively do governors and supervisory bodies provide leadership, direction and challenge?2
C7. How efficiently and effectively does the provider use its available resources to secure value for money?
C6. How effectively does self-assessment improve the quality of the provision and outcomes for learners?
Source: Ofsted
Outstanding Good Satisfactory Inadequate
C5. How effectively does the provider engage with users to support and promote improvement?
B3. How well do partnerships with schools, employers, community groups and others lead to benefits for learners?
B2. How effectively does the provision meet the needs and interests of users? B1. How effectively do teaching, training and assessment support learning and development?
B. Quality of provision
B4. How effective are the care, guidance and support learners receive in helping them to achieve?
C1. How effectively do leaders and managers raise expectations and promote ambition throughout the organisation?
A5. How well do learners make a positive contribution to the community?2 A1.a) How well do learners attain their learning goals?
A1.b) How well do learners progress?
A2. How well do learners improve their economic and social well-being through learning and development?
A3. How safe do learners feel?
A4. Are learners able to make informed choices about their own health and well being?2
Total number inspected
1 September 2011 and 31 August 2012
Capacity to improve
A. Outcomes for learners
A1. How well do learners achieve and enjoy their learning?
Overall effectiveness
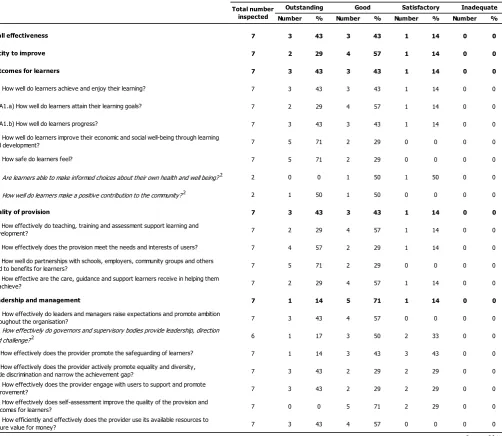
Table 2e: Inspection outcomes of higher education institutes inspected between 1
September 2011 and 31 August 2012 (final)
1
Inspection judgements relate to the further education provision only not providers as a
whole
Select period:
Number % Number % Number % Number %
7 3 43 3 43 1 14 0 0
7 2 29 4 57 1 14 0 0
7 3 43 3 43 1 14 0 0
7 3 43 3 43 1 14 0 0
7 2 29 4 57 1 14 0 0
7 3 43 3 43 1 14 0 0
7 5 71 2 29 0 0 0 0
7 5 71 2 29 0 0 0 0
2 0 0 1 50 1 50 0 0
2 1 50 1 50 0 0 0 0
7 3 43 3 43 1 14 0 0
7 2 29 4 57 1 14 0 0
7 4 57 2 29 1 14 0 0
7 5 71 2 29 0 0 0 0
7 2 29 4 57 1 14 0 0
7 1 14 5 71 1 14 0 0
7 3 43 4 57 0 0 0 0
6 1 17 3 50 2 33 0 0
7 1 14 3 43 3 43 0 0
7 3 43 2 29 2 29 0 0
7 3 43 2 29 2 29 0 0
7 0 0 5 71 2 29 0 0
7 3 43 4 57 0 0 0 0
C3. How effectively does the provider promote the safeguarding of learners?
C4. How effectively does the provider actively promote equality and diversity, tackle discrimination and narrow the achievement gap?
C5. How effectively does the provider engage with users to support and promote improvement?
C6. How effectively does self-assessment improve the quality of the provision and outcomes for learners?
C7. How efficiently and effectively does the provider use its available resources to secure value for money?
Source: Ofsted B2. How effectively does the provision meet the needs and interests of users?
B3. How well do partnerships with schools, employers, community groups and others lead to benefits for learners?
B4. How effective are the care, guidance and support learners receive in helping them to achieve?
C. Leadership and management
C1. How effectively do leaders and managers raise expectations and promote ambition throughout the organisation?
C2. How effectively do governors and supervisory bodies provide leadership, direction and challenge?2
A2. How well do learners improve their economic and social well-being through learning and development?
A3. How safe do learners feel?
A4. Are learners able to make informed choices about their own health and well being?2
A5. How well do learners make a positive contribution to the community?2
B. Quality of provision
B1. How effectively do teaching, training and assessment support learning and development?
Overall effectiveness
Capacity to improve
A. Outcomes for learners
A1. How well do learners achieve and enjoy their learning?
A1.a) How well do learners attain their learning goals?
A1.b) How well do learners progress?
1 September 2011 and 31 August 2012 Total number inspected
Outstanding Good Satisfactory Inadequate
Table 2f: Inspection outcomes of Dance and Drama Awards schemes in colleges inspected
between 1 September 2011 and 31 August 3012 (final)
1 2Inspection judgements relate to the Dance and Drama Awards scheme only and not providers
as a whole.
Select period:
Number % Number % Number % Number %
16 5 31 9 56 2 13 0 0
16 6 38 8 50 2 13 0 0
16 6 38 9 56 1 6 0 0
16 6 38 9 56 1 6 0 0
16 6 38 9 56 1 6 0 0
16 6 38 9 56 1 6 0 0
16 6 38 9 56 1 6 0 0
16 10 63 5 31 1 6 0 0
16 6 38 10 63 0 0 0 0
4 2 50 2 50 0 0 0 0
16 6 38 9 56 1 6 0 0
16 1 6 14 88 1 6 0 0
16 7 44 8 50 1 6 0 0
16 13 81 3 19 0 0 0 0
16 12 75 3 19 1 6 0 0
16 5 31 9 56 2 13 0 0
16 8 50 6 38 2 13 0 0
8 4 50 4 50 0 0 0 0
16 5 31 10 63 0 0 1 6
16 4 25 12 75 0 0 0 0
16 5 31 10 63 1 6 0 0
16 1 6 13 81 2 13 0 0
16 6 38 9 56 1 6 0 0
C3. How effectively does the provider promote the safeguarding of learners?
C4. How effectively does the provider actively promote equality and diversity, tackle discrimination and narrow the achievement gap?
C5. How effectively does the provider engage with users to support and promote improvement?
C6. How effectively does self-assessment improve the quality of the provision and outcomes for learners?
C7. How efficiently and effectively does the provider use its available resources to secure value for money?
Source: Ofsted B2. How effectively does the provision meet the needs and interests of users?
B3. How well do partnerships with schools, employers, community groups and others lead to benefits for learners?
B4. How effective are the care, guidance and support learners receive in helping them to achieve?
C. Leadership and management
C1. How effectively do leaders and managers raise expectations and promote ambition throughout the organisation?
C2. How effectively do governors and supervisory bodies provide leadership, direction and challenge?2
A2. How well do learners improve their economic and social well-being through learning and development?
A3. How safe do learners feel?
A4. Are learners able to make informed choices about their own health and well being?2
A5. How well do learners make a positive contribution to the community?2
B. Quality of provision
B1. How effectively do teaching, training and assessment support learning and development?
Overall effectiveness
Capacity to improve
A. Outcomes for learners
A1. How well do learners achieve and enjoy their learning?
A1.a) How well do learners attain their learning goals?
A1.b) How well do learners progress?
1 September 2011 and 31 August 2012 Total number inspected
Outstanding Good Satisfactory Inadequate
Table 2g: Inspection outcomes of independent learning providers inspected between 1
September 2011 and 31 August 2012 (final)
1 2 3
Select period:
Number % Number % Number % Number %
128 9 7 62 48 44 34 13 10
127 7 6 60 47 48 38 12 9
128 15 12 63 49 41 32 9 7
127 17 13 60 47 41 32 9 7
127 18 14 52 41 48 38 9 7
127 17 13 61 48 41 32 8 6
127 20 16 82 65 23 18 2 2
127 17 13 79 62 31 24 0 0
41 4 10 24 59 13 32 0 0
37 4 11 24 65 8 22 1 3
127 9 7 66 52 48 38 4 3
128 8 6 64 50 52 41 4 3
127 23 18 69 54 33 26 2 2
127 20 16 72 57 32 25 3 2
127 13 10 75 59 35 28 4 3
128 9 7 61 48 47 37 11 9
127 23 18 61 48 35 28 8 6
32 3 9 16 50 12 38 1 3
127 13 10 66 52 46 36 2 2
127 2 2 53 42 67 53 5 4
127 10 8 58 46 53 42 6 5
127 7 6 45 35 59 46 16 13
127 17 13 62 49 41 32 7 6
C4. How effectively does the provider actively promote equality and diversity, tackle discrimination and narrow the achievement gap?
C. Leadership and management
C3. How effectively does the provider promote the safeguarding of learners? C2. How effectively do governors and supervisory bodies provide leadership, direction and challenge?4
C7. How efficiently and effectively does the provider use its available resources to secure value for money?
C6. How effectively does self-assessment improve the quality of the provision and outcomes for learners?
Source: Ofsted
Outstanding Good Satisfactory Inadequate
C5. How effectively does the provider engage with users to support and promote improvement?
B3. How well do partnerships with schools, employers, community groups and others lead to benefits for learners?
B2. How effectively does the provision meet the needs and interests of users? B1. How effectively do teaching, training and assessment support learning and development?
B. Quality of provision
B4. How effective are the care, guidance and support learners receive in helping them to achieve?
C1. How effectively do leaders and managers raise expectations and promote ambition throughout the organisation?
A5. How well do learners make a positive contribution to the community?4 A1.a) How well do learners attain their learning goals?
A1.b) How well do learners progress?
A2. How well do learners improve their economic and social well-being through learning and development?
A3. How safe do learners feel?
A4. Are learners able to make informed choices about their own health and well being?4
Total number inspected
1 September 2011 and 31 August 2012
Capacity to improve
A. Outcomes for learners
A1. How well do learners achieve and enjoy their learning?
Overall effectiveness
1. Data include one pilot inspection which grades overall effectiveness, outcomes for learners, teaching and learning and leadership and
management.
2. Percentages are rounded and may not add to 100. Where the number of inspections is small, percentages should be treated with caution.
3. Includes employer providers.
Table 2h: Inspection outcomes of adult and community learning providers inspected
between 1 September 2011 and 31 August 2012 (final)
1 2
Select period:
Number % Number % Number % Number %
63 3 5 37 59 20 32 3 5
62 3 5 35 56 20 32 4 6
63 3 5 37 59 20 32 3 5
62 3 5 36 58 20 32 3 5
62 4 6 26 42 29 47 3 5
62 2 3 41 66 15 24 4 6
62 5 8 46 74 9 15 2 3
62 6 10 44 71 12 19 0 0
41 2 5 25 61 14 34 0 0
38 6 16 23 61 9 24 0 0
62 2 3 44 71 15 24 1 2
63 1 2 43 68 18 29 1 2
62 11 18 36 58 14 23 1 2
62 14 23 40 65 8 13 0 0
62 6 10 42 68 14 23 0 0
63 4 6 37 59 19 30 3 5
62 11 18 30 48 18 29 3 5
54 7 13 23 43 20 37 4 7
62 3 5 42 68 17 27 0 0
62 7 11 33 53 21 34 1 2
62 4 6 40 65 17 27 1 2
62 1 2 35 56 21 34 5 8
62 6 10 35 56 18 29 3 5
A1.a) How well do learners attain their learning goals?
A1.b) How well do learners progress?
A2. How well do learners improve their economic and social well-being through learning and development?
1 September 2011 and 31 August 2012
Capacity to improve
A. Outcomes for learners
A1. How well do learners achieve and enjoy their learning?
Overall effectiveness
A3. How safe do learners feel?
A4. Are learners able to make informed choices about their own health and well being?3
C1. How effectively do leaders and managers raise expectations and promote ambition throughout the organisation?
C. Leadership and management
B4. How effective are the care, guidance and support learners receive in helping them to achieve?
B3. How well do partnerships with schools, employers, community groups and others lead to benefits for learners?
B2. How effectively does the provision meet the needs and interests of users? B1. How effectively do teaching, training and assessment support learning and development?
B. Quality of provision
A5. How well do learners make a positive contribution to the community?3
C3. How effectively does the provider promote the safeguarding of learners? C2. How effectively do governors and supervisory bodies provide leadership, direction and challenge?3
C7. How efficiently and effectively does the provider use its available resources to secure value for money?
C6. How effectively does self-assessment improve the quality of the provision and outcomes for learners?
C5. How effectively does the provider engage with users to support and promote improvement?
C4. How effectively does the provider actively promote equality and diversity, tackle discrimination and narrow the achievement gap?
Total number inspected
Source: Ofsted
Outstanding Good Satisfactory Inadequate
1. Data include one pilot inspection which grades overall effectiveness, outcomes for learners, teaching and learning and leadership and
management.
Table 2i: Inspection outcomes of Next Step providers inspected between 1 September
2011 and 31 August 2012 (final)
1
Select period:
Number % Number % Number % Number %
2 0 0 2 100 0 0 0 0
2 0 0 2 100 0 0 0 0
2 0 0 2 100 0 0 0 0
2 0 0 2 100 0 0 0 0
2 0 0 2 100 0 0 0 0
2 0 0 2 100 0 0 0 0
2 0 0 2 100 0 0 0 0
2 0 0 2 100 0 0 0 0
0 0 0 0 0 0 0 0 0
1 0 0 1 100 0 0 0 0
2 0 0 2 100 0 0 0 0
2 0 0 2 100 0 0 0 0
2 0 0 2 100 0 0 0 0
2 0 0 2 100 0 0 0 0
2 0 0 2 100 0 0 0 0
2 0 0 2 100 0 0 0 0
2 0 0 2 100 0 0 0 0
0 0 0 0 0 0 0 0 0
2 0 0 2 100 0 0 0 0
2 0 0 2 100 0 0 0 0
2 0 0 2 100 0 0 0 0
2 0 0 1 50 1 50 0 0
2 0 0 2 100 0 0 0 0
C3. How effectively does the provider promote the safeguarding of learners?
C4. How effectively does the provider actively promote equality and diversity, tackle discrimination and narrow the achievement gap?
C5. How effectively does the provider engage with users to support and promote improvement?
C6. How effectively does self-assessment improve the quality of the provision and outcomes for learners?
C7. How efficiently and effectively does the provider use its available resources to secure value for money?
Source: Ofsted B2. How effectively does the provision meet the needs and interests of users?
B3. How well do partnerships with schools, employers, community groups and others lead to benefits for learners?
B4. How effective are the care, guidance and support learners receive in helping them to achieve?
C. Leadership and management
C1. How effectively do leaders and managers raise expectations and promote ambition throughout the organisation?
C2. How effectively do governors and supervisory bodies provide leadership, direction and challenge?2
A2. How well do learners improve their economic and social well-being through learning and development?
A3. How safe do learners feel?
A4. Are learners able to make informed choices about their own health and well being?2
A5. How well do learners make a positive contribution to the community?2
B. Quality of provision
B1. How effectively do teaching, training and assessment support learning and development?
Overall effectiveness
Capacity to improve
A. Outcomes for learners
A1. How well do learners achieve and enjoy their learning?
A1.a) How well do learners attain their learning goals?
A1.b) How well do learners progress?
1 September 2011 and 31 August 2012 Total number inspected
Outstanding Good Satisfactory Inadequate
Table 2j: Inspection outcomes of prison and young offender institutions inspected
between 1 September 2011 and 31 August 2012 (final)
1
Select period:
Number % Number % Number % Number %
6 0 0 3 50 2 33 1 17
6 0 0 3 50 2 33 1 17
6 1 17 3 50 2 33 0 0
6 1 17 3 50 2 33 0 0
6 1 17 3 50 2 33 0 0
6 1 17 3 50 2 33 0 0
6 1 17 1 17 4 67 0 0
6 0 0 4 67 2 33 0 0
1 0 0 1 100 0 0 0 0
2 1 50 1 50 0 0 0 0
6 0 0 3 50 3 50 0 0
6 0 0 2 33 4 67 0 0
6 0 0 3 50 2 33 1 17
6 1 17 2 33 3 50 0 0
6 0 0 2 33 4 67 0 0
6 0 0 3 50 2 33 1 17
6 0 0 4 67 1 17 1 17
0 0 0 0 0 0 0 0 0
6 0 0 3 50 3 50 0 0
6 0 0 2 33 4 67 0 0
6 0 0 4 67 1 17 1 17
6 0 0 2 33 3 50 1 17
6 0 0 3 50 2 33 1 17
A1.a) How well do learners attain their learning goals?
A1.b) How well do learners progress?
A2. How well do learners improve their economic and social well-being through learning and development?
1 September 2011 and 31 August 2012
Capacity to improve
A. Outcomes for learners
A1. How well do learners achieve and enjoy their learning?
Overall effectiveness
A3. How safe do learners feel?
A4. Are learners able to make informed choices about their own health and well being?2
C1. How effectively do leaders and managers raise expectations and promote ambition throughout the organisation?
C. Leadership and management
B4. How effective are the care, guidance and support learners receive in helping them to achieve?
B3. How well do partnerships with schools, employers, community groups and others lead to benefits for learners?
B2. How effectively does the provision meet the needs and interests of users? B1. How effectively do teaching, training and assessment support learning and development?
B. Quality of provision
A5. How well do learners make a positive contribution to the community?2
C3. How effectively does the provider promote the safeguarding of learners? C2. How effectively do governors and supervisory bodies provide leadership, direction and challenge?2
C7. How efficiently and effectively does the provider use its available resources to secure value for money?
C6. How effectively does self-assessment improve the quality of the provision and outcomes for learners?
C5. How effectively does the provider engage with users to support and promote improvement?
C4. How effectively does the provider actively promote equality and diversity, tackle discrimination and narrow the achievement gap?
Total number inspected
Source: Ofsted
Outstanding Good Satisfactory Inadequate
Table 2k: Inspection outcomes of probation trusts inspected between 1 September
2011 and 31 August 2012 (final)
1
Select period:
Number % Number % Number % Number %
6 0 0 2 33 4 67 0 0
6 0 0 2 33 4 67 0 0
6 0 0 2 33 4 67 0 0
6 0 0 2 33 4 67 0 0
6 0 0 2 33 3 50 1 17
6 0 0 2 33 4 67 0 0
6 0 0 4 67 2 33 0 0
6 0 0 2 33 4 67 0 0
1 0 0 1 100 0 0 0 0
3 0 0 3 100 0 0 0 0
6 0 0 3 50 2 33 1 17
6 0 0 4 67 1 17 1 17
6 0 0 2 33 3 50 1 17
6 0 0 3 50 3 50 0 0
6 0 0 4 67 1 17 1 17
6 0 0 2 33 4 67 0 0
6 0 0 2 33 4 67 0 0
0 0 0 0 0 0 0 0 0
6 0 0 0 0 6 100 0 0
6 0 0 2 33 4 67 0 0
6 0 0 3 50 3 50 0 0
6 0 0 0 0 3 50 3 50
6 0 0 4 67 2 33 0 0
C. Leadership and management
C1. How effectively do leaders and managers raise expectations and promote ambition throughout the organisation?
C2. How effectively do governors and supervisory bodies provide leadership, direction and challenge?2
C3. How effectively does the provider promote the safeguarding of learners?
Source: Ofsted C4. How effectively does the provider actively promote equality and diversity,
tackle discrimination and narrow the achievement gap?
C5. How effectively does the provider engage with users to support and promote improvement?
C6. How effectively does self-assessment improve the quality of the provision and outcomes for learners?
C7. How efficiently and effectively does the provider use its available resources to secure value for money?
A5. How well do learners make a positive contribution to the community?2
B. Quality of provision
B1. How effectively do teaching, training and assessment support learning and development?
B2. How effectively does the provision meet the needs and interests of users?
B3. How well do partnerships with schools, employers, community groups and others lead to benefits for learners?
B4. How effective are the care, guidance and support learners receive in helping them to achieve?
A1. How well do learners achieve and enjoy their learning?
A1.a) How well do learners attain their learning goals?
A1.b) How well do learners progress?
A2. How well do learners improve their economic and social well-being through learning and development?
A3. How safe do learners feel?
A4. Are learners able to make informed choices about their own health and well being?2
Inadequate
Overall effectiveness
Capacity to improve
A. Outcomes for learners
1 September 2011 and 31 August 2012 Total number Outstanding Good Satisfactory inspected
Table 3: Learning and skills providers judged inadequate between 1 September 2011
and 31 August 2012 (final)
52120
Hampstead Garden Suburb Institute
Adult and community learning provider
30/09/2011
58587
Capital Engineering Group Holdings Ltd
Independent learning provider
07/10/2011
54472
Southbank Training Limited
Independent learning provider
21/10/2011
58966
Travis Perkins Plc
Independent learning provider - employer 04/11/2011
58927
ISS UK Limited
Independent learning provider - employer 25/11/2011
58198
Polestar UK Print Limited
Independent learning provider - employer 16/12/2011
52266
HMP Dartmoor
Prisons
16/12/2011
50720
Birmingham Rathbone Society
Adult and community learning provider
20/01/2012
54434
Smart Training and Recruitment Limited
Independent learning provider
03/02/2012
54055
RW Rechere and Associates Ltd
Independent learning provider
10/02/2012
55459
Barford Education and Training (North East) Limited Independent learning provider
16/03/2012
58992
Dunelm Group Plc
Independent learning provider - employer 11/05/2012
52040
Greenspring Training
Adult and community learning provider
18/05/2012
59019
Rexel UK Limited
Independent learning provider - employer 29/06/2012
58193
Parenta Training Limited
Independent learning provider
26/07/2012
58716
Cornerstone (Leicester) Limited
Independent learning provider
09/08/2012
58991
LOTA Training
Independent learning provider
24/08/2012
130699
Totton College
Sixth form college
30/09/2011
130433
Coulsdon Sixth Form College
Sixth form college
21/10/2011
132980
Treloar College
Independent specialist college
10/11/2011
130665
Sussex Coast College Hastings
General further education/tertiary college 25/11/2011
130588
John Leggott Sixth Form College
Sixth form college
25/11/2011
130417
Southwark College
General further education/tertiary college 09/12/2011
130486
Knowsley Community College
General further education/tertiary college 10/02/2012
130621
Macclesfield College
General further education/tertiary college 24/02/2012
130413
Lambeth College
General further education/tertiary college 24/02/2012
130484
City of Wolverhampton College
General further education/tertiary college 24/02/2012
130586
Franklin College
Sixth form college
24/02/2012
50539
Aspin House
Independent specialist college
22/03/2012
130813
Stafford College
General further education/tertiary college 20/04/2012
URN
Provider name
Type of provider
Glossary
From September 2011 Ofsted categorises providers in the following ways:
Adult and community learning provider
Adult and community learning providers include local authorities, charities, voluntary and
community organisations, specially designated institutions, and community interest companies.
Their provision is diverse in character and aims to meet the needs and interests of a wide range of
communities. Courses include those leading to qualifications; programmes leading to qualifications
whilst in employment; provision for informal adult learning; provision for social and personal
development.
From 1 September 2012 Ofsted will be categorising these providers as community learning and
skills providers.
General further education college
General further education colleges offer a range of education and training opportunities for learners
aged from 14 years upwards, including adults.
Independent learning provider
A company which provides government funded education. The category independent learning
provider includes employer providers who only offer government funded training to their own
employees.
Independent specialist college
Independent specialist colleges provide education and training for students with complex learning
difficulties and/or disabilities, whose learning needs cannot be met by their local college or
provider.
Monitoring visits
Ofsted undertakes monitoring visits to providers previously judged to be satisfactory and where the
capacity to improve is less than good, or where providers have inadequate grades but are not
judged inadequate overall. The risk assessment process used to create the annual inspection
schedule can also trigger monitoring visits.
Next Step
information and advice services to support improvements in customers’ progression to sustainable
employment, or into education and training.
Offender learning
Ofsted undertakes judicial service inspections in partnership with HMI Prisons and HMI Probation.
Ofsted HMI evaluate the quality of learning and skills in prisons, including young offender
institutions and secure units for young people and also provision in community settings. From 1
January 2012, Ofsted no longer publishes reports for prison and young offender institutions. These
reports can now be found on the HMIP website:
http://www.justice.gov.uk/about/hmi-prisons
Ofsted contributes to a reduced number of judgements in these reports.
From 30 June 2012 Ofsted ceased to inspect probation trusts.
Sector subject areas
Sector subject areas are 15 groups of subjects as classified by the Office of Qualifications and
Examinations Regulation (Ofqual). Most subject areas have a number of secondary subject areas or
tiers. For example, subject area seven, retail and commercial enterprise, covers warehousing,
hospitality, hairdressing and beauty therapy, as well as retailing. In providers that offer second-tier
subjects, the area for inspection may be at that level and not the whole subject area. A full list of
sector subject areas can be found on the Ofqual website:
http://www2.ofqual.gov.uk/standards/142-statistics-articles/429-sector-subject-area-classification-system-ssac
Sixth form college
© Crown copyright
You may re-use this information (not including logos) free of charge in any format or medium, under the terms of the
Open Government Licence. To view this licence, visit
http://www.nationalarchives.gov.uk/doc/open-government-licence/
or write to the Information Policy Team, The National Archives, Kew, London, TW9 4DU or e-mail: