Contemporary Approaches to Research in Mathematics, Science, Health and Environmental Education 2010 1
for Getting Started with Your Research
Kathryn Meldrum
School of Education, Deakin University
[email protected]
At a time when numerical expression of data is becoming more important in the business of obtaining grant money research tools such as structural equation modelling (SEM) are becoming more popular. Structural equation modelling enables researchers to show relationships between variables numerically. It is of particular use to educational researchers who are interested in developing or using standard questionnaires in their research. This session will introduce SEM and explore its uses in educational research to enable the reader to decide whether it is a tool to use to add an extra dimension to their research findings.
Introduction
“Structural equation modelling (SEM) uses a variety of models to show the relationships between observed variables with the same basic goal of providing a quantitative test of a theoretical model hypothesised by a researcher.” (Schumaker & Lomax, 2010, p. 2). The models developed using SEM can be tested to show how sets of variables define concepts and how they are related. As an example, an educational researcher might hypothesise that a student’s home environment would affect their later academic achievement (Schumaker & Lomax, 2010). In this example the researcher believes, based on theory and observed research, that sets of variables related to the impact of an environment external to the school (the home) on learning are linked to academic achievement. The goal of SEM is to determine the extent to which the model is supported by the data that is gathered during research (Schumacker & Lomax, 2010).
Contemporary Approaches to Research in Mathematics, Science, Health and Environmental Education 2010 2
and use of SEM in educational research in order to assist the reader in deciding whether to adopt it as a methodology.
Deciding whether to use structural equation modelling
When deciding whether to use SEM in research it is important to consider the following four points as a rationale for adopting it as a methodology: Researchers are becoming more aware of the need to use multiple measured variables to better understand their research area. Basic statistical models are only useful for analysing a limited number of variables and are not appropriate for developing sophisticated theories. In contrast, SEM is capable of statistically modelling and testing complex phenomena and is therefore becoming the preferred method for confirming (or not) theoretical models, quantitatively (Schumaker and Lomax, 2010).
In addition, greater recognition is given to the validity and reliability of “observed scores from measurement instruments” (Schumaker and Lomax, 2010, p. 7). There is a concern that measurement error from statistical analysis is not being adequately accounted for in the literature (Schumaker and Lomax, 2010). Structural equation modelling avoids this issue as it accounts for measurement error when data analysis is conducted (Schumaker and Lomax, 2010).
The maturation of SEM over the last 30 years now allows for analysis of more advanced models. Multi-level modelling is now possible. For example, educators or policy makers interested in regional, school-level, teacher and student data can now model the inter-relationships between these areas through multi-level modelling (Schumaker and Lomax, 2010).
Finally, SEM software programs have changed significantly from the early versions in which researchers used matrix and Greek notation to input program syntax. Now, more user-friendly windows-based programs with pull-down menus and drawing programs which input syntax are available (Schumaker and Lomax, 2010).
Understanding the construction of structural equation models
Structural equation models are either measurement models or structural models. Measurement models describe the relationships between observed variables (measured through the survey or questionnaire) and the concepts that those variables are hypothesised to measure (Weston & Gore, 2006).
Figure one is a measurement model. Measurement models include latent variables, represented in the figure by ellipses, which are factors or concepts that are hypothetical and are not measured. The rectangles represent measured variables. These variables are measured by the survey responses. Single direction arrows indicate a correlation between the latent variables and the measured variables. Finally the paths are represented by bidirectional arrows.
Contemporary Approaches to Research in Mathematics, Science, Health and Environmental Education 2010 3
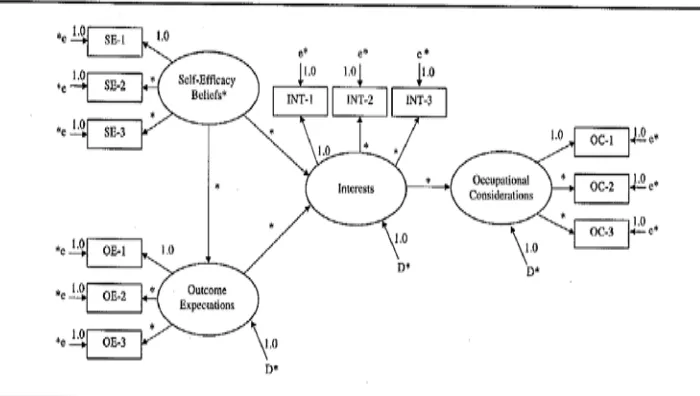
[image:3.595.119.469.152.350.2]Structural models specify hypothesised relationships among latent variables. In this example (figure 2) Weston and Gore (2006) hypothesise that a person’s self-efficacy beliefs and outcome expectations (right hand side of the model) are mediated by their interests which, in turn affects their occupational considerations (left hand side of the model).
Figure 2: A structural model (from Weston & Gore, 2006, p. 727)
Important Considerations when using Structural Equation Models
Once a decision has been made to use SEM as a research method the reader needs to decide whether they will adopt surveys that have already been developed and have been identified in the literature in the target research area as being valid and reliable. Or the reader may wish to develop their own. The reader needs to be aware that if they use of series of different previously developed surveys in their research that there may not be a strong relationship between them. This will affect the robustness of the model and the results.
Another very important consideration is your intended sample size. Most authors recommend a sample size of at least 100 to generate good results (Cunningham, 2008; Schumaker & Lomax, 2010; Weston & Gore, 2006; Worthington &Whittaker, 2006).
A sample size smaller than 100 will not be reliable and consequently SEM should not be used.
An Example from Educational Research
A 2009 article by Ravens-Sieberer and her colleagues examined the relationship between health and school experience. This study had 162, 306 participants in three age groups (11, 13 & 15 years). The study was conducted in 35 countries and regions of Europe, North America and Israel under the auspices of the World Health Organisation (WHO). The study used a WHO developed “Health behaviour in school-aged children survey” which had previously been developed by WHO.
The study hypothesised that there was a relationship between the following factors:
• Social support (classmates);
• School demands;
Contemporary Approaches to Research in Mathematics, Science, Health and Environmental Education 2010 4
• Academic achievement;
• Life satisfaction;
• Emotional health (last list)
This survey asked the students to respond to items through a variety of Likert scales. Each factor had the following item structure: Social climate (three items), demands (one item), school adjustment (two items) and health (one general question and eight items on psychosomatic symptoms). Life satisfaction was measured by the Cantrill ladder where the top of the ladder represented the best possible life (10) and the bottom the worst possible life (0) (Ravens-Sieberer et al., 2009). A cautionary note needs to be raised here - most authors in the area of SEM recommend that each factor has at least three items. The lowest possible number is two, and even then the items must have a correlation of 0.8 or above (Cunningham, 2008; Schumaker & Lomax, 2010; Weston & Gore, 2006; Worthington &Whittaker, 2006). This should been considered when interpreting the results of this study.
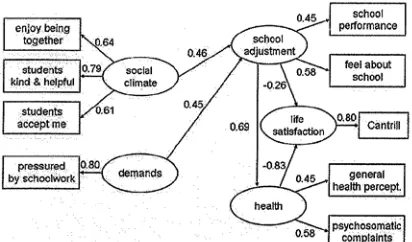
[image:4.595.209.415.353.474.2]Figure three below presents the results of the survey. It is evident that there is an overall stronger correlation with latent variables on the right hand side of the model in comparison with the left hand side. The correlation between the latent variables social climate and demands are not reported in the model, but are low (r = 0.21).
Figure 3: Structural equation model for results of survey (from Ravens-Sieberer et al., 2009)
Based on these results the researchers could have improved the correlations between latent variables by having more items in the survey, which may have improved the relationships between the latent variables on the left hand side of the model.
Contemporary Approaches to Research in Mathematics, Science, Health and Environmental Education 2010 5
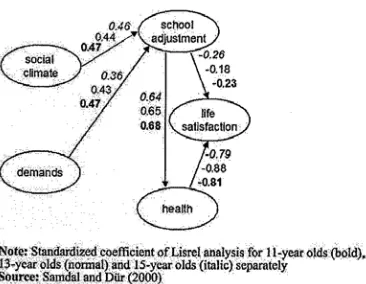
Figure 4: A comparison of correlation coefficients between latent variables between 11, 13 and 15 year old participants (from Ravens-Sieberer et al., 2009).
The results from this study demonstrate the importance of having sufficient numbers of items in each factor that support the development of a strong model. It is hoped that the illustration of this study will give the reader some indication of how SEM can be used in educational research.
Some ideas for moving forward with structural equation modelling
If the reader is interested in using SEM in their research it is recommended that an introductory SEM course is completed. The Australian Consortium for Social and
Political Research Incorporated (ACSPRI
regular courses at universities on the eastern Australian seaboard. In addition to this the articles and book listed in the reference list are a good place to start.
Conclusion
This paper discussed the historical development of SEM and considered a rationale and important considerations for its use as a research methodology. Structural equation modelling was then illustrated using an example from educational research. The reader is encouraged to undertake a SEM course and read widely in the area before adopting SEM as methodology.
References
Cunningham, E. (2008). A practical guide to Structural Equation Modelling using
AMOS. Melbourne: Statsline
Schumacker, R. E., & Lomax, R. G. (2010). A beginners guide to structural equation modeling. New York: Routledge
Ravens-Sieberer, U., Freeman, J., Kokonyei, G., Thomas, C. A., & Erhart, M. (2009). School as a determinant for health outcomes – a structural equation model
analysis. Health Education, 109 (4), 342-356.
Weston, R. & Gore, P. A. (2006). A brief guide to structural equation modeling. The Counseling Psychologist. 34 (5), 719 – 751.