PUPILS LEAVING FULL-TIME EDUCATION WITH NO QUALIFICATIONS,
2010/11
This Statistical First Release presents the results of an annual survey of schools in Wales which was established to monitor progress against Welsh Government performance indicator EDU/002. This survey reports on pupils in the final year of compulsory education (i.e. those aged 15 at the beginning of the academic year on 31/8/2010). For explanations of this indicator please see the Notes section, this includes information on the definitions of recognised qualifications and permitted pupil destinations.
Key Results
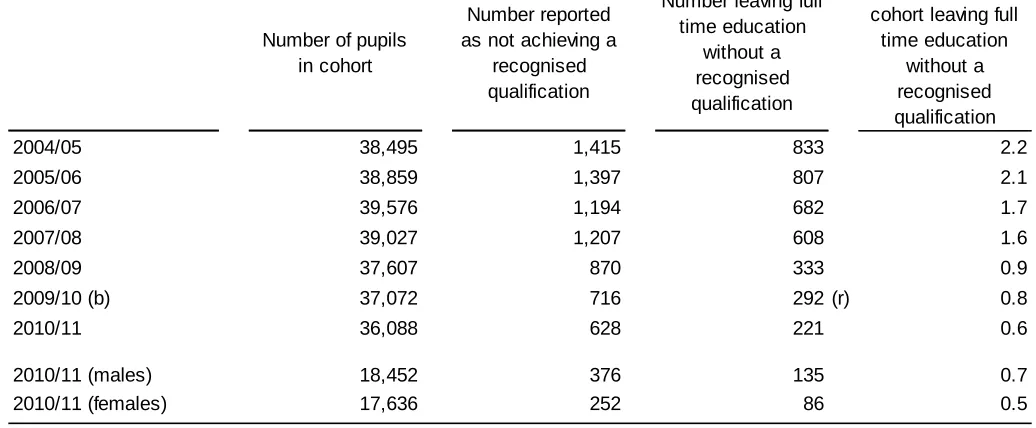
The number of pupils leaving full time education without a recognised qualification continues to fall – 0.6 per cent of pupils aged 15 left full time education without a recognised qualification.
• In 2010/11, 221 15-year-olds left full time education without a recognised qualification. This is lower than the 2009/10 total of 292 (Table 1);
• Expressed as a percentage of the cohort 0.6 per cent of pupils left full time education without a recognised qualification in 2010/11, 0.2 percentage points lower than in 2009/10 (Table 1);
• A greater percentage of boys than girls left without a qualification: 0.7 per cent and 0.5 per cent respectively (Table 1).
• The lowest percentage of 15 year olds leaving full time education without a recognised qualification was reported in Ceredigion with 0 per cent, the highest was Merthyr with 1.5 per cent (Table 2).
Chart 1: Number of pupils aged 15 leaving full time education without a recognised
qualification
221 608
333 833 807
682
292
0 100 200 300 400 500 600 700 800 900
2004/05 2005/06 2006/07 2007/08 2008/09 2009/10 (r)
2010/11 Girls Boys
Statistician: Stephen Hughes Tel: 029 2082 5056 E-mail: [email protected]
Next update: December 2012 (provisional)
Twitter: www.twitter.com/statisticswales | www.twitter.com/ystadegaucymru
Table 1: Number and percentage of pupils aged 15 leaving full time education without a
recognised qualification, as defined by performance Indicator EDU/002 (a)
Number of pupils in cohort
Number reported as not achieving a
recognised qualification
Number leaving full time education
without a recognised qualification
Percentage of cohort leaving full
time education without a recognised qualification
2004/05 38,495 1,415 833 2.2
2005/06 38,859 1,397 807 2.1
2006/07 39,576 1,194 682 1.7
2007/08 39,027 1,207 608 1.6
2008/09 37,607 870 333 0.9
2009/10 (b) 37,072 716 292 (r) 0.8
2010/11 36,088 628 221 0.6
2010/11 (males) 18,452 376 135 0.7
2010/11 (females) 17,636 252 86 0.5
(a) Pupils aged 15 at the start of the academic year in maintained, special and independent schools and Pupil Referral Units.
Table 2: Pupils aged 15 leaving full-time education without a recognised qualification, as defined by performance
indicator EDU/002, by LA, 2010/11 (a)(b)
Number of pupils in cohort
Number reported as not achieving a recognised
qualification
Percentage of those not achieving a qualification whose
destination was estimated
Number leaving full time education without a recognised qualification
Percentage of cohort leaving full time education without a recognised qualification
Isle of Anglesey 699 7 0 1 0.1
Gwynedd 1,414 17 0 3 0.2
Conwy 1,242 17 18 4 0.3
Denbighshire 1,334 25 0 11 0.8
Flintshire 1,774 20 0 7 0.4
Wrexham 1,303 9 0 4 0.3
Powys 1,545 14 7 2 0.1
Ceredigion 794 5 0 0 0.0
Pembrokeshire 1,281 27 0 15 1.2
Carmarthenshire 2,057 11 18 3 0.1
Swansea 2,557 33 15 11 0.4
Neath Port Talbot 1,703 17 0 7 0.4
Bridgend 1,544 28 0 11 0.7
The Vale of Glamorgan 1,646 43 0 9 0.5
Rhondda, Cynon, Taff 2,959 48 0 30 1.0
Merthyr Tydfil 672 13 23 10 1.5
Caerphilly 2,220 31 0 8 0.4
Blaenau Gwent 774 21 0 5 0.6
Torfaen 1,387 9 0 3 0.2
Monmouthshire 859 8 100 6 0.7
Newport 1,746 17 29 3 0.2
Cardiff 3,492 69 49 32 0.9
Wales (c) 36,088 628 23 221 0.6
(a) Pupils registered on roll on census day in January 2011. Age as at 31 August 2010.
(b) Pupils from Non English or Welsh based educational systems have been removed from LA figures, but are included in the figures for Wales.
Accessing the data electronically
The data behind the chart and tables in this release can be found on StatsWales (a free-to-use internet service that allows visitors to view, manipulate, create and download tables). Please select “Schools and Teachers” at the navigation screen of the following site: www.statswales.wales.gov.uk
Notes
1 Context
1.1 Policy/Operational
Performance indicator EDU/002 is defined in the National Performance Indicator Guidance for Wales 2010-11 published by the Local Government Data Unit. This indicator reports on pupils aged 15 on 31 August 2010 on roll on census day in January 2011 at maintained, special and independent schools and Pupil Referral Units.
1.2 Related Publications
Related data for Northern Ireland and Scotland can be found at the links below. Note that the data produced by Northern Ireland are based on pupils at the end of Key Stage 4, whereas we publish on the basis of pupils aged 15. Although the statistics are calculated on a slightly different basis the differences resulting from this are likely to be small. Comparisons cannot be made with Scotland because their examination system and qualifications are sufficiently different.
Developments are underway in Wales in moving towards producing indicators based on pupils at the end of Key Stage 4.
For further information or advice on the constraints of international comparisons please e-mail
Northern Ireland
Statistical Press Release: Qualifications and Destinations of Northern Ireland School Leavers 2009/10 Scotland
SQA Summary statistics for attainment, Leaver destinations and Free School Meals: 2009/10
2 Data Source
The figures in this release are based on a survey sent to all secondary schools in October 2011.
3 Definitions
3.1 Coverage
338 schools had pupils on roll aged 15 on 31 August 2010 on roll on census day in January 2011, of which 198 were estimated to have pupils not achieving a recognised qualification. 277 schools returned forms, which is a response rate of 82 per cent. The number not achieving a recognised qualification was estimated using data from the Welsh Examinations Database, while their destinations were estimated by looking at past trends in the school and trends in similar institutions.
Response rates:
• For 2011, returns were estimated for:
10 of the 221 maintained secondary schools in Wales (5%); 8 of the 38 special schools in Wales (21%);
13 of 28 pupil referral units in Wales (46%); 30 of the 51 independent schools in Wales (59%). • Response rates for all schools, 2005-2011:
2004/05 2005/06 2006/07 2007/08 2008/09 2009/10 2010/11 Number of schools w ith pupils aged 15 on roll 314 310 326 385 381 334 338 Number of schools w ho responded to the survey 286 297 312 370 376 328 277
Response rate (per cent) 91 96 96 96 99 98 82
The information in this release relates to all schools for Wales figures and to maintained secondary schools, special schools and pupil referral units for LA figures.
3.2 Definitions
‘Leaving education’ is defined as not remaining in school, not continuing elsewhere in full-time education and not continuing within work-based learning.
‘Work based learning’ is defined as a "…process of planned activities delivered in the work place which are specifically designed for developing the knowledge, skills and competencies relevant to particular occupations in the labour market, or generally relevant to effective participation in that market."
A 'recognised qualification' is defined as any qualification achieved by the end of the 2009/10 academic year which is approved for pre-16 use. Qualifications approved by the Minister for Children, Education, Lifelong Learning and Skills can be found in the Database of Approved Qualifications in Wales (DAQW).
4 Symbols
(r) data revised from data published 1st December 2010.
5 Key Quality Information
This section provides a summary of information on this output against five dimensions of quality: Relevance, Accuracy, Timeliness and Punctuality, Accessibility and Clarity, and Comparability. It also covers specific issues relating to quality of 2011 data, and describes the quality management tool applied to this area of work. Between September and November 2010 we conducted a public consultation on our Education Statistics outputs, in which we asked for feedback on the quality of the outputs. A summary of responses has been published and is available here:
5.1 Relevance
The statistics are used both within and outside the Welsh Government to monitor educational trends and as a baseline for further analysis of the underlying data. Some of the key users are:
• Ministers and the Members Research Service in the National Assembly for Wales; • The Department for Education in England;
• Other government departments;
• The Department for Education and Skills in the Welsh Government; • Other areas of the Welsh Government;
• The research community; • LAs and schools;
• Estyn, Her Majesty’s Inspectorate of Education and Training in Wales; • Wales Audit Office;
• Students, academics and universities;
• Individual citizens, private companies and the media.
These statistics are used in a variety of ways. Some examples of these are: • General background and research;
• Inclusions in reports and briefings; • Advice to Ministers;
• The all-Wales education core data packs (the replacement for the National Pupil Database); • LA and school comparisons and benchmarks;
• To inform the education policy decision-making process in Wales including school reorganisation; • To inform ESTYN during school inspections;
• Contributes to the National Performance Indicators; • To assist in research in educational attainment.
5.2 Accuracy
The data originates from schools but in the last few years local authorities have been involved in the collection of the data. Schools and local authorities have had an opportunity to assess the estimates for accuracy, and have supplied amended information where applicable.
5.3 Timeliness and Punctuality
School are given two weeks to sign off their data and return the forms to their local authority. Local authorities then have an additional week to validate their schools’ data and submit their returns to the Welsh Government.
5.4 Accessibility and Clarity
This Statistical First Release is pre-announced and then published on the Statistics section of the Welsh Government website. It is accompanied by more detailed tables on StatsWales, a free to use service that allows visitors to view, manipulate, create and download data.
5.5 Comparability
This release reports on the current National Performance Indicator EDU/002. NAWPI 2.7 was the indicator used before 2004. Historical data relating to NAWPI 2.7 is available on request.