Int. J. Electrochem. Sci., 13 (2018) 11752 – 11761, doi: 10.20964/2018.12.36
International Journal of
ELECTROCHEMICAL
SCIENCE
www.electrochemsci.org
Study of Some Physical Properties of Ni
yFe
0.025Mg
0.975-yO
Nanoparticles Prepared by the Sol-Gel Method
Entisar E. Al-Obodi1, Tagreed M. Al-Saadi2,*, Alaa F. Sulaiman1 1
Department of Chemistry, College of Education for Pure Science-Ibn Al-Haitham, University of Baghdad, Baghdad, Iraq
2
Department of Physics, College of Education for Pure Science-Ibn Al-Haitham, University of Baghdad, Baghdad, Iraq
*
E-mail: [email protected]
Received: 17 July 2018 / Accepted: 10 October 2018 / Published: 5 November 2018
(NiyFe0.025Mg0.975-yO) nanoparticles with (y = 0.0, 0.025, 0.050, 0.075 and 0.1) were prepared using the sol-gel / auto-combustion method. The electrical, morphological and structural properties of the products were characterized and determined in detail by (XRD), energy dispersive X-ray spectroscopy (EDX) and scanning electron microscopy (SEM). X-ray analysis showed the lattice parameter (a) decreased from 4.218 Å to 4.207 Å with increasing nickel content. The grain size (D) was found in the range of 13.55 - 21.12 nm by using Scherrer formula. Dielectric properties (dielectric constant, dielectric loss and conductivity) were studied as a function of frequency at room temperature. Significant improvements were observed in the dielectric properties with the addition of nickel ions.
Keywords: Doped-MgO, Nanoparticles, Auto-Combustion, Dielectric properties, EDX, SEM, XRD.
1. INTRODUCTION
Metal oxides play a substantial role in many fields of materials science, physics, and chemistry. Among metal oxides, MgO is capable of creating a large family of derivative oxide compounds.
has a positive effect on their chemical and physical properties, including optical, magnetic, and electrical properties. Most of these properties help improve factors such as the degree of concentration calcination and user-acid fuel heat. Magnesium oxide has an (f.c.c) and a lattice constant (a = 4.212 nm) [4-7]. Magnesium oxide nano particles has been prepared using many methods, including biosynthetic [8-10], microwave assisted sol-gel [11], hydrothermal [12], sol-gel [13], phytoassisted [14], quick precipitation[15], and solvent mixed spray pyrolysis [16] methods.
There are many studies on MgO doping and the effect of these ions on the properties of MgO such as Mn-doped MgO nanoparticles [17], Ag-doped MgO nanoparticles [18], Fe-doped MgO nanoparticles [19], Ni-doped MgO nanoparticles [20], and Cu-doped MgO nanoparticles [21].
The aim of this research was to prepare (NiyFe0.025Mg0.975-yO) nanoparticles with (y = 0, 0.025, 0.050, 0.075 and 0.1) and to study the effect of varying Ni content on the structural and dielectric properties to gain valuable information for the use of these nanoparticles in practical applications.
2. EXPERIMENTAL METHOD
Nano-sized (NiyFe0.025Mg0.975-yO), where y = 0, 0.025, 0.050, 0.075 and 0.1 (the samples are denoted a, b, c, d, and e, respectively) were prepared by the sol-gel method using iron nitrate (Fe(NO3)2.9H2O, 98.5%), magnesium nitrate (Mg(NO3)2.6H2O, 99%), and nickel nitrate (Ni(NO3)2.6H2O, 99.5%) as precursors and citric acid (C6H8O7.H2O, 99%) as a fuel for the ignition process. All chemicals were purchased from Merck, India and used without any further purification. All these materials were dissolved separately in 200 ml of distilled water. A 1:1 molar ratio of nickel nitrate, magnesium nitrate and iron nitrate solution was prepared. The pH of the solution was adjusted to 7 using ammonia. The resultant solution was heated at 90 °C using a magnetic stirrer hot plate until a gel was formed. After that, the temperature was increased to 220 °C and then ignited in a sol-gel auto-combustion method to form a nanopowder. The as-burnt resultant powder was then calcined at 800 °C for 2 h.
X-ray diffraction (Shimadzu XRD-6000) was used to investigate the structural properties. The morphological properties were examined by a scanning electron microscope (SEM) (SEM Inspect S50), and electron dispersive X-ray spectroscopy (EDX) was used for the elemental analysis. The dielectric characterization was investigated by using an LCR meter (LCR-8105G - GW INSTEK, Taiwan) in the frequency range of 50 Hz-1 MHz
3. RESULTS & DISCUSSION
3.1. X-ray diffraction
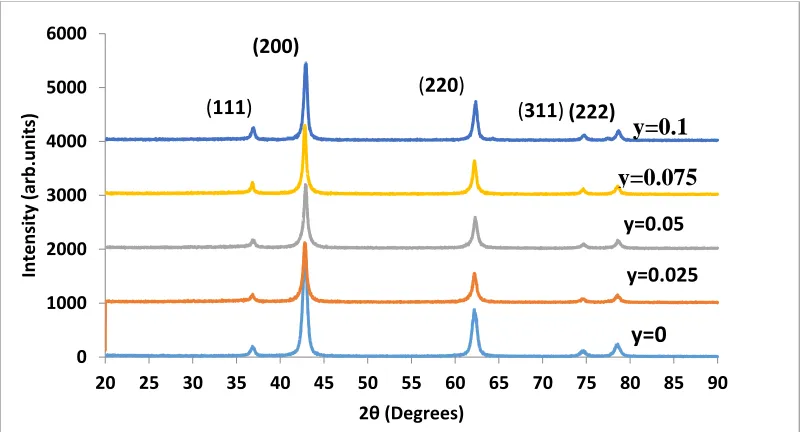
Figure 1. XRD pattern of the (NiyFe0.025Mg0.975-yO) samples.
The average grain size (D) of the samples was measured from the X-ray diffraction line broadening using Scherrer’s equation [22].
D = K λ / β cos θ …. (1)
The average calculated grain size (D) was between 13.55-21.12 nm, indicating that the grain size increases with increasing Ni content [23], as shown in (Table 1). This result is attributed to the increase of molecules at the crystallite surface, resulting in improved grain growth [24]. The value of the obtained lattice constant a= 4.218 Å of pure MgO was slightly larger than the value reported in (JCPDS Card No: 45-0946, where a= 4.211 Å). The measured lattice parameter decreased to (a =4.207 Å) with increasing Ni content as shown in (Table 1). This result is likely attributed to several mechanisms, the first of which could be due to the smaller ionic radius of Ni (0.74 Å) compared to that of Mg (0.86 Å). This result may also be due to the changes in the magnesium oxide bond length and the overall lattice parameter [25].
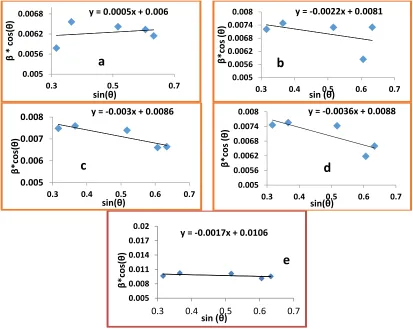
The grain size was also calculated by the Williamson-Hall equation [26], which takes into account the microstrain that the grains face as a result of different reasons.
(
)
Here, K: constant, D: average grain sizes, and λ: wavelength of Cu kα radiation. The equation is plotted with βhkl cos on the y-axis and sin on the x-axis for all samples [26, 27]. Particle size and strain are measured from the slope and y-intercept of the fitted line, respectively. The W-H plots are depicted in figure 2, and the results are shown in table (1). Although the grain sizes calculated by the W-H equation are not identical to those calculated by the Scherrer equation, this can be attributed to the microstrain in which the grain size is generally smaller when the microstrain is negative, where the strain might be due to the lattice shrinkage [28]. In contrast, the W-H grain sizes exhibited the same trend as those calculated by the Scherrer equation.
0 1000 2000 3000 4000 5000 6000
20 25 30 35 40 45 50 55 60 65 70 75 80 85 90
In
tens
ity
(a
rb.u
nits
)
2θ (Degrees) (111)
(200)
(220)
(311)(222)
y=0 y=0.025 y=0.05
[image:3.596.98.500.70.286.2]Figure 2. (a, b, c, d and e) Williamson-Hall plot of the (NiyFe0.025Mg0.975-yO) samples.
Table 1. Lattice parameter (a) and grain sizes of the (NiyFe0.025Mg0.975-yO) samples.
Sample y content a(Å) DScherrer DWilliamson-Hall (ε)
a 0 4.218 21.12 23.1 0.2
b 0.025 4.212 18.51 19.47 -0.55
c 0.050 4.211 18.34 17.11 -0.75
d 0.075 4.208 18.24 15.75 -0.9
e 0.1 4.207 13.55 13.07 -0.425
The texture coefficient (TC) of all samples was calculated using the Harris formula:[29]
⁄
∑ ⁄
Where N is the reflection number, hkl are Miller indices, Io(hkl), is the criterion intensity of the (hkl) taken from the (JCPDS Card No: 45-0946) and I(hkl) is the measured relative intensity of a plane (hkl). The results are shown in table 2. We observed that the increased nickel content plays a basic role in changing the texture coefficient (TC). A slight preference was observed for crystal growth at the (222) and (220) lattice planes, and a slight decrease over the other (200) plane. All samples had an almost perfect forming factor, with the formation factor approaching (1) for the (220) and (222) surfaces, while the surface (200) suffered from a lack of growth due to the high energy required by the growth of this surface [30].
y = 0.0005x + 0.006
0.005 0.0056 0.0062 0.0068
0.3 0.5 0.7
β * cos (θ ) sin(θ)
a
y = -0.0022x + 0.0081
0.005 0.0056 0.0062 0.0068 0.0074 0.008
0.3 0.4 0.5 0.6 0.7
β *cos ( θ ) sin (θ)
b
y = -0.003x + 0.0086
0.005 0.006 0.007 0.008
0.3 0.4 0.5 0.6 0.7
β*cos
(θ
)
sin(θ)
y = -0.0036x + 0.0088
0.005 0.0056 0.0062 0.0068 0.0074 0.008
0.3 0.4 0.5 0.6 0.7
β* cos ( θ ) sin(θ)
y = -0.0017x + 0.0106
0.005 0.008 0.011 0.014 0.017 0.02
0.3 0.4 0.5 0.6 0.7
β*cos
(θ
)
sin )θ)
d
[image:4.596.122.478.484.568.2]
Table 2. The results of X-ray diffraction data of the (NiyFe0.025Mg0.975-yO) samples.
Samples y content TC (200)
TC (220)
TC (222)
a 0 0.91477 1.07896 1.00625
b 0.025 0.86795 1.09050 1.04154
c 0.05 0.86156 1.10456 1.03387
d 0.075 0.87443 1.07623 1.04932
e 0.1 0.86795 1.09050 1.04154
3.2. SEM analysis
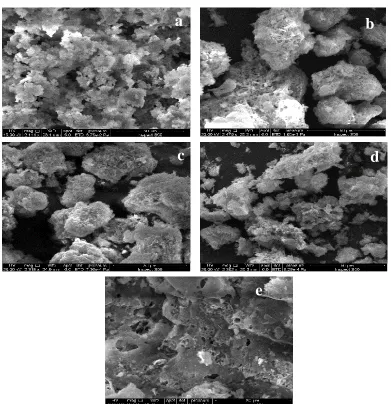
Scanning electron microscopy measurements were performed to analyze the structure and morphology of the synthesized samples. The obtained SEM images of all samples are shown in Fig 3. It was found that the particles were regular in shape and that the grains had a spherical or semi-spherical shape, although we noticed the presence of agglomeration in some regions.
Figure 3. (a, b, c, d and e) Scanning electron microscopy images of the (NiyFe0.025Mg0.975-yO) samples.
a
b
c
d
This result has been observed in other works due to the limited magnification power of the SEM device [29].
3.3. Energy dispersive X-ray
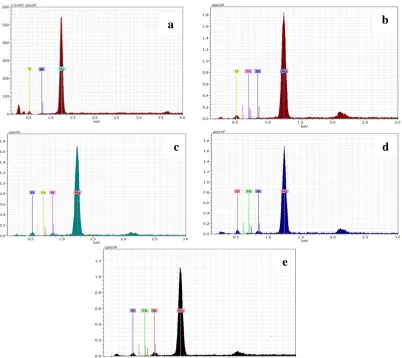
Energy dispersive X-ray (EDX) spectra of the respective samples are shown in Fig 4. The peaks corresponding to the elements Mg, Fe and O were observed in the FM sample, and the peaks corresponding to Mg, Ni, Fe and O are shown in the (NiyFe0.025Mg0.975-yO) spectra. These data indicate that the auto-combustion method is successful because there is no elemental loss during the synthesis process [30].
Figure 4. (a, b, c, d and e) Energy dispersive X-ray spectra of the (NiyFe0.025Mg0.975-yO) samples.
3.4. Dielectric properties
After the nanopowders had been pressed into pellets (15mm in diameter and 25 mm in thickness and examined by LCR meter, the dielectric constant was calculated by equation [31] :
……….(4)
b
e
d c
[image:6.596.102.504.264.622.2]
where C is the value of capacitance, d is the thickness (cm), A is the surface area (cm2) and is the permittivity of air.
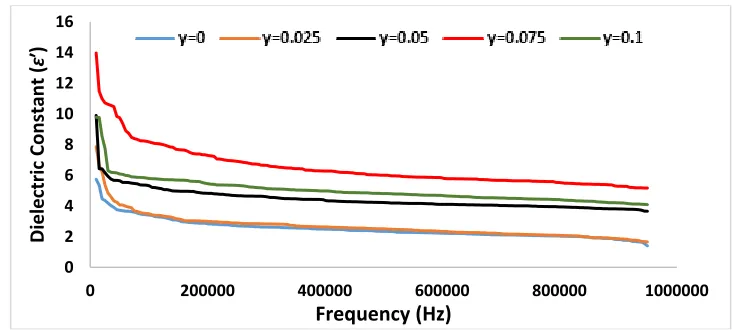
Figure (5) shows the change in the dielectric constant of the (NiyFe0.025Mg0.975-yO) compounds with frequency. We observe that the dielectric constant decreases with increasing frequency for all Ni-doped samples, and this result can be explained by a Debye-type relaxation process [31]. However, we observed that the dielectric constant increased with the increase in the nickel content and that the maximum value of this constant was at a ratio of 0.075 at 5 KHz. The sample with a doping concentration of y = (0.075) had the highest dielectric constant, which can be interpreted as an increase in nickel that will decrease the lattice binding energy and thus increase the oxygen vacancies, leading to an increase in the mobility of oxygen ions. The dielectric constant will increase as a result of more mobile oxygen ions [33], as seen in the work of others [32]. For the dielectric loss factor (ɛ′′), Figure 6 shows that it had the same behavior as the dielectric constant because of the direct relationship between the two according to equation [34]:
ɛ′′=tanδ ɛ' ………(5)
where tanδ is the loss tangent. The ability of these materials to store charges when placed in an electric field can be represented by (ɛ') [35]. A.C conductivity ( ) is expressed by equation [31]:
tanδ ……….(6)
[image:7.596.113.481.442.607.2]The variation of A.C conductivity ( ) for all samples as a function of frequency is shown in figure 7. The conductivity of (Ni yFe 0.025 Mg 0.975-y O) nanoparticles increased with increasing frequency. This result may be attributed to the rotation of dipoles when polarization between two equivalent equilibrium positions is involved [28].
Figure 5. The dielectric constant versus frequency for (NiyFe0.025Mg0.975-yO) samples.
Additionally, we observed that the conductivity ( ) increased with increasing Ni content for all samples, and the maximum value of was measured when y = 0.075 at 5 KHz. The decreasing gap within conductors may be the reason for the increase in A.C. conductivity when increasing the Ni content. Moreover, there is an additional reason that a few continuous conducting networks are formed when the frequency increases suddenly. In this region, a small change in f causes an unexpected increase in conductivity, which means that the material becomes a conducting material [36]; thus, in this case, the electrons can move similarly in a normal conducting material [37].
0 2 4 6 8 10 12 14 16
0 200000 400000 600000 800000 1000000
Dielec
tric C
onstant (
ɛ
′)
Figure 6. The dielectric loss factor versus frequency for (NiyFe0.025Mg0.975-yO) samples.
Figure 7. A.C conductivity versus frequency for (NiyFe0.025Mg0.975-yO) samples.
4. CONCLUSION
(NiyFe0.025Mg0.975-yO) nanoparticles, where y = 0,0.025, 0.050, 0.075 and 0.1, were prepared by the auto-combustion method. (XRD) confirmed that the lattice constant in the cubic structure was decreased with increasing Ni content. The grain size was found to be on the nanoscale by using Scherrer and Williamson-Hall analyses. From the SEM images, we observed that the grains were regular and had spherical or semi spherical shapes, in addition to some agglomeration of the nanoparticles. The dielectric loss, dielectric constant and conductivity were studied as a function of frequency, and we found that these properties were affected by the presence of Ni.
References
1. S. Sarıtaş, T. Çakıcı, G. Merhan Muğlu, M. Kundakcı, and M. Yıldırım, AIP Conf. Proc., 1815, (2017) 050013.
2. S. Dayou, B. Vigolo, J. Ghanbaja, M. Izhar Kairi, M. Khairul, N. Mohd Zuhan and R. Mohamed, 0
2 4 6 8 10 12
0 200000 400000 600000 800000 1000000
Dielec
tric Los
s
Fac
tor (
ɛ
′′)
Frequency (Hz)
0 0.0000002 0.0000004 0.0000006 0.0000008 0.000001 0.0000012 0.0000014 0.0000016 0.0000018
0 200000 400000 600000 800000 1000000
AC Conductivit
y
(S
.cm
-1)
[image:8.596.118.480.70.235.2] [image:8.596.114.479.270.448.2]
Mater. Chem. Phys., 202 (2017) 352.
3. Mostafa Y. Nassar, Talaat Y. Mohamed, Ibrahim S. Ahmed and Ihab Samir, J. Mol. Liq., 225 (2017) 730.
4. Q. Zhu, A. R. Oganov and A.O. Lyakhov, Phys. Chem. Chem. Phys., 15 (2013) 7696.
5. G. Dercz, K. Prusik, L. Pająk, R. Pielaszek, J. J. Malinowski, W. Pudlo, J. Mat. Sci. Poland, 27 (2009) 201.
6. Hakimeh Mirzaei and Abolghasem Davoodnia, Chin. J. Catal., 33 (2012) 1502.
7. S. K. Moorthy, CH. Ashok, K.V. Rao and C.Viswanathan, Material Today: Proceedings, 2 (2015) 4360.
8. Renata Dobrucka, Iran J. Sci. Technol. Trans. Sci., 42 (2018) 547.
9. J. Suresh, R. Yuvakkumar, M. Sundrarajan and S.I. Hong, Adv. Mater. Res., 952 (2014) 141. 10.M. Hakimeh and D. Abolghasem, Chin. J. Catal., 33 (2012) 1502.
11.Zhen-Xing Tang and Bin-Feng Lv, Brazilian J. Chem. Eng., 31 (2014) 591.
12.Rizwan Wahab, S. G. Ansari, M.A. Dar, Y.S. Kim and H.S. Shin, Mater. Sci. Forum, 558-559 (2007) 983.
13.G.Sharma, R.Soni and Dut Jasuja, J. Taibah University for Science, 11 (2017) 471.
14.S. Devi Meenakshi, M. Rajarajan, Susai Rajendran, Z. Robert Kennedy and G. Brindha, Elixir Nanotechnology, 50 (2012) 10618.
15.K. R. Nemade and S. A.Waghuley, Int. J. Met., ID 389416 (2014) 4 pages.
16.Md. Hussain Basha, N. O. Gopal, J. L. Rao, H. Nagabhushana, B. M. Nagabhushana, and R. P. S. Chakradhar, AIP Conf. Proc., 1665 (2015) 050152.
17.PanelYunchengCai, DanWu, XiweiZhu, WeiWang, FatangTan, Jianguo Chen, Xueliang Qiao and Xiaolin Qiu, Ceram. Int., 43 (2017) 1066.
18.S. Phokha, J. Klinkaewnarong, S. Hunpratub, K. Boonserm, E.Swatsitang and S. Maensiri, J. Mater. Sci. Mater. Electron., 27 (2016) 33.
19.Jeetendra Kulkarni, R. Ravishankar, H. Nagabhushana, K. S. Ananthraju, R. B. Basavraj, L. Renuka, Ind. J. Adv. Chem. Sci., S1 (2016) 64.
20.Tagreed M. Al-Saadi and Radhwan Shopan Al-Afraijy, Sci. Int. (Lahore), 30 (2018) 347. 21.S. Singha, J. Kaur, T. Namgya, R. Sharma, Physica B: Condensed Matter, 407 (2012) 1223. 22.Tagreed M. Al-Saadi1, Ahmed H.Abed, Ayad Ahmed Salih, Int. J. Electrochem. Sci., 13 (2018)
8295.
23.A.Manikandan, J. Judith Vijaya, L. John Kennedy and M. Bououdina, J. Mol. Struct., 6 (4) (2013) 332.
24.G. Aravind, D. Ravinder and V. Nathanial, Phys. Res. Int., ID 672739 (2014) 11 pages.
25.24. Ziad T. Khodair, Tagreed M. Al-Saadi and Ahmed H. Abed, J. Adv. Phys. Theor. Appl., 60 (2016) 1.
26.Tagreed M. Al-Saadi, Ziyad T. Khodair, Noor A. Hameed, T. A. Al- Dhahir, Eng. & Tech. Journal, 33 B (2015) 960.
27.Y. T. Prabhu, K. V. Rao,V. S. Sai Kumar, B. S. Kumari, World J. Nano Sci. Eng., 4 (2014) 21. 28.C. Barret and B. T. Massalski,"Structure of Metals" Book, Oxford Pergamon, (1980).
29. Pathan Amjadkhan Noorkhan and Sangshetty Kalayne, Int. J. Modern Eng. Res., 2 (2012) 1757. 30.A. Varma, A. S. Mukasyan, A. S. Rogachev, and K. V. Manukyan, Chem. Rev., 116 (2016) 14493. 31.F. I. Hussain, R. A. Najem, J. Phys.: Conf. Series, 1003 (2018) 012097.
32.Mukhlis M. Ismail and Nasma A. Jaber, Iraqi J. Phys., 16 (2018) 140.
33.N. Nadia Mohd Salima, Z. Arifin Ahmad and J. Juliewatty Mohamed, Procedia Chemistry, 19 (2016) 133.
34.Hideyuki Emoto and Junichi Hojo, J. Ceram. Soc. Jpn., 4 (1992) 100.
35.Wenying Zhou, Ying Gong, Litao Tu, Li Xu, Wei Zhao, Jiangtao Cai, Yating Zhang and Anning Zhou , J. Alloys Compd., 693 (2017) 1.