Int. J. Electrochem. Sci., 4 (2009) 1593 - 1606
International Journal of
ELECTROCHEMICAL
SCIENCE
www.electrochemsci.org
Novel Method for the Determination of Haemoglobin
Phenotypes by Cyclic Voltammetry using Glassy Carbon
Electrode
M. Ogunlesi1,*, W. Okiei1, A. S. Akanmu2 and T. Popoola1, K. Okafor1, and O. Akore1
1
Chemistry Department, University of Lagos, Lagos, Nigeria
2
Department of Haematology and Blood Transfusion, College of Medicine, University of Lagos, Lagos, Nigeria
*
E-mail: [email protected]
Received: 23 April 2009 / Accepted: 11 November 2009 / Published: 1 December 2009
Haemoglobin is the oxygen transporter within the red blood cell. The oxygenation reaction is accompanied by release or uptake of protons depending on the pH. The electroactive nature of the reaction between haemoglobin and oxygen renders the binding study suitable for investigation by electrochemical method. Haemoglobin samples prepared from blood samples of known phenotypes were diluted with 0.2M acetate buffer, pH 5.0, to give stock solutions of concentration 2 x 10⁻⁵ mol. Fe/dm3. Aliquots were drawn and diluted with the buffer and cyclic voltammetry was carried out under nitrogen using glassy carbon/Ag, AgCl/Pt electrode system. 1.4 x 10⁻⁷ mol.Fe.dm-3. The values of peak current obtained were in the range of 3.1 – 3.6 µ A for HbA, 1.7 – 2.2 µA for HbAS, 1.2 – 1.6 µA for HbS and 2.5 – 3.00 µA for HbAC in the fixed range of concentrations of the haemoglobins. These values were used to identify the phenotypes of several haemoglobins successfully. The values of the peak current are sufficiently distinct to allow for rapid determination of these phenotypes. The method is simple and faster than the conventional electrophoretic method and removes the need to use standards once the characteristic values of peak current have been established. The good correlation between peak current and concentration also provides an accurate determination of the concentrations of haemoglobin samples.
Keywords: Phenotypes, cyclic voltammetry, glassy carbon electrode
1. INTRODUCTION
oxygenation [1]. The reaction between deoxygenated haemoglobin and oxygen is reversible and occurs according to the pH dependent equation shown below [2, 3].
Hb + nO2⇌ (HbO2)n + xH+ (n = 2.8)
At pH values of about 6, x is positive reaching a maximum around pH 7, thus oxygenation at pH values in this range is accompanied by release of protons. This phenomenon is the alkaline Bohr effect. For pH values below 6, x is negative, thus oxygenation is accompanied by uptake of protons from the medium and this phenomenon is the acid Bohr effect. The value of the number of moles of protons associated with alkaline Bohr effect of various mammalian haemoglobins stripped of 2, 3-diphosphoglycerate varies over a small numerical range. However, in the case of the acid Bohr effect of vertebrate the range is much appreciable. This large range in the value of x could make it possible to use this value to distinguish haemoglobins to some extent. In fact the values of the acid Bohr effect at pH below 6 have been reported to be dependent on the nature of the vertebrate haemoglobins [4, 5, 6]. The Bohr effect is also expressed mathematically as
d log p½ O2 = - △h+ dpH
where p½ O2 is the oxygen pressure when haemoglobin is half saturated with oxygen and ∆h+ is the
number of mole equivalent of hydrogen ion produced when one mole equivalent of oxygen reacts with haemoglobin. The hydrogen ions arise from the effect of oxygenation of haemoglobin on the pK of ionizing groups on the protein [7, 8].
Beetlestone et al measured the moles of protons accompanying oxygenation, that is the Bohr effect, by direct titrimetric method [4]. The normal adult haemoglobin is labeled A. However, there are variants found in the black race, namely the homozygous S, C and the heterozygous AS, AC, SC and SF. Haemoglobin S is the most common haemoglobin variant found in the United States followed by haemoglobin C. Approximately 2 – 3% of African American in the United States are AC heterozygotes [9].
Homozygous S gives rise to sickle-cell anaemia; the red cells from such patients sickle in vitro with reduced oxygen concentration. Fibrous precipitate is formed when a concentrated solution of sickle cell haemoglobin is deoxygenated and electron micrographs of fibers of deoxy HbS have been obtained [10].
Haemoglobin C is an abnormal haemoglobin in which there is reduced plasticity of the red blood cells [11, 12].
crystals that make the red cell subject to effector cell removal. Thus homozygous inheritance of the C gene may not present with feature of sickling syndrome but patient may present with mild anaemia [13].
In heterozygous, subjects, about 28-44% of the total haemoglobin is HbC and no anemia develops. In homozygotes, nearly all the haemoglobin is in the HbC form and there is mild hemolytic anemia.
Unlike HbA and HbF that may prevent deoxygenated HbS tactoid formation, HbC when co-inherited with HbS coprecipitates with HbS and the patients do present with sickling syndromes although in a milder form when compared with HbS inheritance [16]
Haemoglobins A, S and C differ only in the amino acid present at the 6th position of the β -chain, thus only two amino acid differences occur in a tetramer. The first eight amino acids in the β -chain of the three haemoglobins are listed below
β-chain 1 2 3 4 5 6 7 8 HbA Val - His - Leu - Thr - Pro - Glu - Glu - Lys HbS Val - His - Leu - Thr - Pro - Val - Glu - Lys HbC Val - His - Leu - Thr - Pro - Lys - Glu - Lys
The position β6 in normal haemoglobin, HbA, is occupied by glutamate which is negatively charged at physiological pH, while valine at the corresponding position in HbS is neutral and lysine at the corresponding position in HbC is positively charged. [17, 18].
Position β6 is at the surface of the molecule and hence interacts with solvent [19]. The amino-acid substitutions in the abnormal haemoglobins S and C indicate that the net charge on each of them will differ and also differ from that on haemoglobin A; specifically the net charge on HbA is 2 units less positive than that of HbS while HbC is 2 units more positive than that of HbS.
The values of the isolelectric point for oxyhaemoglobins A, S and C are 6.87, 7.09 and 7.45 respectively and this is the expected trend from their net charges [16].
Haemoglobins A, S and C have different electrophoretic mobility arising from the differences in net charge on the molecules.
The heterozygous haemoglobins AS, AC, SC and SF would each give two spots on electrophoresis corresponding to the constituent haemoglobins. Haemoglobin AS contains a maximum of 50% of HbS [18].
More than 900 variants of human haemoglobins are known and the common methods used for analysis or determination of phenotypes to identify them include conventional electrophoresis on cellulose acetate, chromatographic assays, HPLC retention times, capillary electrophoresis and the recently introduced technique applying mass spectrometry (MS). The application of MS is reported to improve the sensitivity of haemoglobin analysis while the combination of MS with electrophoretic and chromatographic methods is declared optimal for the detection of variants [20, 21, 22].
Since the oxygen binding reaction is electroactive it should be possible to investigate it by electrochemical methods. The direct electrochemical reaction of bonded oxygen in bovine oxyhaemoglobin was examined for the first time on a bare glassy carbon (GC) electrode by Chen et al [23] using cyclic voltammetry (CV).
The study demonstrated that the reaction involved the bonded oxygen not the heme iron, that is, the reaction was the electrochemical reduction of HbO2. The peak potential was pH dependent and
the peak current attained a maximum value in 0.2M acetate buffer at pH 5.0. It was also observed that surfactants such as hexadecyltrimethylammonium bromide promoted the electrochemical reaction and the peak current was found to be linearly proportional to the concentration of HbO2.
Following the findings of Chen et al [23], it would thus be expected that the peak current that would be obtained for HbA, S and C at pH 5.0 would differ significantly because of the differences in their net charge and thus the values of the peak current obtained during the electroreduction reaction could be used to identify them.
The aim of this study is to measure the values of peak current for human haemoglobins of various phenotypes, namely A, S, C, AS, AC, SC and SF accompanying the electrochemical reaction and apply the results as a tool for the determination of phenotypes. In this report, we present the results of the values of peak current obtained for some of these haemoglobins in 0.2M acetate buffer, pH 5.0 using bare glassy carbon (GC)/Ag, AgCl/Pt electrode system.
Cyclic voltammetry is an electrochemical procedure in which electroactive species in solution at a certain initial potential are subjected to a linear alteration in potential up to a limiting value (switching potential) after which the direction of the potential scan is reversed and linear alteration in potential is applied until the initial value is attained. Thus species are oxidized in the first scan and reduced on the reverse scan. The peak current can be a measure of various parameters such as concentration of analyte or rate of electron transfer between the electroactive species and the working electrode.
2. EXPERIMENTAL PART
2.1. Preparation of Haemoglobin Samples
Whole blood samples of known phenotypes A, S, AS and AC were obtained from the Haematology Laboratory of the Lagos University Teaching Hospital (LUTH), Lagos between August 2007 and June 2008. The haemoglobin samples were extracted within three days of drawing the blood samples. The blood was centrifuged (10,000 r.p.m.) in the cold for five minutes, washed three times with double volume cold saline (9.5g NaCl/dm3) with centrifugation in between washings, till the supernatant was colourless after which the packed cells were lysed by shaking with ice-cold water of equal volume. After centrifugation, the haemoglobin was filtered off on sterile gauze and the concentration (mol.Fe/dm3) was determined using Drabkin’s solution, measuring the absorbance at 540nm and using extinction coefficient value of 10.9 x 10³. The visible spectra of the samples were obtained and confirmed to correspond to that of HbO2. The haemoglobin was diluted with cold 0.2M
acetate buffer, pH 5.0 prepared with de-ionized water to give stock solutions of concentrations in the range 1.4 – 2 x 10⁻⁵ mol. Fe/dm3.
2.2. Cyclic Voltammetric Analysis
The method is similar to the procedure used by Chen et al [23].
The voltammetric measurements were carried out with a BASI-Epsilon Potentiostat/Galvanostat. A single compartment cell with a three-electrode configuration was used. The working electrode was made of glassy carbon while silver/silver chloride served as the reference electrode. A platinum electrode served as the auxiliary (counter) electrode. Before each experiment, the glassy carbon electrode was polished with 0.05 µm alumina and 0.01µm alumina sequentially, till a mirror-like surface was obtained. It was then placed in a freshly-prepared pyrana solution for 10 minutes after which it was thoroughly rinsed with de-ionized water.
Preliminary experiments in our laboratory had shown that the value of the peak current attained a maximum value at pH 5.0 for haemoglobins A, AS, S and AC in agreement with the observation of Chen et al [23] in the study on bovine haemoglobin hence the cyclic voltammetry was carried out at this pH.
The acetate buffer (10cm3) in the cell to which 20 µl of the stock haemoglobin solution was added was purged with nitrogen for 10 minutes. Cyclic voltammetry was carried out using the following operating conditions: initial potential 300 mV, switching potential -400 mV, final potential 300 mV, scan rate 20 mV/s, number of segments 2, Quiet time zero, full scale current 10 µA. The peak current for each voltammogram was recorded at -220 mV. The experiment was repeated with addition of 50µ l and 70 µl of haemoglobin sample to each 10 cm3 portion of the buffer.
Whole blood samples of undisclosed phenotypes were also collected and processed as before to determine the values of peak currents and their phenotypes were inferred from the data on values of peak currents obtained previously.
3. RESULTS AND DISCUSSION
This study is the first report of analysis of some human haemoglobin variants by electrochemical reactions using cyclic voltammetry.
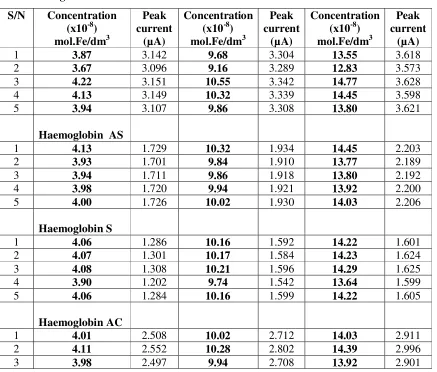
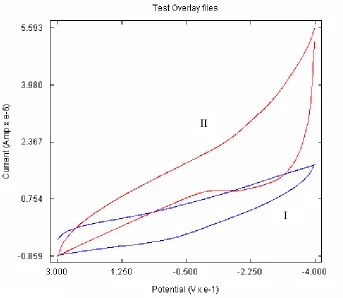
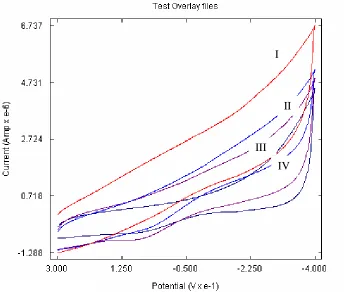
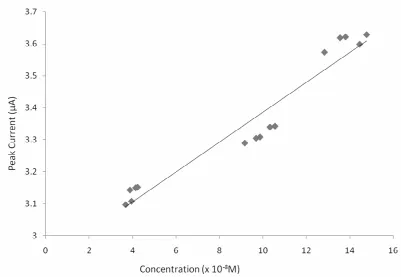
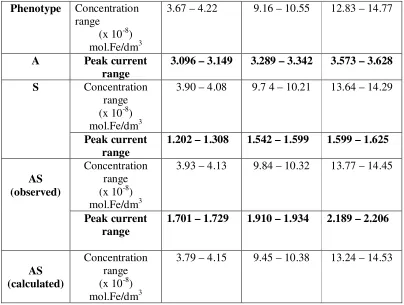
The values of the peak current at pH 5.0 in 0.2 M acetate buffer for haemoglobins of known phenotypes A, AS, S and AC at various concentrations are presented in Table 1. The ranges of haemoglobin concentrations for these phenotypes and the corresponding ranges of values of the peak current are presented in Table 2. The values of peak current for twenty haemoglobin samples of undisclosed phenotypes are presented in Table 3. Five samples each of HbA, AS and S are presented but only three of HbAC in Table 1 due to non-availability. The voltammograms of the acetate buffer as well as haemoglobin A (3.8 x 10⁻⁸ mol.Fe.dm-3) are shown as I and II in figure 1. Figure 2 shows the overlay of the voltammograms of HbA, S, AS and AC at 1.4 x 10⁻⁷ mol.Fe.dm-3.
Table 1. Values of Peak Current for haemoglobins of various and known phenotypes at specified concentrations
Haemoglobin A S/N Concentration
(x10-8) mol.Fe/dm3
Peak current
(µA)
Concentration (x10-8) mol.Fe/dm3
Peak current
(µA)
Concentration (x10-8) mol.Fe/dm3
Peak current
(µA)
1 3.87 3.142 9.68 3.304 13.55 3.618
2 3.67 3.096 9.16 3.289 12.83 3.573
3 4.22 3.151 10.55 3.342 14.77 3.628
4 4.13 3.149 10.32 3.339 14.45 3.598
5 3.94 3.107 9.86 3.308 13.80 3.621
Haemoglobin AS
1 4.13 1.729 10.32 1.934 14.45 2.203
2 3.93 1.701 9.84 1.910 13.77 2.189
3 3.94 1.711 9.86 1.918 13.80 2.192
4 3.98 1.720 9.94 1.921 13.92 2.200
5 4.00 1.726 10.02 1.930 14.03 2.206
Haemoglobin S
1 4.06 1.286 10.16 1.592 14.22 1.601
2 4.07 1.301 10.17 1.584 14.23 1.624
3 4.08 1.308 10.21 1.596 14.29 1.625
4 3.90 1.202 9.74 1.542 13.64 1.599
5 4.06 1.284 10.16 1.599 14.22 1.605
Haemoglobin AC
1 4.01 2.508 10.02 2.712 14.03 2.911
2 4.11 2.552 10.28 2.802 14.39 2.996
[image:6.612.81.518.334.706.2]
Table 2. Ranges of haemoglobin concentrations and the corresponding values for the Peak current
Phenotype
A Concentration range (x 10-8) mol.Fe/dm3
3.67 – 4.22 9.16 – 10.55 12.83 – 14.77 A Peak current range
(µA)
3.096 – 3.149 3.289 – 3.342 3.573 – 3.628
AS Concentration range (x 10-8) mol.Fe/dm3
3.93 – 4.13 9.84 – 10.32 13.77 – 14.45 AS Peak current range
(µA)
1.701 – 1.729 1.910 – 1.934 2.189 – 2.206
S Concentration range (x 10-8) mol.Fe/dm3
3.90 – 4.08 9.74 – 10.21 13.64 – 14.29 S Peak current range
(µA)
1.202 – 1.308 1.542 – 1.599 1.599 – 1.625
AC Concentration range (x 10-8) mol.Fe/dm3
3.98 – 4.11 9.94 – 10.28 13.92 – 14.39 AC Peak current range
(µA)
2.497 – 2.552 2.708 – 2.802 2.901 – 2.996
Figure 1. Voltammogram of (I) 0.2M acetate buffer, pH 5.0 and (II) haemoglobin A (3.8 x 10⁻⁸ mol.Fe.dm-3)
[image:7.612.134.477.379.677.2]
Figure 2. Overlay of the voltammograms of haemoglobins of different phenotypes (1.4 x 10⁻⁷ mol.Fe.dm-3). (I). HbA, (II). Hb AC, (III). HbAS and (IV). HbS.
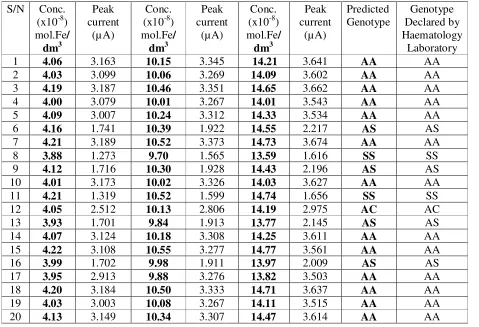
The values of peak current are distinct for the various haemoglobin genotypes and the genotypes of the blind samples presented in Table 3 were predicted with 100% accuracy using the values in Tables 1 and 2.
It is pertinent to note that of the 1045 blood samples screened in Lagos University Teaching Hospital (LUTH) Laboratory in the first half of 2008, 74% was HbA, 20% HbAS, 2% AC, 4% SS and 1% SC. The values of peak current for the four haemoglobin phenotypes A, S, AS and AC presented in this report would thus permit the determination of the phenotypes of 99% of the laboratory samples. Similar studies on haemoglobins SC, CC and SF will enhance the usefulness of the CV data obtained for determination of almost 100% phenotypes of haemoglobins among the black race. These phenotypes are rare as will be seen from the LUTH data. Plots of peak current against concentrations are shown for some of the haemoglobin samples in figures 3-6. It should be noted that the linear concentration dependence of the peak current observed by Chen et al [23] is confirmed in this study. However, a perfect correlation would not be expected due to methaemoglobin presence, variations in the concentrations of HbCO, and the presence of SOx, NOx, S2- and H2S in some of the samples as
these would affect the HbO2 concentration since the concentrations determined by Drabkin’s
procedure indicate mol.Fe/dm3 while the value of the peak current depends on mol. Fe (HbO2)/dm 3
. These results show that some haemoglobin phenotypes can be determined successfully by cyclic voltammetry. The advantages of this method over the conventional electrophoresis procedure
I
II
[image:8.612.134.478.66.358.2][image:9.612.71.550.196.523.2]
include rapidity, non-exposure of operators to corrosive chemicals such as staining and destaining reagents and elimination of the need to carry out CV on standard haemoglobins repeatedly once the initial sets of values have been obtained. This is borne out by the observation that these experiments were carried out over a period of ten months using the same electrodes and the values of peak current for the standards did not deviate significantly.
Table 3. Values of Peak Current for Haemoglobin samples of Undisclosed Phenotypes
S/N Conc. (x10-8) mol.Fe/ dm3 Peak current (µ A) Conc. (x10-8) mol.Fe/ dm3 Peak current (µA) Conc. (x10-8) mol.Fe/ dm3 Peak current (µA) Predicted Genotype Genotype Declared by Haematology Laboratory
1 4.06 3.163 10.15 3.345 14.21 3.641 AA AA
2 4.03 3.099 10.06 3.269 14.09 3.602 AA AA
3 4.19 3.187 10.46 3.351 14.65 3.662 AA AA
4 4.00 3.079 10.01 3.267 14.01 3.543 AA AA
5 4.09 3.007 10.24 3.312 14.33 3.534 AA AA
6 4.16 1.741 10.39 1.922 14.55 2.217 AS AS
7 4.21 3.189 10.52 3.373 14.73 3.674 AA AA
8 3.88 1.273 9.70 1.565 13.59 1.616 SS SS
9 4.12 1.716 10.30 1.928 14.43 2.196 AS AS
10 4.01 3.173 10.02 3.326 14.03 3.627 AA AA
11 4.21 1.319 10.52 1.599 14.74 1.656 SS SS
12 4.05 2.512 10.13 2.806 14.19 2.975 AC AC
13 3.93 1.701 9.84 1.913 13.77 2.145 AS AS
14 4.07 3.124 10.18 3.308 14.25 3.611 AA AA
15 4.22 3.108 10.55 3.277 14.77 3.561 AA AA
16 3.99 1.702 9.98 1.911 13.97 2.009 AS AS
17 3.95 2.913 9.88 3.276 13.82 3.503 AA AA
18 4.20 3.184 10.50 3.333 14.71 3.637 AA AA
19 4.03 3.003 10.08 3.267 14.11 3.515 AA AA
20 4.13 3.149 10.34 3.307 14.47 3.614 AA AA
Figure 3. Plot of peak current against concentration (mol.Fe/dm3) for HbA
[image:10.612.115.500.413.675.2][image:11.612.133.480.81.274.2]
Figure 5. Plot of peak current against concentration (mol.Fe/dm3) for HbS
Figure 6. Plot of peak current against concentration (mol.Fe/dm3) for HbAC
[image:11.612.124.486.346.606.2]
as 30% although the exact proportion varies from one individual to another [26]. If one assumes that the proportion of HbS in people who have HbAS is 30% and that of HbA is 70% and these assumptions were used to estimate peak current instead of the 50% used earlier, the values of peak current that is Hb (AS calculated) will even be further away from the observed peak current.
Thus the values of the peak current for haemoglobins C, SC and SF cannot be obtained from calculations and need to be determined in order to enhance the usefulness of results of this study.
It would be of interest to predict the success of this method in the identification or analysis of over 900 haemoglobin variants identified considering the range of values of the peak currents obtained. Chen et al [23] reported an increase in the values of the peak current in the presence surfactants such as hexadecyltrimethylammonium bromide. Thus the addition of detergents of similar nature would appreciably increase the range of values of the peak current and thus afford the identification of several haemoglobin variants.
[image:12.612.104.508.408.713.2]In a study of the electrochemical behaviors of neutral red on single and double stranded DNA electrode, cyclic voltammetric technique was also identified as a useful tool because of its high sensitivity, small dimensions, low cost and wider dynamic range [27]. Cyclic voltammetric technique was also used in studying the direct electrochemistry and electrocatalysis of myoglobin on Mb/MWNTs/Cs/GCE [28].
Table 4. Calculated and Observed Values of Peak current for Haemoglobin AS
Phenotype Concentration range
(x 10-8) mol.Fe/dm3
3.67 – 4.22 9.16 – 10.55 12.83 – 14.77
A Peak current range
3.096 – 3.149 3.289 – 3.342 3.573 – 3.628 Concentration
range (x 10-8) mol.Fe/dm3
3.90 – 4.08 9.7 4 – 10.21 13.64 – 14.29 S
Peak current range
1.202 – 1.308 1.542 – 1.599 1.599 – 1.625 Concentration
range (x 10-8) mol.Fe/dm3
3.93 – 4.13 9.84 – 10.32 13.77 – 14.45 AS
(observed)
Peak current range
1.701 – 1.729 1.910 – 1.934 2.189 – 2.206
AS (calculated)
Concentration range (x 10-8) mol.Fe/dm3
Peak current range
2.149 – 2.229 2.416 – 2.470 2.586 – 2.627
4. CONCLUSIONS
The results of the study indicate the novelty, rapidity and simplicity of cyclic voltammetric measurements as an analytical tool in the analysis of haemoglobins and determination of some haemoglobin phenotypes.
ACKNOWLEDGEMENTS
We gratefully acknowledge Prof. Omowunmi Sadik of State University of New York, (SUNY) Binghamton, for introducing cyclic voltammetry as an analytical tool to us and for her encouragement. We also acknowledge Mr. Sunday Opadoyin of the Haematology Laboratory (LUTH) for the supply of the blood samples. The preliminary study carried out by J.A. Babaniyi, M. Olaogun and T. Vaughan is gratefully acknowledged.
References
1. Biochemistry by L. Stryer, W.H. Freeman and Co. pp. 65-85 (1981) 2. Haemoglobin and Oxygen Binding Ed. C. Ho, 1983, pp. 20-60
3. R.E. Dickerson and I. Geis, Haemoglobin: Structure, Function, Evolution and Pathology, Benjamin/Cumming Co., 1983 pp. 20-60
4. J.G, Beetlestone, O. S. Adeosun, J. E. Goddard, M. M. Ogunlesi and K. O. Okonjo. Journal of Chemical Society, Dalton Transactions, (1976) 1275.
5. J.E. Bailey, J. G. Beetlestone and D. H. Irvine. J. Chem. Soc., (A) (1970) 756.
6. Chu, A.H. and Ackers, G.K. The Journal of Biological Chemistry, 256 (3) (1981) 1199. 7. J.Wyman. Adv. Protein Chem., 19, (1964) 223.
8. E. Antonini, J. Wyman, M. Brunori, C. Fronticelli, E. Bucci and R.Rossi Fanelli, J. Biol. Chem., 240, (1965) 1096.
9. Fact sheet, University of Rochester Medical Center www.urmc.rochester.edu/genetics 10.J. F. Finch, M. F. Perutz, J. F. Bertles and J. Dobler. Proc. Nat. Acad. Sci., 70 (1973) 719. 11.R. L. Nagel, M. E. Fabry, M. H. Steinberg. Blood Rev. 17 (3) (2003) 167.
http://linkinghub.elsevier.com/retrieve/pii/S0268960X03000031
12.R. M. Fairhurst, H. Fujioka, K. Hayton, K. F. Collins, T. E. Wellems. Blood, 101 (8) (2003) 3309. 13.Y. W. Kan, and A. M. Dozy. Science, 209 (1980) 388.
14.N. L. John, Abnormal Haemoglobins: General Principles, Prevalence and geographical
distribution. In: John, P.G., John, F. and John, N.L. eds. Wintrobes’s Clinical hematology 11th edn. Philadelphia. Lippincott, W. and Wilkins (2003) pp 1018-1031.
15. P. N. Uzoegwu and A. E. Onwurah. Biokemistri., 15 (2) 2003 57.
16.M. Brozovic and J. Henthorn. Investigations of abnormal haemogblobins and thalassaemi In: J. V. Dacie, S. M. Lewis. Practical haematology. 8th edn. Edinburgh. Church Livingston (ELBS) 1994. pp 249-286.
18.Haemoglobin C: Definition from answers.com http://www.answers.com/topic/ haemoglobin-c. 19.J. F. Finch, M. F. Perutz, J. F. Bertles, J. Dobler, J. Proc. Nat. Acad. Sci., 70 (1973) 721. 20.A. Joutovsky, J. Hadzi-Nesic and A. M. Nardi. Clin Chem. 50 (10) (2004) 1736
21.J. R. Petersen, A. O. Okorodudu, A. Mohammad and D. A. Payne. Clinica Chimica Acta, 330, (1-2) (200(1-2) 1.
22.P. Kleinert, M. Schmid, K. Zurbriggen, O. Speer, M. Schmugge, B. Roschitzki, S. S. Durka, L. Urs, T. Kuster, C. W. Heizmann, H. Frischknecht and H. Troxler. Clin Chem., 2007
23.X. Chen, C. M. Ruan, J. Kong, R. Yang and J. Deng. Electroanalysis, 10 (10) (1998) 695. 24.J. R. Shaeffer, R. E. Kingston, M. J. McDonald, H. F. Bunn. Nature, 276 (1978) 631. 25.H. F. Bunn and M. J. McDonald. Nature, 306 (1983) 498.
26.E. Beutler. The Sickle cell Diseases and its related disorders: Concentration of HbS in the red cell In: E. Beutler, M. A. Lichtman, T. J. Kipps (eds). Williams Haematology 5th edn: New York 1995. pp 616-651.
27.W. Sun, M. Yang, K. Jiao. Int. J. Electrochem. Sci., 2 (2007) 93.
28.L. S. Duan, Q. Xu, F. Xie, S. Wang. Int. J. Electrochem. Sci., 3 (2008) 118.