Int. J. Electrochem. Sci., 6 (2011) 3631 - 3643
International Journal of
ELECTROCHEMICAL
SCIENCE
www.electrochemsci.org
Multivariate Optimization of Voltammetric Parameters for the
Determination of Total Polyphenolic Content in Wine Samples
Using an Immobilized Biosensor
K.Bisetty*, M. I.Sabela, S. Khulu, M. Xhakaza and L. Ramsarup
Department of Chemistry, Durban University of Technology, P.O. Box 1334, Durban 4000, South Africa
*
E-mail:[email protected]
Received: 7 June 2011 / Accepted: 15 July 2011 / Published: 1 August 2011
This work was aimed at investigating the changes in the determination of total phenolic (TP) content in wine samples using catechin as a standard. The modification of the glassy carbon electrode (GCE) was carried out using green apple as an enzymatic source of polyphenol oxidase. The experimental variables were optimized using the Box-Behnken design with 3 factors in 15 runs of differential pulse voltammetry (DPV). The design was run in a single block fashion while the order of the experiments was fully randomized to provide greater protection against the effects of lurking variables. Specifically, the three optimized factors included the buffer pH, deposition time (td) and scan rate (sr). Based on the optimized results obtained, we selected the most suitable condition for the determination of the TP content in wine samples as follows: phosphate buffer of pH 7.65 as supporting electrolyte, td 29.8 s and sr 25.0 mV/s respectively. The method was optimized with respect to the current signal at a deposition potential of 0.2 V and within an oxidation potential of -0.2 V to 0.6 V. Good analytical responses were obtained with apple sensors for the detection of TP in wine samples, with a higher concentration in red wines than in white wines.
Keywords: Glassy carbon electrode, Box-Behnken design, differential pulse voltammetry, total phenolic content
1. INTRODUCTION
viral and bacterial infections [1-3]. Flavanols are capable of terminating these chain reactions by removing the free radical intermediates, and inhibit other oxidation reactions by being oxidized themselves [1], resulting in the beneficial effects of wine consumption. However their amounts need to be controlled because of their strict regulations and formation of cloudiness in wines due to these antioxidants and customer demand [4]. Specifically in this work, (+)-catechin is the flavanol of interest, because of the key role it plays in the brewing process by delaying, retarding or preventing the oxidation processes. The differing levels of antioxidant in various wines are due to the differences in raw materials used during the brewing processes. Due to the great importance of polyphenols for wine quality there is a growing interest in the development of selective and sensitive methods for their detection and quantification. There are several techniques that are used for the examination of polyphenolic content and chemical composition of wine, including high-performance liquid chromatography (HPLC) [5-8] and capillary electrophoresis (CE) [9-11] coupled with different detectors, UV–Vis, photo diode array (PDA), mass spectrometry (MS), and electrochemical (EC) detectors. HPLC coupled with UV detection is the preferred method of analysis in the brewery industry [12]. For the purposes of our study the polyphenols oxidase enzyme present in apple was used for the electrochemical measurements of polyphenols (catechin equivalent) in wines [13]. However, it would be difficult to implement in a routine analysis of real samples despite the fact that this method is sensitive and specific. On the other hand Chromatographic methods permit the separation of components present in complex matrices such as beer, to be performed rapidly, and to selectively and sensitively quantify their presence [14]. Nevertheless, chromatographic methods require sample preparation steps, which are tedious and may compromise sample integrity and may introduce sources of error.
The primary goal of this work involves the quantification of flavanols in wines with tissue biosensor. Accordingly the electrochemical behaviour for the determination of catechin is conducted under different experimental conditions, which included the pH of the buffer, deposition time td and scan rate sr. Electrochemical techniques particularly voltammetry provide information, not just on the identity and quantity of a compound, but also on the physicochemical properties, such as redox potential and the number of electrons exchanged during the redox reaction. This information helps in evaluating the antioxidant properties of phenolic compounds and to better understand their reaction mechanisms [15].
matrix as a result increasing the life time of the electrode. The enzyme polyphenol oxidase has been found to be present in a number of different plant tissues including, apple [13], banana [13], mushroom [17], avocado [17], quince [18], and potato [17, 19, 20]. Literature studies revealed that for the determination of catechol related compounds, potato and apple were considered to be the best biosensors, resulting in the best responses among the evaluated tissues. [13].
For this purpose multivariate optimization of experimental parameters for the determination of polyphenolic compounds in wine samples was utilised. Specifically, the Box–Behnken experimental design was used to achieve optimum conditions for the concentration of catechin. The three factors included pH of the measuring buffer, deposition time td of the analyte to electrode paste and the scan rate sr. Pareto charts and partial least squares (PLS) analysis were used to relate response variables to the explanatory variables. In addition, electrochemical oxidation/reduction of catechin was studied with cylic voltammetry (CV). Finally, the concentration of the TP was determined using the optimised conditions within the potential range of -0.2 V to 0.6 V.
2. EXPERIMENTAL
2.1. Apparatus
All analytical measurements were performed with a 797 VA Computrace from Metrohm (Herisau, Switzerland). This is a three electrode system of a 3mm diameter rotating disc electrode (GCE), reference electrode made of Ag/AgCl (saturated AgCl, 3 M KCl), and the auxiliary electrode that is made of platinum wire. Scans were evaluated with the Metrohm 797 VA potentiostat. A pH meter, Crison Micro pH 2000, from Crison Instruments (South Africa (SA) was used to adjust the pH of the buffer solutions. All working solutions and the buffer were prepared with deionized water from a water purification system called Aqua MaxTM Basic 360 Series from Trilab (Durban, SA). The electrochemical buffers together with the samples were stored in the fridge at 4 °C. The software provided with the equipment enabled automatic peak evaluation (current signal) and estimation of the concentration in a standard addition mode. All samples were allowed to reach room temperature prior to the commencement of any voltammetric measurements.
2.2. Reagents and Chemicals
from Du Toitskloof Cellar SA), Pinotage (2009, from Swartland Winery SA) and Baronne (2009, from Nederburg SA) were purchased at a local Supermarket in Durban, SA.
2.3. Methods
2.3.1. Preparation of the carbon paste electrode
Because of the several measurements to be performed with the GCE, its surface was going to be contaminated with the product of the electrode redox processes and to overcome this, prior to modification, the surface of the working electrode (GCE) was cleaned by polishing for 10s with alumina paste (mixture of alumina and water) on a polishing cloth followed by rinsing with high-purity water and dried with nitrogen. Subsequently, its activity was regenerated by electrochemically cleaning, scanning 5–10 cycles in the potential range between -0.5 and 1.0 V with a scan rate of 50 mV.s-1 in the presence of a supporting electrolyte.
The carbon paste of approximately 1.7 g comprised of 40 % graphite powder, 40 % of Nujol and 20 % of ground green apple. This paste was incorporated onto a chemically and electrochemically cleaned surface of GCE before electroanalytical measurements were performed. The electrode surface was renewed by incorporating a new paste for every scan performed and the measuring solution was purged with nitrogen prior to analysis. However it should be noted that the immobilization of the material can often be a problem due to the insufficient thickness of the tissues to maintain mechanical stability resulting in slow responses because of the long diffusion path between the test solution and the detector surface of the electrode. Therefore the polishing step with aluminium oxide was repeated only once a day.
2.3.2.Preparation of buffer
According to the structural design of our experiment shown in table 1, it was necessary to prepare three separate buffer solutions with different pH values. The phosphate buffers were prepared by weighing approximately 0.8 g of NaH2PO4.2H2O and 5.2 g of Na2HPO4 then dissolving into a 500 ml volumetric flask and adjusted with 0.1 M HCl or 0.1 M NaOH to the desired pH and the final volume with deionized water. All buffer solutions were stored in the fridge at 4 0C.
2.3.3. Preparation of standard
2.3.4. Preparation of samples
Wine samples were filtered through a Teflon disc filter (0.45μm and 9mm diameter). White wines were diluted 100 times, whilst red wines were diluted 1000 times with the phosphate buffer of pH 7.6 before electrochemical measurements were conducted. All sample measurements were done in triplicate and the analytes were quantified by addition of the standard in the measuring cell containing the wine sample.
2.3.5. Procedure for optimization of experimental parameters
The carbon paste electrode prepared as described in section 2.3.1 was used to perform electrochemical measurements at different experimental factors. The Box–Behnken design generates the three experimental factors (pH, td and sr) randomly for 15 levels as show in table 1. The method was optimized with respect to the current signal which is proportional to the concentration of catechin within an oxidation potential range of -0.2 V to 0.6 V.
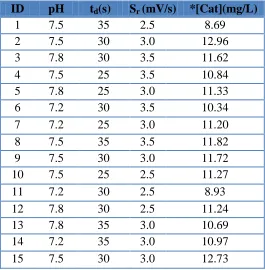
Table 1. Shows the structure of the 3 factors, 15 levels of Box-Behnken experimental design and response values *Average of three replicate
ID pH td(s) Sr (mV/s) *[Cat](mg/L)
1 7.5 35 2.5 8.69
2 7.5 30 3.0 12.96
3 7.8 30 3.5 11.62
4 7.5 25 3.5 10.84
5 7.8 25 3.0 11.33
6 7.2 30 3.5 10.34
7 7.2 25 3.0 11.20
8 7.5 35 3.5 11.82
9 7.5 30 3.0 11.72
10 7.5 25 2.5 11.27
11 7.2 30 2.5 8.93
12 7.8 30 2.5 11.24
13 7.8 35 3.0 10.69
14 7.2 35 3.0 10.97
15 7.5 30 3.0 12.73
2.4. Data Evaluation
STATGRAPHICS Plus version 5.1and Microsoft excel® 2007 were used for data evaluation and preparation of the experimental design. Peak evaluation was performed with 797 PC Software 1.3 ®
[image:5.596.166.431.392.662.2]
3. RESULTS AND DISCUSSION
3.1. Optimisation of experimental procedure
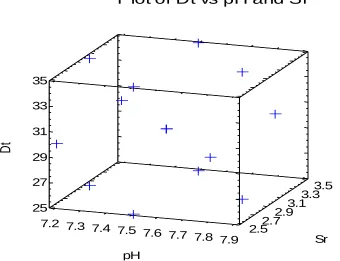
In order to understand the relationship between variables and their relevance to the actual determination of catechin in wine samples, a Box-Behnken design was created to study the effects of 3 factors in 15 runs [21]. Three replicates were measured for each sample and the average response was used to attain the optimum parameters as shown in table 1. The scatter plot in figure 1 allows for the visualization of multivariate data in a three dimensional space having the values of one variable determining the position on the horizontal axis and the value of the other variable determining the position on the vertical axis shows that the experiment was well distributed.
Plot of Dt vs pH and Sr
pH
Sr
Dt
7.2 7.3 7.4 7.5
7.6 7.7 7.8 7.9 2.5 2.72.9
3.13.3 3.5
25 27 29 31 33 35
Figure 1. 3D Scatter plot of variables td versus pH and sr used for experimental design. td is the deposition time, pH is the ionic strength of the phosphate buffer and sr is the scan rate.
[image:6.596.122.462.288.549.2]
Standardized Pareto Chart for [Cat]
Standardized effect
+
-0 0.5 1 1.5 2 2.5 3
AB A:pH AC BB AA B:Dt BC C:Sr CC
Normal Probability Plot for [Cat]
Standardized effects p e rc e n ta g e
-3 -2 -1 0 1 2 3 0.1 1 5 20 50 80 95 99 99.9 A B
Estimated Response Surface
pH=7.5 td Sr [C a t]
25 27 29
31 33 35 2527
[image:7.596.58.535.78.468.2]2931 3335 10.8 11 11.2 11.4 11.6 11.8 C
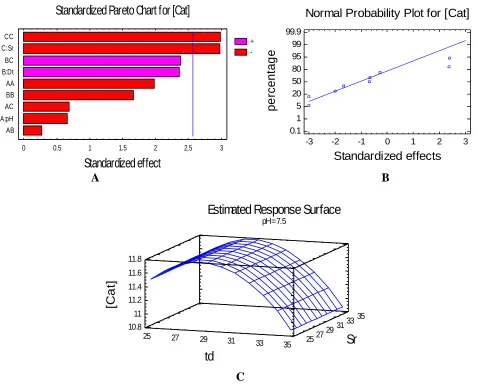
Figure 2. A. Pareto Charts shows the matrix of selected variables against the standardization effect. B. Matrix are ranked according to the order of importance C. the response surface plot shows the distribution of [Cat] as a function of td and Sr at constant pH=7.5 after elimination of C:C, C:Sr and B:C.
the qualitative measurements using CV and the quantification of Total Phenolic (TP) content in different wine samples using DPV.
Table 2. Shows the list of the optimised parameters that were used for determination of the concentration the total polyphenolic compounds in wine samples.
Factors Low High Optimum
pH 7.2 7.8 7.65
td 25.0 35 29.77
sr 25.0 35 25.0
3.2. Electrochemical Oxidation/Reduction of polyphenols (biosensor)
[image:8.596.197.399.173.243.2]In this work it was also evident that the buffer had a great impact on the E1/2 potential. Hence, the E1/2 can be reported with respect to the buffer used to perform electroanalytical measurements, in this case the phosphate buffer with pH 7.6. However the immobilization of the material can be a problem because of the long diffusion path between the test solution and the detector surface, thus the tissue should be of a sufficient thickness to maintain mechanical and chemical stability. During the experimental measurement, the solution was unstirred; therefore mass transport can occur only by diffusion due to the concentration gradients created around the electrode immobilised biosensor surface.
[image:8.596.121.475.467.686.2]
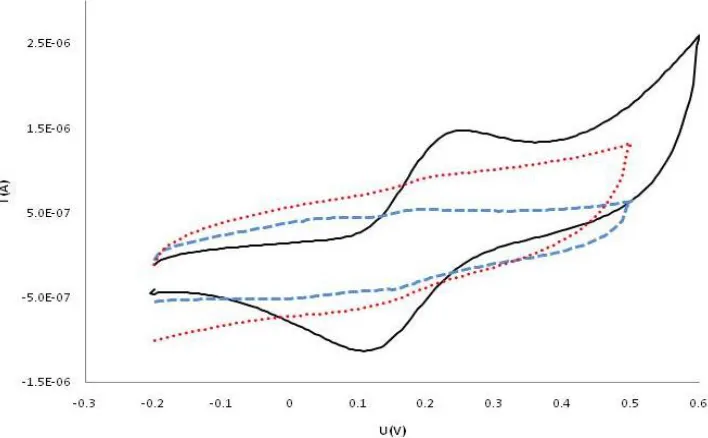
Cyclic voltammograms were recorded immediately after the working electrode was immersed in the solution minimizing the adsorption of the analyte on the electrode at a scan rate of 25 mV/s in the potential range from -0.2 to 0.6 V. Polyphenols are well known to be electroactive, due to the presence of hydroxyl groups attached to the aromatic rings, which undergo electrochemical oxidation reactions [22]. The oxidation mechanism of catechin proceeds in sequential steps, related to the catechol moiety (B-ring) and 3’- hydroxyl group. When the potential of the working electrode is more positive than that of a redox couple present in the solution, the anodic peak Epa that corresponds to a reversible process is observed at 0.219 V shown in figure 3 and the cathodic peak Epc at 0.128 V as the working electrode potential becomes more negative than the reduction potential of a redox couple.
The main peak is characterized by Epa value ranging between -0.15 and 0.25 V. This peak is due to the oxidation of the catechol moiety, 3’,4’-dihydroxyl electron-donating groups at ring B, occurs first at a very low positive potential. This voltammetric behaviour of catechin is in close agreement with those reported in literature [22]. Since this is a reversible couple the formal potential for E0'= 0.18 V is centered between Epa and Epc denoted by E0' = (Epa + Epc)/2. Moreover the Epa peak observed at 0.22 V illustrates that catechin has a relatively high antioxidant activity [23]. The (+)-catechin molecule has several OH functional groups attached to all three rings (A5, A7, B3’, B4’ and C3). All the hydroxyl groups can be electrochemically oxidized but the catechol (B-ring) is most easily oxidizable than the resorcinol (A-ring), and glycoside (C-ring), hence the postulated mechanism is as shown in scheme 1 [5, 14, 22]. The two hydroxyl substituents of the B-ring are oxidised sequentially forming a quinone as below.
Scheme 1. Oxidation/reduction scheme of catechin under optimum conditions; pH of electrolyte 7.65, td of 29.77s and Sr of 25.0mV/s.
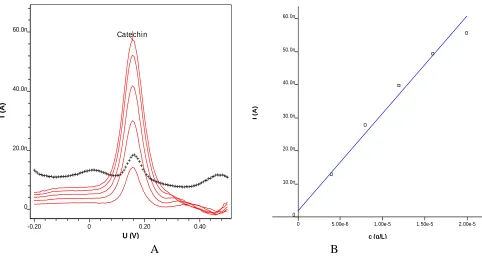
E1/2 of the polyphenolic as the concentration was increased and the calibration data (in figure 4B) obtained obey the linear regression equation with a correlation coefficient (R2) of 0.98820.
Glassy Carbon Electrode [3]in Phosphate Buffer
catechin_calibration
-0.20 0 0.20 0.40
U (V)
0 20.0n 40.0n 60.0n
I
(A
)
Catechin
0 5.00e-6 1.00e-5 1.50e-5 2.00e-5
c (g/L) 0
10.0n 20.0n 30.0n 40.0n 50.0n 60.0n
I
(A
)
Catechin c =
---A B
Figure 4. Differential Pulse Voltammogram (DPV) of catechin standards 40, 80, 120, 160 and 200 ppb obtained using optimised parameters from experimental design section 2.3.5. pH of electrolyte 7.65, td of 29.77s and Sr of 25.0mV/s. **** blank and — catechin standards from 40 to 200ppb.
[image:10.596.54.536.129.388.2]The lowest detectable LOD concentration of the standards with green apple paste was found to be 1.76 ppb and lowest quantifiable concentration LOQ was 5.86 ppb (shown in Table 3).
Table 3. Statistics of the calibration plot and limit of detection at optimum conditions.
Analyte Y.reg/offset Slope Mean dev Corr. Coeff LOD (ug/L)
LOQ (ug/L) Catechin 1.717e-009 2.944e-006 2.295e-009 0.98820 1.76 5.860
[image:10.596.57.537.573.632.2]
We have used the standard addition method to determine the TP content in wines samples. Two additions were performed while taking into consideration the effect of any other electroactive species present in the blank (electrolyte) solution. Hence the current signal for the blank solution was subtracted from that of the samples and standards. The significant different of catechin equivalent between red and white wines observed in table 4 can be attributed to the differences in wine making processes.
Glassy Carbon Electrode [3]in Phosphate Buffer
swartland red wine
-0.20 0 0.20 0.40
U (V)
10.0n 20.0n 30.0n 40.0n
I
(A
)
Catechin
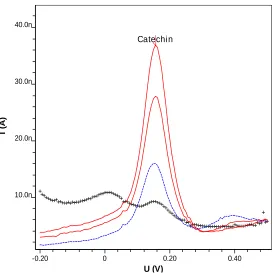
Figure 5. DP voltammogramm of the red wine (Baronne) sample. **** blank (electrolyte and paste), ---- (sample) Peak due to Total phenolic content appears at 0.18 V in the first scan. — (addition 1 and 2) Overlaid peaks due to addition of catechin standard.
Table 4. Table of results obtained from wine samples using DPV at optimum conditions. *Number of replicates n=3
Wine Samples Color Catechin Equivalent(mg/L)
Mdn (mg/L)
RSD%
Swarland white 58.54 59.04 1.72
Du Toitskloof white 59.38 59.20 2.33
Nederburg red 612.67 598.20 4.74
Swartland red 1033.53 1033.80 1.40
[image:11.596.158.433.197.470.2]
4. CONCLUSION
In this study it was evident that parameters such as pH of the buffer, the scan rate and the deposition time should be adequately optimized before electroanalytical determination of the analytes in order to improve the quality of the results. The predicted Box-Behnken experimental design is useful for the understanding of the levels of factors and interactions among the studied factors. The experimental responses obtained in the optimization conditions are in agreement with the estimated values based on the response surface models. This approach can easily be transferred to other analytical techniques. Moreover the immobilization of tissue materials with sufficient thickness, revealed mechanical stability which proved to be very effective for the determination of the phenolic content in both red and white wines. The LOD of 1.76 ppb and LOQ of 5.86 ppb (RSd 2.5%) obtained for catechin suggests the highly sensitive nature of the immobilized paste. The content of the catechin (equivalent) in white and red wines is approximately, 60 ppm and 500-1000 ppm respectively, which is satisfactory for control purposes in the brewery industry.
ACKNOWLEDGEMENTS
Our grateful acknowledgement goes to the National Research Foundation of South Africa for the financial support of the project.
1. B. Bartolomé, A. Peña-Neira and C. Gómez-Cordovés, Eur. Food Res. Technol., 210 (2000) 419 2. V. Adam, R. Mikelova, J. Hubalek, P. Hanustiak, M. Beklova, P. Hodek, A. Horna, L. Trnkova, M.
Stiborova, L. Zeman and R. Kizek, Sensors, 7 (2007) 2402
3. K. E. Heim, A. R. Tagliaferro and D. J. Bobilya, J. Nutr. Biochem., 13 (2002) 572 4. H. Zhao, W. Chen, J. Lu and M. Zhao, Food Chemistry, 119 (2010) 1150
5. M. Šeruga, I. Novak and L. Jakobek, Food Chemistry, 124 (2011) 1208
6. M. J. Aguirre, Y. Y. Chen, M. Isaacs, B. Matsuhiro, L. Mendoza and S. Torres, Food Chemistry, 121(2010) 44
7. J. Wirth, C. Morel-Salmi, J. M. Souquet, J. B. Dieval, O. Aagaard, S. Vidal, H. Fulcrand and V. Cheynier, Food Chemistry, 123 (2010) 107
8. L. Gambelli and G. P. Santaroni, J. Food. Comp. Anal., 17 (2004) 613
9. Y. Sun, N. Fang, D. D. Y. Chen and K. K. Donkor, Food Chemistry, 106 (2008) 415
10.R. G. Peres, G. A. Micke, M. F. M. Tavares and D. B. Rodriguez-Amaya, J. Sep. Sci, 32 (2009) 3822
11.L. Arce, M. T. Tena, A. Rios and M. Valcárcel, Anal. Chim. Acta, 359 (1998) 27
12.E. M. Elmer-Rico , J. M. Vidal, A. B. Pelegrina and J. R. L. Micor. J. Applied Sci., 7 (2007) 1286 13.B. R. Eggins, C. Hickey, S. A. Toft and D. Min Zhou, Anal. Chim. Acta, 347 (1997) 281
14.M. S. Maoela, O. A. Arotiba and P. G. L. Baker, Int. J. Electrochem. Sci., 4 (2009) 1497 15.I.Novaka, P. Janeiro, M. Seruga and A. M. Oliveira-Brett, Anal. Chim. Acta, 630 (2008)107 16.P. A. Kilmartin, Antioxidants Redox Signaling, 3 (2001) 941
17.F. Mazzei, F. Botre, M. lanzi, G. Lorenti, F. Porcelli and C. Botre, Sensors and Actuators, 7 (1992) 427
18.H. Yağar and A. Sağiroğlu, Acta Chim. Slov. , 49 (2002) 893 19.I.C. Vieira and O. Fatibello-Filho, Anal. Lett., 30 (1997) 895
21.M. A. Martinez-Gomez, R. M. Villanueva-Camañas, S. Sagrado and M. J. Medina-Hernández, Electrophoresis, 26 (2005) 4116
22.P. Janeiro and A. M. O. Brett, Anal. Chim. Acta, 518 (2004) 109
23.A.Simić, D. Manojlović , D. Šegan and M. Todorović, Molecules, 12 (2007) 2327
24.S. Yilmaz, M. Sadikoglu, G. Saglikoglu1, S. Yagmur and G. Askin, Int. J. Electrochem. Sci., 3 (2008) 1534
25.A.Staško, M. Polovka, V. Brezová, S. Biskupič and F. Malík, Food Chemistry, 96 (2006) 185