Restructuring of the electrical double layer in ionic
liquids upon charging
V. Ivaniˇstˇsev
Department of Physics, Scottish Universities Physics Alliance (SUPA), Strathclyde University, John Anderson Building, 107 Rottenrow East, Glasgow, UK G4 0NG.
E-mail: [email protected]
K. Kirchner
T. Kirchner
Department of Physics, Scottish Universities Physics Alliance (SUPA), Strathclyde University, John Anderson Building, 107 Rottenrow East, Glasgow, UK G4 0NG.
Max Planck Institute for Mathematics in the Sciences, Inselstraße 22, 04103 Leipzig, Germany.
M.V. Fedorov
Department of Physics, Scottish Universities Physics Alliance (SUPA), Strathclyde University, John Anderson Building, 107 Rottenrow East, Glasgow, UK G4 0NG.
E-mail: [email protected]
Abstract. We have investigated the electrical double layer (EDL) structure in ionic liquids using molecular dynamics simulations with three different models of ionic liquids. We show that the EDL restructuring, driven by surface charging, can be rationalized by use of two parameters, renormalized surface charge (κ) and charge excess in interfacial layers (λ). Analysis of relationships between the λ and κ parameters provides new insights into mechanisms of over-screening and charge-driven structural transitions in the EDL in ionic liquids. We show that the restructuring of the EDL upon charging in all three studied systems has two characteristic regimes: (1) Transition from the bulk-like (κIon= 0) to the multilayer structure
(κIon≈0.5) through the formation of the commensuratemultilayerof counter- and co-ions; and
(2) Transition from the multilayer (κIon≈0.5) to the crowded (κIon>1) structure through the
formation of amonolayerof counter-ions atκIon≈1.0.
Research on ionic liquids (ILs) 1
at charged interfaces is booming due a large number of existing and prospective applications of these systems (particularly of room temperature ILs) in energy, metal extraction, catalysis and many other fields [1, 2, 3]. ILs are interesting systems from the fundamental point of view as well because they represent an unusual case of highly concentrated electrolytes that in addition are generally more chemically inert and more resistant to higher voltages than standard diluted electrolytes (such as e.g. aqueous ionic solutions) [1, 4]. By this time, it has been already realised that the behaviour of ILs at charged surfaces is
1
principally different to the behaviour of standard solvent-based electrolytes: ILs reveal a number of phenomena typically not seen in standard electrolytes such as over-screening [5, 6], charge-driven structural transitions [7, 8] and ion crowding at the interface [9] (for a review of these phenomena, see Ref.[1]).
Most of these phenomena are determined by the structural response of the IL electrical double layer (EDL)2
to the surface charge [1]. The aim of this paper is to elucidate main mechanisms of the charge-driven changes of the EDL structure in ILs by investigating interfacial behaviour of three different model ILs in a wide range of surface charge densities. To facilitate comparison of different IL systems and revealgeneral trends in structural behaviour of ILs at charged interfaces we perform analysis of the EDL structure and capacitance on the base of two dimensionless parameters, renormalized surface charge (κ) and charge excess in interfacial layers (λ) [7, 10].
Focussing on rationalising the crossover between the overscreening and crowding regimes in the EDL structure [9], we run several extensive series of long-term and large scale simulations for a range of surface charge densities (as wide as ±76 µC cm−2
). In order to elucidate the effect of the ion size, three different charged Lennard-Jones sphere models of IL were chosen, with the cation-to-anion diameter (dLJ) ratios of 1 : 1 (large anion – LA), 1 : 0.8 (medium anion
– MA) and 1 : 0.5 (small anion – SA) with constantdLJ(Cation) = 1.0 nm. Two of these models
(LA and SA) were verified in previous works on ILs at electrified interfaces [11, 12, 7] where it was shown that they can provide qualitative comparison with experimental data on the EDL capacitance in ILs. All simulations were performed using the GROMACS Molecular Dynamics (MD) software [13]. Preparation of the model systems and analysis of the MD simulations data were held using NaRIBaS toolbox 3
. Further details on the systems and models are provided in the Supplementary Material [14].
In the analysis presented below we investigate behaviour of number and charge densities of IL ions in the interfacial area in order to elucidate relationships between several interfacial phenomena attributed to ILs, including:
• ion layering and charge-density oscillations in the direction that is normal to the charged surface [12, 6];
• crowding of counter-ions at high surface charge densities [9];
• overscreening of the surface charge by the charge ofcounter-ions in the first interfacial layer [5, 12].
The overscreening regime is a distinctive feature of the EDL structure in ILs [1]. It is manifested in the formation of alayered structure near the charged electrode surface, where the first layer contains more counter-charge than is needed to compensate for the surface charge [5]. The excess of charge is provided by counter-ions (ions with opposite charge to the surface) and it is compensated in the subsequent ion layers. The termcrowding refers to the situation where the number of counter-ions required to compensate the surface charge can not be accommodated in a layer with thickness of a single ion diameter [9]. Therefore, the first ionic layer becomes wider due to inclusion of several sublayers of counter-ions.
As demonstrated below, the crossover between the overscreening and crowding regimes happens via formation of a monolayer of counter-ions (Fig. 1A). The monolayer structure
2
EDL is a common name for a complex interfacial structure in systems with mobile charges determined by the electrostatic interaction of ions and molecules with a charged surface. Despite of having “double” in its name, the EDL may consist of several distinct molecular or charge layers, particularly in highly concentrated electrolytes like ionic liquids (ILs) [1].
3
is characterized by an absence of oscillations in the electrostatic potential φ(z)-profiles 4
and a linear potential drop between the electrode and the monolayer of counter-ions [14]. We employ this feature to define a unifiedκ-scale, on which the surface charge density (σ) is normalized by the maximum charge density that can be stored in the counter-ion monolayer (θmax
Ion ):
κIon=
σ θmax Ion . (1)
Below we use theκ-scale for generalized analysis with a focus on the region 0< κIon <1.5, where
κCationcorresponds to the negative surface charge density values (σ <0) andκAnioncorresponds
to the positive values (σ >0).
The physical basis for the κ-scale lies in the complete surface charge compensation by the monolayer of counter-ions at κIon = 1, i.e. when σ=−θIonmax [7, 10]. The latter quantity (θIonmax)
can be either estimated on the basis of a purely geometrical model of the monolayer (see Fig. 1B) or extracted from the simulation results at the point of surface charge that corresponds to a linear potential drop [14]. Value of θmax
Cation was found to be the same for all studied systems
(16µC/cm2) in accordance with the fact that the cation model is the same in all systems. This value corresponds to the density of one cation per 1nm2
of the surface that corresponds to the dense coverage of the surface by the cations (the cation diameter is 1nm). θmaxAnion values were
found to be −68, −26 and−16µC/cm2 for the systems with small, medium and large anions, respectively. These values also correspond to the dense coverage of the surface by the anions.
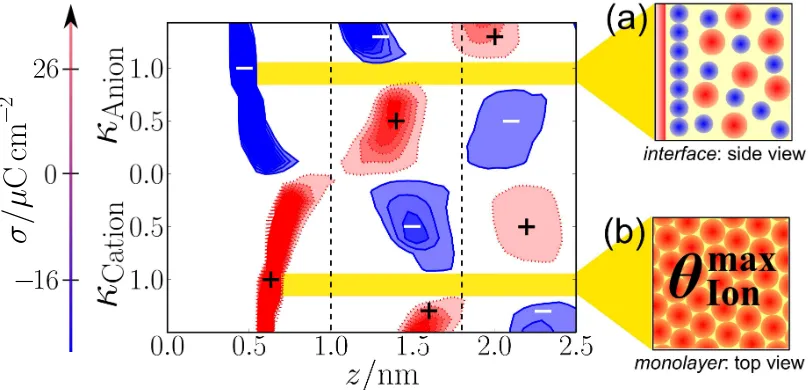
In Fig. 1, ion density ρN(z)-profiles are summarized for the model with medium anion
in the form of a contour map of ρN(z, κ) 5. As can be seen, the vertical valleys divide the
interfacial region into distinct regions of ion accumulation. Accordingly, we refer to the region of accumulation of counter-ions as the first layer and the subsequent region of co-ions as the second interfacial layer.
Upon surface charging, i.e. increasing κIon, counter-ions in the first layer become pressed
against the surface by the strong electrostatic attraction between the ions and the charged surface. This is evident from the thinning of the first layer and the monotonous grow of the counter-ion number density with increasing κIon (Fig. 1). Differently, in the second layer the
ρN(z, κ) grows until some saturation at κIon ≈ 0.5 and then decreases until formation of the
monolayer at κIon= 1. The highlighted horizontal valleys indicate an absence of layering and a
direct transition from the monolayer of counter-ions to bulk-like IL in direction normal to the surface plane (Fig. 1A).
Note that the maximum number density, seen at κIon ≈ 0.5, considerably exceeds the
bulk number density (ρbulk). This implies more organized packing and also indicates that
the most distinct layering occurs in the vicinity of κIon ≈ 0.5. The conclusion is supported
by the appearance of a flat peak in the normalized cumulative charge density cnQ(z)-profiles:
cnQ(z) =
Rz
0 ρQ(z′)dz′, where the charge density ρQ(z)-profile is defined as a sum of the ion
number density profiles multiplied by the charge of the ionic species.
The−cnQ(z)/σ-profiles, shown in Fig. 2, resemble waves with crests that is a clear indicator
the overscreening regime (|cnQ(z)/σ| > 1). Upon κIon → 1 the overscreening diminishes
gradually. At κIon = 1 the profiles represent a step-wise curve suddenly reaching value of
1.0, and in the crowding regime at κ > 1.0 the overscreening reappears. The absence of the charge waves atκIon = 1 confirms that in the surface normal direction the monolayer is directly
followed by the bulk-like phase. Note that the distinct layering and oscillations are visible in both
4
The EDL structural response to the surface charging is commonly analysed through calculations of electrostatic potential profiles –φ(z), ion number density profiles –ρN(z) or charge density profiles –ρQ(z), which depict the dependence of the corresponding quantity on the distance from the surface (z)
5
Fig. 1 and Fig. 2. However, variations ofρN(z)- and−cnQ(z)/σ-profiles hinder several essential
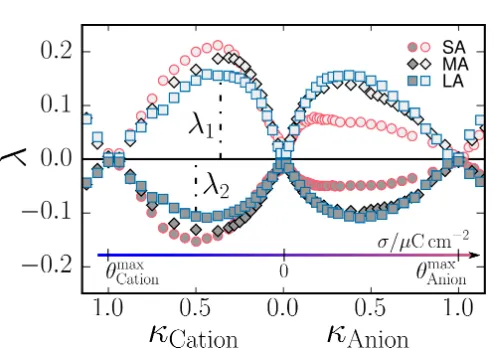
features of the EDL restructuring. More clearly the restructuring process can be illustrated with the use of a charge excess (λ) in an i-th ion layer [10]:
λi =κIon×
cnQ(zi)
σ −1 , (2)
where zi corresponds to an extremum or to a step height on the −cnQ(z)/σ-profiles in an i-th
interval between two successive interception points|cnQ(z)/σ|= 0. In Fig. 3 the positive charge
excess values (λ1) correspond to the first maxima in the−cnQ(z)/σ-profiles, which is determined
by the accumulation of counter-ions in the first interfacial layer. The negative values of (λ2)
correspond to the following minima and are related to the accumulation of co-ions in the second layer.
We note that the screening factor |cnQ(z)/σ| gradually becomes a common parameter for
characterising the EDL structure in ILs [12, 15, 16]. Besides, the conception of charge magnitude, similar to ours, was previously applied in analysis of atomistic simulation results in Ref. [15]. However, different from the previous studies, in this work we present results of systematic variation of λi over a much larger set of (renormalized) surface charge densities (see Fig. 3).
The λi–κIon dependence represents a universal analogue of dimensionless “reaction
coordinate” for the EDL restructuring process. It allows the tracking of the evolution of the EDL structure in terms of the charge excess. Namely, with increase of κIon the increase of the
charge excess in the first interfacial layer (λ1) manifests transition from the bulk-like to the
multilayer EDL structure, while the decrease of the charge excess indicates the vanishing of the multilayer EDL structure towards exposure of the monolayer structure at κIon= 1.
The bend on the λi-curves (see Fig. 3) implies slowdown of the accumulation of
counter-ions in the first layer and decrease in the number of the co-counter-ions in the second layer upon increasing κIon. The slowdown is apparently related to a crossover of the two mechanisms of
ion accumulation at the surface: specific packing of ions determined by the strong anion–cation correlation (κIon→0.5) and electrostriction of the first layer (κIon →1)6. The first mechanism
is similar to the so called “lattice saturation” mechanism of ion packing in ILs at charged surfaces [5, 9, 17, ?]. However, differing from the original “saturation” concept it is related to the maximum number density of co-ions, not counter-ions (see Fig. 1). We suggest that the above-mentioned specific packing at κIon ≈ 0.5 is a commensurate multilayer, in which some
ions are arranged in a pseudo lattice (in the “spirit” of Ref. [18]). By means of breaking the anion–cation correlation the electrostriction mechanism [17] allows for more dense packing of counter-ions in a form of the monolayer (κIon →1).
Both mechanisms are related to the overscreening phenomenon. We speculate that the overscreening originates from a tendency of counter-ions to preserve their ion cage structures while entering the first interfacial layer [19]. When counter-ions approach a charged surface, their cage structures transform into the second interfacial layer and cause the formation of the subsequent interfacial layers [20]. In accordance with the electroneutrality principle, the excess of counter-ions in the first layer is induced by the strong anion–cation interaction, on one side, and the electrode–counter-ion interaction, on the other. Thus, the interplay between short-range electrostatic interactions and steric effects results in the ion layering (Fig. 1), the overscreening (Fig. 2), and the accumulation of the excess charge in the ion layers (Fig. 3) [9].
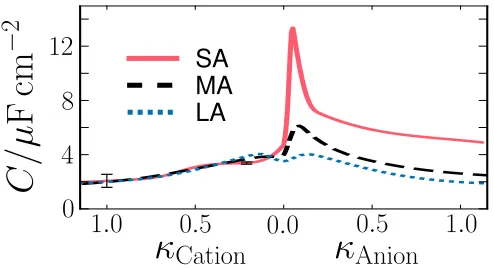
In the region 0 < κIon < 0.5 this interplay also leads to the appearance of peaks at the
differential capacitance (C) dependence on κIon (Fig. 4). A detailed explanation of this
structure–property relation is beyond of the scope of this work and will be considered in detail
6
elsewhere. In this letter we turn the readers attention to the dependence of C on κIon close to
the potential of the monolayer formation.
With the focus on the crossover between the overscreening and crowding regimes, we would like to discuss how this interplay determines the dependence of differential capacitance (C) on κIon, close to the potential of the monolayer formation. The capacitance curves presented on
Fig. 4 show that above κCation ≈ 0.5, the dependence of C on κCation coincides for all studied
systems, presumably due to the common cation. This observation implies that above κIon≈0.5
counter-ions of the first interfacial layer completely govern the response of the EDL to the charging of a surface. The next feature is the (approximate) inverse proportionality ofC values on the anion diameter, close to κAnion= 1.
The basis of this structure–property relationship is the above described complete surface charge compensation by the monolayer of counter-ions. The monolayer structure observed for the coarse-grained models is the simplest form of a compact layer that can be seen in simulations with different IL models at the crossover from overscreening to crowding regimes [14]. Presumably, more complex compact structures can be formed in ILs with complex molecular geometries of ions (e.g. ions with long non-polar tails). The effects of molecular geometry of the ions on the structural reorganisation in the EDL will be considered in our future works.
An experimental confirmation of the compact structure formation is likely to be found for novel ILs with very large ions, specifically adsorbing halogenides or large multivalent counter-ions, like [PW12O40]3− [21, ?, ?]. It is tempting to declare that the monolayer structure
has already been observed via scanning tunneling microscopy in 1-butyl-3-methylimidazolium hexafluorophosphate at Au(111) electrode [22]. However, a careful comparison of similar experimental studies [23, ?] assures us to assign the demonstrated hexagonal pattern of the probable [PF6]− monolayer to a less dense structure forming in our simulations atκIon ≈0.5.
To summarise, in this letter we show that the restructuring of the EDL in ILs has two characteristic crossover regions on the κ-scale: (1) Transition from the bulk-like (κIon = 0) to
the multilayer structure (κIon ≈ 0.5) through the formation of the commensurate multilayer
of counter- and co-ions; and (2) Transition from the multilayer (κIon ≈ 0.5) to the crowded
(κIon > 1) structure through the formation of the monolayer of counter-ions at κIon ≈ 1.0.
The presented results reveal that the evolution of the ion layering (ρN(Ion) in Fig. 1), the
overscreening (−cnQ(z)/σ in Fig. 2) and the charge excess in interfacial layers (λ in Fig.
3) represents a “wave-like” pattern on the κ-scale. The results of our work can be used for predicting and control of ion layering in IL-based interfacial systems. This can be important for various electrochemical and electromechanical applications of ILs [1] because it has been shown recently that the ion layering determines the free energy barriers for a solute approaching the electrode [24, ?] and the potential-dependent variation of nanoscale-level friction at the IL–electrode interfaces [25, ?].
We are grateful for the large amount of computer time provided by the EPSRC-funded ARCHIE-WeSt High Performance Computer Centre (www.archie-west.ac.uk, EPSRC grant no. EP/K000586/1) and for the supercomputing support from the von Neumann-Institut f¨ur Computing, FZ J¨ulich (Project ID ESMI11).
1. References
[1] Fedorov M V and Kornyshev A A 2014Chem. Rev.1142978–3036
[2] Seddon K R and Plechkova N V 2012Ionic Liquids UnCOILed: Critical Expert Overviews (John Wiley & Sons)
[3] Endres F, H¨offt O, Borisenko N, Gasparotto L H, Prowald A, Al-Salman R, Carstens T, Atkin R, Bund A and El Abedin S Z 2010Phys. Chem. Chem. Phys.121724–1732
[6] Mezger M, Schr¨oder H, Reichert H, Schramm S, Okasinski J S, Sch¨oder S, Honkim¨aki V, Deutsch M, Ocko B M, Ralston J, Rohwerder M, Stratmann M and Dosch H 2008Science 322424–428
[7] Kirchner K, Kirchner T, Ivaniˇstˇsev V and Fedorov M 2013Electrochim. Acta110762–771
[8] Atkin R, Borisenko N, Dr¨uschler M, Endres F, Hayes R, Huber B and Roling B 2014J. Mol. Liq.19244–54 [9] Bazant M Z, Storey B D and Kornyshev A A 2011Phys. Rev. Lett.106046102–4
[10] Ivaniˇstˇsev V and Fedorov M V 2014Interface 2365–69
[11] Fedorov M V and Kornyshev A A 2008J. Phys. Chem. B 11211868–11872 [12] Fedorov M V and Kornyshev A A 2008Electrochim. Acta536835–6740
[13] Pronk S, P´all S, Schulz R, Larsson P, Bjelkmar P, Apostolov R, Shirts M R, Smith J C, Kasson P M, Spoel D v d, Hess B and Lindahl E 2013Bioinformatics 29845–854
[14] See Supplementary Material
[15] Feng G, Huang J, Sumpter B G, Meunier V and Qiao R 2011Phys. Chem. Chem. Phys.1314723–14734 [16] Paek E, Pak A J and Hwang G S 2013J. Electrochem. Soc.160A1–A10
[17] Georgi N, Kornyshev A A and Fedorov M V 2010J. Electroanal. Chem.649261–267
[18] Varela L M, Carrete J, Garc´ıa M, Rodr´ıguez J R, Gallego L J, Turmine M and Cabeza O 2011Ionic Liquids: Theory, properties, new approaches ed Kokorin A (Shanghai: InTech) pp 347–366
[19] Ivaniˇstˇsev V, Fedorov M V and Lynden-Bell R M 2014J. Phys. Chem. C 1185841–5847 [20] Yochelis A 2014Phys. Chem. Chem. Phys.162836–2841
[21] Cuvillier N and Rondelez F 1998Thin Solid Films 327-32919–23 [22] Pan G B and Freyland W 2006Chem. Phys. Lett.42796–100
[23] Zhang X, Zhong Y X, Yan J W, Su Y Z, Zhang M and Mao B W 2012Chem. Commun.48582–584 [24] Lynden-Bell R M, Frolov A I and Fedorov M V 2012Phys. Chem. Chem. Phys.142693–2701
Figure 1. The contour map illustrates the dependence of the cation (red) and anion (blue) density at the interface on κ,ρN(z, κ). The data are shown for the model system with medium
anion (MA). The contour interval equals to the bulk density of the IL system, ρbulk; the first
contour starts at 1.5ρbulk, and the maximum peaks of ρN(z, κ) are cut at 7ρbulk to facilitate
the visual analysis. The map clearly indicates changes of the ion layering with κ, the formation of cation/anion monolayers at κ-values close to 1.0 and interfacial crowding of ions at higher κ-values. Insets: (a) schematic representation of a monolayer of anions at the positively charged surface at κAnion = 1 and the bulk-like structured IL close to the monolayer; (b) schematic
representation of a monolayer of cations at κCation = 1 with the sterically determined maximum
Figure 2. −cnQ(z)/σ-profiles illustrate the surface charge (over)screening on the κ-scale for
the model system with medium anion. Profiles at κIon values of 0.5 and 1.0 are highlighted to
underline the vanishing of the charge-density oscillations at κ-values close to 1.0.
Figure 3. Variation of the charge excess in the first (λ1, lighter marks) and in the second (λ2,
darker marks) interfacial layers illustrates the EDL restructuring upon surface charging: from a bulk-like (κIon →0, λi →0) to the multilayer EDL structure (κIon≈0.5,|λi|>0); from the
multilayer to the monolayer EDL structure (κIon→ 1,λi →0); and from the monolayer to the
crowded EDL structure (κIon >1, |λi|>0). The data are shown on the κ-scale for the model
systems with small (◦, SA), medium (♦, MA) and large (, LA) anions. The κIon values of
1.0 correspond to the θmax
Ion values of the charge density σ (see the σ-scale that is shown in the
[image:8.612.176.423.466.643.2]Figure 4. Dependence of the EDL differential capacitance C on κIon for the model systems