© 2019. This manuscript version is made available under the CC-BY-NC-ND 4.0 license http://creativecommons.org/licenses/by-nc-nd/4.0/
https://doi.org/10.1016/j.joca.2018.11.009
1 PATELLAR TENDON ENTHESIS ABNORMALITIES AND THEIR ASSOCIATION WITH KNEE PAIN AND STRUCTURAL ABNORMALITIES IN OLDER ADULTS.
Authors
Siti Maisarah Mattap1, Dawn Aitken1, Karen Wills1, Andrew Halliday2, Changhai Ding1,3, Weiyu Han1, 3, Ishanka Munugoda1, Stephen E Graves4, Michelle Lorimer5, Flavia Cicuttini6,
Graeme Jones1, Laura L Laslett1
1Menzies Institute for Medical Research, University of Tasmania, Hobart, Tasmania,
Australia;
2Department of Medical Imaging, Royal Hobart Hospital, Hobart, Tasmania, Australia; 3Clinical Research Centre, Zhujiang Hospital, Southern Medical University, Guangzhou,
China;
4Australian Orthopaedic Association National Joint Replacement Registry (AOANJRR),
Adelaide, South Australia, Australia;
5South Australian Health and Medical Research Institute (SAHMRI), Adelaide, South
Australia, Australia;
6Department of Epidemiology and Preventive Medicine, Monash University, Melbourne,
Victoria, Australia.
Corresponding author and person to whom reprint requests should be addressed: Siti Maisarah Mattap
© 2019. This manuscript version is made available under the CC-BY-NC-ND 4.0 license http://creativecommons.org/licenses/by-nc-nd/4.0/
https://doi.org/10.1016/j.joca.2018.11.009
2 Private Bag 23
Hobart TAS 7001 Australia;
Co-authors emails [email protected] [email protected]
[email protected] [email protected] [email protected]
[email protected] [email protected]
[email protected] [email protected] [email protected] [email protected]
Abstract 1
Objective: To describe associations between presence of patellar tendon enthesis (PTE) 2
abnormalities and symptoms, structural abnormalities, and total knee replacement (TKR) in 3
older adult cohort. 4
Methods: PTE abnormalities (presence of abnormal bone signal and/or bone erosion), were 5
measured on T2-weighted magnetic resonance images at baseline in 961 community-6
dwelling older adults. Knee pain and function limitation were assessed using Western Ontario
7
3 cartilage volume and defects score, and infrapatellar fat pad (IPFP) area were measured using 9
validated methods. Incidence of TKR was determined by data linkage. 10
Results: Participants with abnormal PTE bone signal and/or erosion was 20%. Cross-11
sectionally, presence of PTE abnormalities was associated with greater pain intensity while 12
going up and down stairs (β=0.22 (95% CI; 0.03, 0.41)), greater risk of femoral BMLs 13
(RR=1.46 (1.12, 1.90)) and worse tibial cartilage defects score (RR=1.70 (1.16, 2.47), and 14
smaller IPFP area (β=-0.27 (-0.47, -0.06) cm2), after adjustment of confounders. 15
Longitudinally, presence of baseline PTE abnormalities was associated with a deleterious 16
increase in tibial BML size (RR=1.52 (1.12, 2.05)) over 10.7 years but not symptoms, other 17
structural changes, or TKR. 18
Conclusion: Patellar tendon enthesis abnormalities are common in older adults. Presence of 19
cross-sectional but not longitudinal associations suggests they are commonly co-exist with 20
other knee structural abnormalities but may not play a major role in symptom development or 21
structural change, excepting tibial BMLs. 22
Keywords: patellar tendon enthesis, enthesis abnormalities, enthesopathy, osteoarthritis, 23
MRI, knee 24
25
Introduction 26
27
The signature feature of knee osteoarthritis (OA) is cartilage volume loss; however, OA is a 28
disease of the whole joint [1, 2]. In theory, it can begin in any joint structure, including the 29
attachment site (enthesis) of a ligament and ligaments themselves [3-5]. 30
31
Entheses have high tensile strength, enabling them to dissipate mechanical stress during joint 32
4 of the ligament, connecting the patella to the tibia. This provides a firm anchor point to keep 34
the patella in position and allow smooth knee bending and straightening [7, 8]. Therefore, 35
abnormalities at the PTE may result in abnormal function and pain, particularly with 36
activities that involve stress on the patellofemoral joint e.g. knee bending, walking up and 37
down stairs. Evidence from histopathological studies of cruciate ligaments in cadavers [9] 38
and magnetic resonance (MR) images of collateral ligament insertions in interphalangeal 39
joints in hand OA [10, 11] demonstrate that abnormal enthesis changes are present in early 40
OA, strengthening the hypothesis that entheses may play a role in OA development. 41
42
While there is evidence for the importance of entheses from histopathology in knees, and MR 43
images in hands, there is no data on associations between knee enthesis abnormalities and 44
pain, physical function, and OA structural abnormalities invivo, using non-invasive methods. 45
Therefore, we aimed to describe associations between presence of PTE abnormalities visible 46
on MR images and knee pain, physical function limitations, and OA structural abnormalities 47
both cross-sectionally and longitudinally over 2.7 and 10.7 years and incidence of total knee 48
replacement (TKR) over 13.3 years in a cohort of community-dwelling older adults. We 49
hypothesised that presence of PTE abnormalities is associated with knee OA symptoms and 50
5 Method
52 53
Participants 54
55
This study uses data from the Tasmanian Older Adult Cohort (TASOAC) Study. TASOAC is 56
a prospective population-based study. Participants aged between 50 and 80 years were 57
randomly selected from the roll of electors in southern Tasmania (population 229 000), a 58
comprehensive population listing, using sex-stratified simple random sampling without 59
replacement (response rate 57%). Participants attended baseline clinic between March 2002 60
and September 2004 and follow-up clinics at (Phase 2) 2.7 and (Phase 4) 10.7 years later, on 61
average. Additional information was available at 13.3 years through data linkage to the 62
Australian Orthopaedic Association National Joint Replacement Registry (AOANJRR). 63
Figure 2 outlines the study timeline. Persons were excluded if they were institutionalised or 64
had contraindications to magnetic resonance imaging (MRI), including metal sutures, 65
presence of shrapnel, iron filings in the eye and claustrophobia. 66
All participants gave written informed consent for the TASOAC study, and the research 67
conducted was in compliance with the Declaration of Helsinki and was approved by the 68
Southern Tasmanian Health and Medical Human Research Ethics Committee. 69
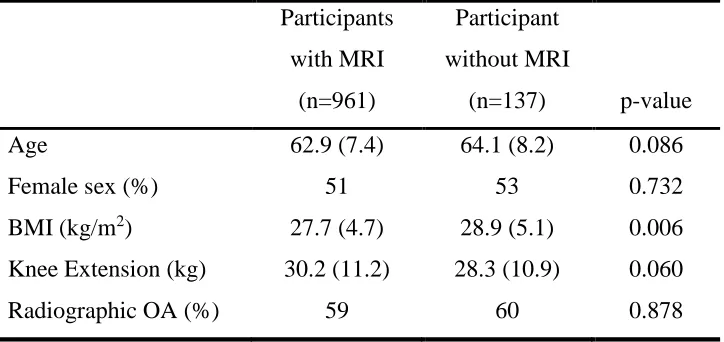
These analyses include 961 participants with baseline MRI (Figure 3), excluding 21 patients 70
whose MR images had artefacts at the PTE sites. Participants with and without baseline MR 71
images had similar demographic profiles (supplementary Table 1), excepting small 72
differences in baseline BMI (mean±SD BMI 27.7 ±4.68 vs 28.9 ±5.13 kg/m2), which were 73
unlikely to be clinically important. 74
75
MRI 76
77
MRI scans of the right knee were performed at baseline, 2.7 and 10.7 years. Knees were 78
imaged in the sagittal plane on a 1.5-T Picker unit (Cleveland, Ohio, USA; baseline and 2.7 79
years) and a Siemens unit (Espree, Pennsylvania, USA; 10.7 year ). Image sequences 80
6 steady state, flip angle 30°, repetition time 31ms, echo time 6.71ms, field of view 16cm, 60 82
partitions, 512 × 512-pixel matrix, slice thickness of 1.5mm without an inter-slice gap; (2) a 83
T2-weighted fat saturation two-dimensional fast spin echo, flip angle 90°, repetition time 84
3,067ms, echo time 112ms, field of view 16cm, 15 partitions, 228 × 256-pixel matrix, slice 85
thickness of 4mm with a between-slice gap of 0.5 to 1.0mm. 86
87
PTE abnormalities 88
89
PTE abnormalities were assessed at baseline on T2-weighted MR images of the right knee, 90
both proximally and distally by one trained observer (SMM), who was trained by a 91
radiologist (AH). Participants with MR imaging artefacts which prevented clear views of 92
PTE sites e.g. alternating bright and dark bands were excluded in the evaluation. As there 93
was no standardised scoring system for PTE abnormalities and adjacent structural 94
abnormalities, we developed a novel scoring system based on a previous study [9]. This 95
system was quick to use, and implementation was straightforward, enabling reproducible 96
scoring for a large number of participants. Features were classified as abnormal signals if the 97
abnormalities were present on more than one consecutive slice. Presence of any abnormality 98
was scored as 1, absence of any abnormality was scored as 0. Quantification abnormality size 99
was not feasible due to image quality. We defined bone signal as an increase in signal 100
intensity (bright abnormal signal) or any abnormal marks at the bone area adjacent to the 101
enthesis site, such as black or white bands and irregular marking next to the cortical bone 102
(Figure 1a and 1b). We defined bone erosion as a sharply bordered dark bone lesion which is 103
visible in two planes with a cortical break seen in at least one plane [12] (Figure 1c and 1d); 104
and tendon signal as an increase in signal intensity of the tendon adjacent to the enthesis 105
(Figure 1e). Deep infrapatellar bursae are fluid-filled sacs at the distal end of the patellar 106
tendon, between the patellar tendon and the tibia; they appear as a hyperintensities on MRI 107
[13] (Figure 1f). Intra-observer reliability was assessed in 20 randomly selected participants 108
after a 2-week interval between the readings using kappa-statistic. 109
The intra-rater agreement was excellent [14] for proximal tendon signal 0.88(95% CI; 0.64 to 110
7 bone signal 0.82 (0.80 to 0.99); proximal, distal bone erosion, and deep infrapatellar bursa 112
have small variability to calculate kappa. 113
114
Pain, physical function limitation, and total WOMAC score 115
116
Knee pain, physical function limitation, and total WOMAC score were assessed using the 117
self-administered Western Ontario and McMaster Universities Osteoarthritis Index 118
(WOMAC) [15] scale, which was scored using a 10-point numeric rating scale from 0 (no 119
pain, no functional deficit) to 9 (most severe pain, most functional deficit). The WOMAC is a 120
valid knee OA patient reported measures of pain, function limitation, and stiffness [15-17]. 121
This study includes 5 components of knee pain and 17 components of function limitation. 122
Participants were asked to rate how much pain, stiffness, and functional deficits they 123
experienced on the day of their questionnaire for their right knee. Knee pain was rated while 124
walking on a flat surface, going up and down stairs, at night while in bed, sitting or lying and 125
standing upright. Each of the pain subscales and physical function subscales are summed to 126
form a score for knee pain (range 0-45), function limitation (range 0-153) and total WOMAC 127
score (pain, physical function, and stiffness) (range 0- 216). 128
129
Evaluation of cartilage morphology 130
131
Cartilage defects were assessed by a trained observer at baseline and 2.7 years on T1-132
weighted MR images (score range, 0 – 4 where 0= normal and 4 indicating full-thickness 133
chondral wear with exposure of subchondral bone), as previously described [18]. Intra-134
observer repeatability calculated in prior study was excellent (intraclass correlation 135
coefficient (ICC) of 0.80 – 0.94) [18]. Change in cartilage defect score from baseline to 136
follow-up was dichotomised to 0 and 1: 0 representing no change or a decrease in cartilage 137
defects and 1 representing an increase of 1 or more on scale 0 – 4. 138
139
Knee tibial and patellar cartilage volume was measured by a trained observer on T1-weighted 140
8 independent workstation using Osiris software as previously described [18]. The coefficient 142
of variation (CV) was 2.1% for the medial tibia, 2.2% for the lateral tibia, and 2.6% for 143
patella as previously reported [18, 19]. 144
145
Bone marrow lesions 146
147
Subchondral BMLs were assessed on T2-weighted fat saturation MRI by using OsiriX 148
software at the medial and lateral sites of tibia and femur, and patella. BMLs were defined as 149
areas of increased signal intensity on T2-weighted, located immediately under the articular 150
cartilage. One trained observer scored the BMLs by measuring the maximum area of the 151
lesion at each site in mm2 using software cursors at baseline and over 10.7 years follow-up. 152
Baseline and 10.7-year images were read paired with the chronological order known to the 153
reader. Intra-observer reliability using two way mixed-effects model [20] was excellent (0.98 154
(0.96, 0.99)), at baseline and 10.7 years follow-up. A deleterious increase in BML size was 155
defined as any change larger than the least significant criterion (52mm2) [21, 22]; this takes 156
into account measurement error and correlations between BML measurements at baseline and 157
10.7 years of follow-up. 158
159
Infrapatellar fat pad (IPFP) area 160
161
Baseline IPFP was measured by manually drawing disarticulation contours around the IPFP 162
boundaries on a section-by-section basis on T2-weighted MR images, using Osiris software 163
(University of Geneva). The maximum area was selected to represent the IPFP size. One 164
observer graded IPFP area on all MRI scans; both intra- and inter-observer reliability 165
calculated in previous study were excellent (ICC = 0.96 for intra-observer reliability, ICC = 166
0.92 for inter-observer reliability) [23]. 167
168
TKR surgery 169
9 The incidence of primary TKR between 1 March 2002 and 21 September 2016 were
171
determined by data linkage to the AOANJRR. The AOANJRR started data collection in 172
Tasmania in September 2000 and collects data from both public and private hospitals. Data 173
validation against State and Territory Health Department data is done using a sequential 174
multi-level matching proces [24]. Matched data were then obtained which included the date, 175
side of joint replacement, primary or revision joint replacement and the reason for the 176
procedure (e.g., OA, osteonecrosis). In this study, we only considered TKRs that were due to 177
OA. 178
Additional available baseline data 179
180
Weight was measured to the nearest 0.1 kg (with shoes, socks, and bulky clothing removed) 181
by using a single pair of electronic scales (Seca Delta Model 707). Height was measured to 182
the nearest 0.1 cm (with shoes and socks removed) by using a stadiometer. Body mass index 183
(BMI) was calculated as kilograms per square meter. A standing anteroposterior semi-flexed 184
view of right knee with 15° of fixed knee flexion was performed and scored individually for 185
osteophytes and joint space narrowing (JSN) on a scale of 0 – 3 [25]. Presence of 186
radiographic osteoarthritis was defined as any score ≥1 for JSN or osteophytes. 187
188
Knee extension strength of the dominant leg measured to the nearest kg using a seated 189
isometric contraction of the knee extensors [26]. Meniscal damage was assessed by a trained 190
observer on T1-weighted MR images as previously described [27], and defined as presence 191
of tear or extrusion on the meniscus dichotomised as 0=absent and ≤1=present. Presence of 192
intra-articular fluid-equivalent signal on T2-weighted MRI at the suprapatellar pouch 193
(suprapatellar effusion) was determined as previously described [28]. 194
195
Statistical analysis 196
197
The primary exposure for all analyses was presence of PTE abnormalities at baseline, defined 198
as presence of abnormal bone signal and/or erosion at PTE. 199
10 As TASOAC is a community-based cohort, there is a mix of people with and without pain. 201
The pain data is non-normally distributed with a large number of zeros, so exponential hurdle 202
models were the most appropriate model to estimate associations between baseline PTE 203
abnormalities and pain outcomes. The hurdle model has two parts: one model for the 204
presence/absence of pain and a second, separate model for pain severity for those who 205
reported pain. We report estimates from these models separately for each outcome as the 206
relative risk of reporting pain and the coefficient for intensity of pain. The interaction 207
between baseline PTE abnormalities and time was used to calculate estimated change in 208
outcomes over 10.7 years associated with PTE abnormalities. Multivariable models were 209
adjusted for age, sex, BMI, knee extension strength, and additionally adjusted for presence of 210
medial tibiofemoral BMLs, cartilage defects, and suprapatellar effusions. 211
212
Log binomial regression was used to assess associations between presence of PTE 213
abnormalities at baseline and prevalence of BMLs at baseline, deleterious increases in BML 214
size over 10.7 years and risk of TKR incidence over 13.3 years, as well as associations with 215
baseline cartilage defects, and risk of worsening of cartilage defects over 2.7 years. All 216
models were adjusted for age, sex, BMI, and baseline cartilage defects. 217
218
Linear regression was used to estimate associations between PTE abnormalities and 219
infrapatellar fat pad at baseline. The models were adjusted for age, sex, BMI, interaction 220
between age and sex, cartilage defects, and BMLs. 221
222
Multilevel mixed effects regression models were used to estimate associations between PTE 223
abnormalities and cartilage volume loss over 10.7 years. Each model included fixed effect 224
terms for PTE abnormalities at baseline, time (years since baseline), and an interaction term 225
for PTE abnormalities with time. The interaction term estimates the additional change in the 226
outcome per year associated with the presence of PTE abnormalities at baseline. A random 227
intercept was specified for each participant to account for individual differences in baseline 228
cartilage volume, and the correlation between the repeated measurements over time was 229
11 change in the cartilage volume loss over 10.7 years were reported for those with PTE
231
abnormalities at baseline compared to those without PTE abnormalities. All models were 232
adjusted for age, sex, BMI, and additionally adjusted for baseline BMLs and cartilage 233
defects. 234
235
All statistical analyses were performed using Stata 15 (Stata-Corp, College Station, Texas, 236
USA). The significant p-value was set at the value of less than 0.05 (two-tailed). 237
12 Results
239 240
Of the 7 abnormalities measured, presence of tendon signal and deep infrapatellar bursa was 241
almost ubiquitous in this group (tendon signal (proximal 97%, distal 84%); deep infrapatellar 242
bursa 93%). Bone signal was infrequent, and bone erosion was rare (bone signal (proximal 243
10%, distal 10%); erosion (proximal 2%, distal 2%)). Prevalence of tendon signal, bone 244
signal, and bone erosion were similar between distal and proximal sites. Therefore, PTE 245
abnormalities were defined as presence of bone signal and/or erosion. At baseline, 20% of 246
participants (n=192/961) had bone signal and/or erosion at the PTE. Of these, 84% had bone 247
signal or erosion at 1 site only, 15% at 2 sites, and <1% at ≥3 sites. 248
249
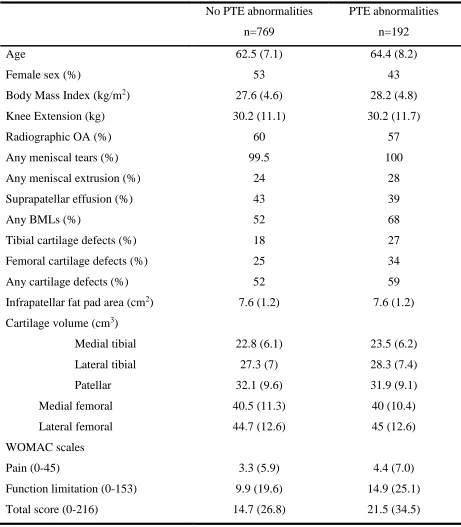
Participants with and without baseline PTE abnormalities had similar demographic and 250
structural profiles (Table 1); however, participants with PTE abnormalities were older, less 251
female, had greater pain, and poorer physical function. They had more OA structural 252
abnormalities (greater proportion of medial and lateral tibiofemoral BMLs, any BMLs, tibial 253
and femoral cartilage defects), compared to participants without PTE abnormalities (Table 1). 254
255
Associations between PTE abnormalities and knee pain, physical function 256
limitation, and total WOMAC score. 257
258
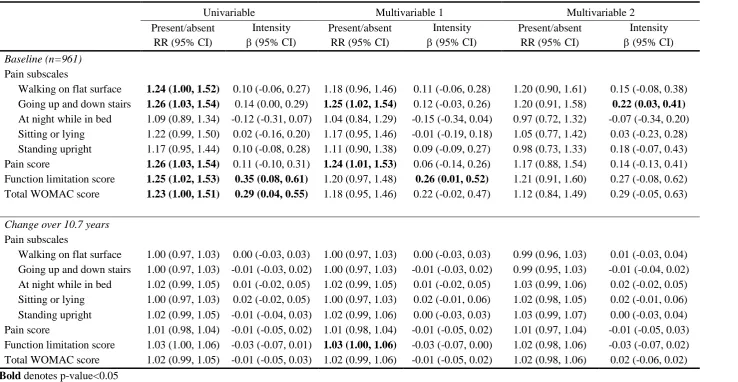
Presence of PTE abnormalities at baseline was associated with higher risk of presence (vs 259
absence) of pain whilst walking on flat surfaces, going up and down stairs, pain score, 260
function limitations score, and total WOMAC score, in the unadjusted model (Table 2). 261
However, associations remained significant only for presence of pain whilst going up and 262
down stairs and pain score after adjustment for demographic factors but not structural 263
abnormalities. 264
265
PTE abnormalities were associated with greater intensity of function limitation and total 266
WOMAC score in the unadjusted model. This association persisted for physical function 267
limitation after adjustment for demographic factors. Only the association between PTE 268
abnormalities and pain intensity going up and down stairs remained statistically significant 269
after further adjustment for structural abnormalities. 270
13 Longitudinally, presence of baseline PTE abnormalities were not associated with change in 272
risk of presence (vs absence) or intensity of knee pain subscales, pain, physical function 273
limitation, and total WOMAC score over 10.7 years in unadjusted data. Presence of PTE 274
abnormalities at baseline conferred a 3% increase in risk of presence of physical function 275
limitation over 10.7 years, after adjustment of demographic factors and knee extension 276
strength (Table 2) but not after further adjustment for structural abnormalities. 277
278
Bone marrow lesions 279
280
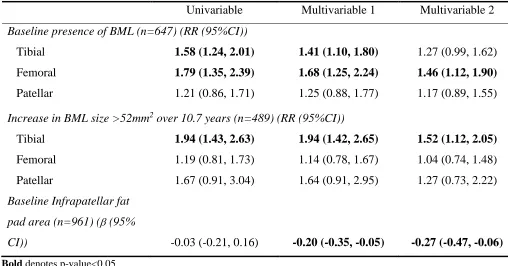
Baseline PTE abnormalities were associated with higher risk of presence of tibial and femoral 281
BMLs at baseline after adjustment for demographic confounders (Table 3). The association 282
remained significant for presence of femoral BMLs but associations diminished for tibial 283
BMLs after further adjustment for site-specific cartilage defects (RR=1.27 (95% CI; 0.99, 284
1.62)). PTE abnormalities were not associated with presence of patellar BMLs at baseline. 285
Over 10.7 years, baseline PTE abnormalities conferred a doubling of risk (RR 1.94) of a 286
deleterious tibial BML size increase (change >52mm2), compared with a participant with no 287
PTE abnormalities; associations persisted after adjustment for demographic and structural 288
factors. PTE abnormalities were not associated with increases in femoral or patellar BML 289
size. 290
291
Infrapatellar fat pad area 292
293
Cross-sectionally, PTE abnormalities at baseline were negatively associated with infrapatellar 294
fat pad area, after adjustment for demographic factors (Table 3). This association 295
strengthened after further adjustment for cartilage defects and BMLs. 296
297
Cartilage defects and volume 298
299
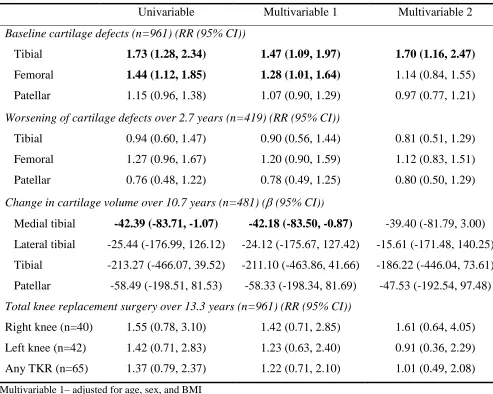
Participants with PTE abnormalities were more likely to have tibial and femoral cartilage 300
defects at baseline (Table 4). Associations persisted after adjustment for demographic factors, 301
but after adjustment for structural factors (site-specific BMLs), associations only persisted for 302
tibial cartilage defects. PTE abnormalities were not associated with patellar cartilage defects 303
at baseline. Longitudinally, presence of baseline PTE abnormalities were not associated with 304
14 abnormalities were associated with medial tibial cartilage volume loss over 10.7 years after 306
adjustment for demographic factors but not after adjustment of structural factors (RR=1.14 307
(0.84, 1.55)) (Table 4). PTE abnormalities were not associated with cartilage volume loss in 308
other compartments. 309
310
Total knee replacement 311
312
Baseline PTE abnormalities were not associated with the incidence of TKR surgery over 13.3 313
15 Discussion
315 316
This study demonstrates that presence of PTE abnormalities (bone signal and erosion) are 317
associated with greater pain going up and down stairs, presence of femoral BMLs, worse 318
tibial cartilage defect score and lower infrapatellar fat pad area cross-sectionally, independent 319
of structural confounders. However, these associations did not persist longitudinally, 320
excepting associations with increases in tibial BML size. PTE abnormalities were not 321
associated with the change in cartilage defects over 2.7 years, cartilage volume loss over 10.7 322
years, or TKR over 13.3 years. This suggests that PTE abnormalities are not causally related 323
to the knee OA process. 324
325
The prevalence of abnormal changes at the PTE site in our study was 20%, comprising bone 326
signal or erosion at 1 enthesis site (17%), 2 sites (3%) or 3 sites (n=1 person only), assessed 327
reproducibly and non-invasively using MR imaging. This is the first time that such 328
abnormalities have been measured in a similar population; previous studies investigated knee 329
cruciate ligaments, collateral ligaments and tendon of interphalangeal joints. The 2% 330
prevalence of enthesis bone erosion in our sample is larger than 0% (0/18 participants) in 331
MRI images of finger joints of 18 healthy participants (age 30-72) [10], however, this study 332
had both a small sample size and a wide age range. Bone pathology was very common at the 333
cruciate ligament enthesis (range 22% to 69%) assessed using MRI amongst osteoarthritic 334
patients [9], which is consistent with prevalence estimates from our study, also in older adults 335
(10% bone signal at one enthesis site). 336
337
PTE abnormalities were most strongly associated with knee pain going up and down stairs, as 338
expected. This association was independent of demographic and structural covariates. This is 339
the activity where patients first report knee pain [29], and is responsible for the largest stress 340
on hips and knees during weight bearing [30, 31]. Pain while stair climbing can be explained 341
through increase in patellofemoral pressure, lateral tilt, and force distribution on the patella 342
[32]. Our results suggest that PTE abnormalities may be associated with knee pain intensity 343
(possibly anterior knee pain); and that this stress may be associated with the abnormal 344
changes that we see on the enthesis site cross-sectionally. However,the effect size was small 345
and may not clinically important, as associations did not persist longitudinally. This is in 346
contrast with other studies which showed that enthesis abnormalities were related to pain in 347
16 We are the first group to explore associations between enthesis abnormalities and joint
349
function. We observed that PTE abnormalities were not associated with presence of 350
functional limitation independent of demographic or structural factors cross-sectionally; 351
however the effect sizes remained similar to pain score. PTE abnormalities were associated 352
with severity of functional limitation after adjustment for demographic factors cross-353
sectionally, but were not independent of structural covariates. Longitudinally, presence of 354
PTE abnormalities were associated with a small (3%) increase in risk of worsening functional 355
limitation over 10.7 years after adjustment for demographic factors, but this was also not 356
independent of structural factors. 357
358
While almost none of the associations between PTE abnormalities and pain or function were 359
independent of structural factors, we did demonstrate that PTE abnormalities are associated 360
with some structural factors: higher risk of the presence of femoral BMLs at baseline and 361
deleterious increases in tibial BML size over 10.7 years. A weaker cross-sectional association 362
was also seen for tibial BMLs (RR 1.27 (0.99, 1.62)) after full adjustment of covariates at 363
baseline. Previous studies have shown that BMLs can originate from entheses [10, 11], and 364
are commonly adjacent to ligament pathology [37]. Our study design collected data on which 365
compartment the BMLs were in, but not specifically whether the BMLs were or were not 366
adjacent to cruciate ligament enthesis and PTE sites. However, we hypothesise that the 367
observed association is due to the impact of joint loading on the tibia [38, 39]. Ligament 368
degeneration and instability changes the biomechanical joint environment and is one of the 369
risk factors for knee osteoarthritis [40]. The patellar tendon provides joint stability [41], so 370
this association may be due to reduced stability and strength of the patellar tendon 371
attachments. 372
373
Presence of PTE abnormalities was associated with smaller infrapatellar fat pad area, and 374
worse tibial cartilage defects cross-sectionally; but not change in these factors longitudinally. 375
Larger infrapatellar IPFP at baseline is protective for knee pain and cartilage damage in this 376
cohort [23, 42]. We have no longitudinal data on infrapatellar fat pad area. 377
378
The lack of consistency between cross-sectional and longitudinal associations with 379
osteoarthritis outcomes raises questions regarding whether PTE abnormalities are related to 380
osteoarthritis or whether it simply co-occurs with other osteoarthritic structural abnormalities. 381
17 abnormalities, but paradoxically our results showed no association with any patellar
383
abnormalities. Associations between PTE abnormalities and knee pain were seen cross-384
sectionally but not longitudinally, supporting an absence of longitudinal associations with 385
knee OA structural abnormalities. Tan et al. suggested that enthesopathy-related osteoarthritis 386
could be a specific subcategory of osteoarthritis [43] based on images of interphalangeal 387
joints; however our study suggests that it may not be a major player in development of knee 388
osteoarthritis. 389
390
Strengths of our study include data from a randomly selected community-dwelling cohort, 391
therefore the results can be generalized to community-dwelling older adults. Data collection 392
continued for 10 years, enabling us to assess longitudinal associations. The scoring system 393
used in this study to assess PTE abnormalities is a novel, non-invasive, simple to use, and 394
reproducible system which used T2-weighted fat saturation MRI. Limitations of our study 395
include a lack of standardised scoring system to assess PTE abnormalities, requiring us to 396
develop one from the literature to suit our study. We were unable to measure the size or 397
volume of deep infrapatellar bursae and presence of enthesophytes due to the available image 398
quality. Better image quality would improve the sensitivity of the analysis; since we are 399
unable to assess volume, this may underestimate the magnitude of any associations, as bursa 400
size more than 2-3mm is considered abnormal [44]. 401
402
Conclusions 403
404
Patellar tendon enthesis abnormalities are common in older adults. Presence of cross-405
sectional but not longitudinal associations suggests they commonly co-exist with other knee 406
structural abnormalities, and they may be a marker of loading manifested through BMLs. 407
However, they may not play a major role in symptom development or structural change with 408
the exception of tibial BMLs. 409
18 DECLARATIONS
411
Ethics approval and consent to participate 412
All research conducted was in compliance with the Declaration of Helsinki and was approved 413
by the Southern Tasmanian Health and Medical Human Research Ethics Committee. All 414
TASOAC participants gave informed written consent at the start of the TASOAC study. 415
Consent for publication 416
Not applicable 417
Availability of data and material 418
The datasets used and/or analysed during the current study are available from the 419
corresponding author on reasonable request. 420
Acknowledgements 421
We thank the participants who made this study possible, and Catrina Boon and Pip Boon 422
for their role in collecting the data, and Jason Rogers for his expertise in entheseal pain. 423
Author’s contributions 424
All authors were involved in drafting the article or revising it for important intellectual 425
content. All authors have approved the final manuscript. Laura L Laslett 426
([email protected]) takes responsibility for the integrity of the work as a whole, from 427
inception to finished article. 428
Conception and design: Mattap, Aitken, Wills, Halliday, Cicuttini, Jones, Laslett 429
Analysis and interpretation of data: Mattap, Aitken, Wills, Jones, Laslett 430
Drafting of the article: Mattap 431
Critical revision of the article for important intellectual content: Mattap, Aitken, Wills, 432
Halliday, Ding, Han, Munugoda, Graves, Lorimer, Cicuttini, Jones, Laslett 433
Final approval of the article: Mattap, Aitken, Wills, Halliday, Ding, Han, Munugoda, 434
Graves, Lorimer, Cicuttini, Jones, Laslett 435
Statistical expertise: Wills 436
Obtaining of funding: Cicuttini, Jones 437
Collection and assembly of data: Mattap, Ding, Munugoda, Graves, Lorimer, Han 438
Role of funding source 439
This work was supported by the National Health and Medical Research Council of Australia; 440
Tasmanian Community Fund; Masonic Centenary Medical Research Foundation; Royal 441
19 sponsor had no role in the design of the study; the collection, analysis, and interpretation of 443
the data; or the writing of the article and the decision to submit it for publication. 444
SM Mattap is supported by the Farrell foundation elite postgraduate scholarship, G Jones and 445
LL Laslett are supported by National Health and Medical Research Council. The researchers 446
work independently of their funders. 447
Competing interest statement 448
The authors declare no competing interest. 449
20 Reference List
1. Lane NE, Brandt K, Hawker G, Peeva E, Schreyer E, Tsuji W, et al. OARSI-FDA initiative: defining the disease state of osteoarthritis. Osteoarthritis Cartilage 2011; 19: 478-482.
2. Loeser RF, Goldring SR, Scanzello CR, Goldring MB. Osteoarthritis: A disease of the joint as an organ. Arthritis Rheum. 2012; 64: 1697-1707.
3. Quasnichka HL, Anderson-MacKenzie JM, Tarlton JF, Sims TJ, Billingham ME, Bailey AJ. Cruciate ligament laxity and femoral intercondylar notch narrowing in early-stage knee osteoarthritis. Arthritis Rheum. 2005; 52: 3100-3109.
4. Anderson-MacKenzie JM, Billingham ME, Bailey AJ. Collagen remodeling in the anterior cruciate ligament associated with developing spontaneous murine
osteoarthritis. Biochem. Biophys. Res. Commun. 1999; 258: 763-767.
5. Setton LA, Elliott DM, Mow VC. Altered mechanics of cartilage with osteoarthritis: Human osteoarthritis and an experimental model of joint degeneration. Osteoarthritis Cartilage 1999; 7: 2-14.
6. Benjamin M, Ralphs JR. Fibrocartilage in tendons and ligaments — an adaptation to compressive load. J. Anat. 1998; 193: 481-494.
7. Lu HH, Thomopoulos S. Functional Attachment of Soft Tissues to Bone:
Development, Healing, and Tissue Engineering. Annu Rev Biomed Eng 2013; 15: 201-226.
8. Basso O, Johnson D, Amis A. The anatomy of the patellar tendon. Knee Surg. Sports Traumatol. Arthrosc. 2001; 9: 2-5.
9. Binks DA, Bergin D, Freemont AJ, Hodgson RJ, Yonenaga T, McGonagle D, et al. Potential role of the posterior cruciate ligament synovio-entheseal complex in joint effusion in early osteoarthritis: a magnetic resonance imaging and histological evaluation of cadaveric tissue and data from the Osteoarthritis Initiative. Osteoarthritis Cartilage 2014; 22: 1310-1317.
10. Tan AL, Grainger AJ, Tanner SF, Shelley DM, Pease C, Emery P, et al. High-resolution magnetic resonance imaging for the assessment of hand osteoarthritis. Arthritis Rheum. 2005; 52: 2355-2365.
11. Tan AL, Toumi H, Benjamin M, Grainger AJ, Tanner SF, Emery P, et al. Combined high-resolution magnetic resonance imaging and histological examination to explore the role of ligaments and tendons in the phenotypic expression of early hand
osteoarthritis. Ann. Rheum. Dis. 2006; 65: 1267-1272.
12. Østergaard M, Peterfy C, Conaghan P, McQueen F, Bird P, Ejbjerg B, et al.
OMERACT Rheumatoid Arthritis Magnetic Resonance Imaging Studies. Core set of MRI acquisitions, joint pathology definitions, and the OMERACT RA-MRI scoring system. J. Rheumatol. 2003; 30: 1385-1386.
13. Chatra PS. Bursae around the knee joints. Indian J. Radiol. Imaging 2012; 22: 27-30. 14. Landis JR, Koch GG. The measurement of observer agreement for categorical data.
Biometrics 1977; 33: 159-174.
15. Bellamy N, Buchanan WW, Goldsmith CH, Campbell J, Stitt LW. Validation study of WOMAC: a health status instrument for measuring clinically important patient
relevant outcomes to antirheumatic drug therapy in patients with osteoarthritis of the hip or knee. J. Rheumatol. 1988; 15: 1833-1840.
16. McConnell S, Kolopack P, Davis AM. The Western Ontario and McMaster
Universities Osteoarthritis Index (WOMAC): a review of its utility and measurement properties. Arthritis Care Res. (Hoboken) 2001; 45: 453-461.
21 18. Ding C, Garnero P, Cicuttini F, Scott F, Cooley H, Jones G. Knee cartilage defects:
association with early radiographic osteoarthritis, decreased cartilage volume, increased joint surface area and type II collagen breakdown. Osteoarthritis Cartilage 2005; 13: 198-205.
19. Zhu Z, Ding C, Jin X, Antony B, Han W, Laslett LL, et al. Patellofemoral Bone Marrow Lesions: Natural History and Associations With Pain and Structure. Arthritis Care Res. (Hoboken) 2016; 68: 1647-1654.
20. Shrout PE, Fleiss JL. Intraclass correlations: uses in assessing rater reliability. Psychol. Bull. 1979; 86: 420-428.
21. Dore D, Quinn S, Ding C, Winzenberg T, Zhai G, Cicuttini F, et al. Natural history and clinical significance of MRI-detected bone marrow lesions at the knee: a
prospective study in community dwelling older adults. Arthritis Res. Ther. 2010; 12: R223.
22. Nguyen TV, Eisman JA. Assessment of Significant Change in BMD: A New Approach. J. Bone Miner. Res. 2000; 15: 369-370.
23. Han W, Cai S, Liu Z, Jin X, Wang X, Antony B, et al. Infrapatellar fat pad in the knee: is local fat good or bad for knee osteoarthritis? Arthritis Res. Ther. 2014; 16: R145.
24. Australian Orthopaedic Association National Joint Replacement Registry. Annual Report - 2016. Adelaide2016.
25. Altman RD, Hochberg M, Murphy WA, Jr., Wolfe F, Lequesne M. Atlas of individual radiographic features in osteoarthritis. Osteoarthritis Cartilage 1995; 3 Suppl A: 3-70.
26. Scott D, Blizzard L, Fell J, Jones G. Prospective study of self-reported pain, radiographic osteoarthritis, sarcopenia progression, and falls risk in community-dwelling older adults. Arthritis Care Res. (Hoboken) 2012; 64: 30-37.
27. Berthiaume MJ, Raynauld JP, Martel-Pelletier J, Labonte F, Beaudoin G, Bloch DA, et al. Meniscal tear and extrusion are strongly associated with progression of
symptomatic knee osteoarthritis as assessed by quantitative magnetic resonance imaging. Ann. Rheum. Dis. 2005; 64: 556-563.
28. Wang X, Jin X, Han W, Cao Y, Halliday A, Blizzard L, et al. Cross-sectional and Longitudinal Associations between Knee Joint Effusion Synovitis and Knee Pain in Older Adults. J. Rheumatol. 2016; 43: 121-130.
29. Hensor EM, Dube B, Kingsbury SR, Tennant A, Conaghan PG. Toward a clinical definition of early osteoarthritis: onset of patient-reported knee pain begins on stairs. Data from the osteoarthritis initiative. Arthritis Care Res. 2015; 67: 40-47.
30. Andriacchi TP, Andersson GB, Fermier RW, Stern D, Galante JO. A study of lower-limb mechanics during stair-clower-limbing. JBJS 1980; 62: 749-757.
31. Costigan PA, Deluzio KJ, Wyss UP. Knee and hip kinetics during normal stair climbing. Gait Posture 2002; 16: 31-37.
32. Goudakos IG, König C, Schöttle PB, Taylor WR, Singh NB, Roberts I, et al. Stair climbing results in more challenging patellofemoral contact mechanics and kinematics than walking at early knee flexion under physiological-like quadriceps loading. J. Biomech. 2009; 42: 2590-2596.
33. Kiris A, Kaya A, Ozgocmen S, Kocakoc E. Assessment of enthesitis in ankylosing spondylitis by power Doppler ultrasonography. Skeletal Radiol. 2006; 35: 522-528. 34. Williams SK, Brage M. Heel pain—plantar fasciitis and Achilles enthesopathy. Clin.
Sports Med. 2004; 23: 123-144.
22 36. Olivieri I, Barozzi L, Padula A, De Matteis M, Pierro A, Cantini F, et al.
Retrocalcaneal bursitis in spondyloarthropathy: assessment by ultrasonography and magnetic resonance imaging. J. Rheumatol. 1998; 25: 1352-1357.
37. Hernandez-Molina G, Guermazi A, Niu J, Gale D, Goggins J, Amin S, et al. Central bone marrow lesions in symptomatic knee osteoarthritis and their relationship to anterior cruciate ligament tears and cartilage loss. Arthritis Rheum. 2008; 58: 130-136.
38. Beckwée D, Vaes P, Shahabpour M, Muyldermans R, Rommers N, Bautmans I. The Influence of Joint Loading on Bone Marrow Lesions in the Knee: A Systematic Review With Meta-analysis. Am. J. Sports Med. 2015; 43: 3093-3107.
39. Bennell KL, Creaby MW, Wrigley TV, Bowles K-A, Hinman RS, Cicuttini F, et al. Bone marrow lesions are related to dynamic knee loading in medial knee
osteoarthritis. Ann. Rheum. Dis. 2010; 69: 1151-1154.
40. Øiestad BE, Engebretsen L, Storheim K, Risberg MA. Knee Osteoarthritis after Anterior Cruciate Ligament Injury. Am. J. Sports Med. 2009; 37: 1434-1443. 41. Loudon JK. Biomechanics and Pathomechanics of the Patellofemoral Joint. Int. J.
Sports Phys. Ther. 2016; 11: 820-830.
42. Pan F, Han W, Wang X, Liu Z, Jin X, Antony B, et al. A longitudinal study of the association between infrapatellar fat pad maximal area and changes in knee symptoms and structure in older adults. Ann. Rheum. Dis. 2015; 74: 1818-1824.
43. McGonagle D, Tan AL, Carey J, Benjamin M. The anatomical basis for a novel classification of osteoarthritis and allied disorders. J. Anat. 2010; 216: 279-291. 44. McCarthy CL, McNally EG. The MRI appearance of cystic lesions around the knee.
23 Tables
Table 1. Characteristics of participants divided by presence of PTE abnormalities at baseline (n=961).
No PTE abnormalities n=769
PTE abnormalities n=192
Age 62.5 (7.1) 64.4 (8.2)
Female sex (%) 53 43
Body Mass Index (kg/m2) 27.6 (4.6) 28.2 (4.8)
Knee Extension (kg) 30.2 (11.1) 30.2 (11.7)
Radiographic OA (%) 60 57
Any meniscal tears (%) 99.5 100
Any meniscal extrusion (%) 24 28
Suprapatellar effusion (%) 43 39
Any BMLs (%) 52 68
Tibial cartilage defects (%) 18 27
Femoral cartilage defects (%) 25 34
Any cartilage defects (%) 52 59
Infrapatellar fat pad area (cm2) 7.6 (1.2) 7.6 (1.2) Cartilage volume (cm3)
Medial tibial 22.8 (6.1) 23.5 (6.2)
Lateral tibial 27.3 (7) 28.3 (7.4)
Patellar 32.1 (9.6) 31.9 (9.1)
Medial femoral 40.5 (11.3) 40 (10.4)
Lateral femoral 44.7 (12.6) 45 (12.6)
WOMAC scales
Pain (0-45) 3.3 (5.9) 4.4 (7.0)
Function limitation (0-153) 9.9 (19.6) 14.9 (25.1)
Total score (0-216) 14.7 (26.8) 21.5 (34.5)
Mean (SD) except for percentages.
Baseline any cartilage defects score was dichotomised to normal/focal blistering (0 and 1) and any loss of chondral thickness (2 or more).
Suprapatellar effusion was dichotomised to normal (0 and 1) and pathological effusion as any score of ≥2.
24
Table 2. Associations of PTE abnormalities and pain, function limitation, and total WOMAC score at baseline and change over 10.7 years.
Univariable Multivariable 1 Multivariable 2
Present/absent RR (95% CI)
Intensity
β (95% CI)
Present/absent RR (95% CI)
Intensity
β (95% CI)
Present/absent RR (95% CI)
Intensity
β (95% CI)
Baseline (n=961)
Pain subscales
Walking on flat surface 1.24 (1.00, 1.52) 0.10 (-0.06, 0.27) 1.18 (0.96, 1.46) 0.11 (-0.06, 0.28) 1.20 (0.90, 1.61) 0.15 (-0.08, 0.38)
Going up and down stairs 1.26 (1.03, 1.54) 0.14 (0.00, 0.29) 1.25 (1.02, 1.54) 0.12 (-0.03, 0.26) 1.20 (0.91, 1.58) 0.22 (0.03, 0.41)
At night while in bed 1.09 (0.89, 1.34) -0.12 (-0.31, 0.07) 1.04 (0.84, 1.29) -0.15 (-0.34, 0.04) 0.97 (0.72, 1.32) -0.07 (-0.34, 0.20)
Sitting or lying 1.22 (0.99, 1.50) 0.02 (-0.16, 0.20) 1.17 (0.95, 1.46) -0.01 (-0.19, 0.18) 1.05 (0.77, 1.42) 0.03 (-0.23, 0.28)
Standing upright 1.17 (0.95, 1.44) 0.10 (-0.08, 0.28) 1.11 (0.90, 1.38) 0.09 (-0.09, 0.27) 0.98 (0.73, 1.33) 0.18 (-0.07, 0.43)
Pain score 1.26 (1.03, 1.54) 0.11 (-0.10, 0.31) 1.24 (1.01, 1.53) 0.06 (-0.14, 0.26) 1.17 (0.88, 1.54) 0.14 (-0.13, 0.41)
Function limitation score 1.25 (1.02, 1.53) 0.35 (0.08, 0.61) 1.20 (0.97, 1.48) 0.26 (0.01, 0.52) 1.21 (0.91, 1.60) 0.27 (-0.08, 0.62)
Total WOMAC score 1.23 (1.00, 1.51) 0.29 (0.04, 0.55) 1.18 (0.95, 1.46) 0.22 (-0.02, 0.47) 1.12 (0.84, 1.49) 0.29 (-0.05, 0.63)
Change over 10.7 years
Pain subscales
Walking on flat surface 1.00 (0.97, 1.03) 0.00 (-0.03, 0.03) 1.00 (0.97, 1.03) 0.00 (-0.03, 0.03) 0.99 (0.96, 1.03) 0.01 (-0.03, 0.04)
Going up and down stairs 1.00 (0.97, 1.03) -0.01 (-0.03, 0.02) 1.00 (0.97, 1.03) -0.01 (-0.03, 0.02) 0.99 (0.95, 1.03) -0.01 (-0.04, 0.02)
At night while in bed 1.02 (0.99, 1.05) 0.01 (-0.02, 0.05) 1.02 (0.99, 1.05) 0.01 (-0.02, 0.05) 1.03 (0.99, 1.06) 0.02 (-0.02, 0.05)
Sitting or lying 1.00 (0.97, 1.03) 0.02 (-0.02, 0.05) 1.00 (0.97, 1.03) 0.02 (-0.01, 0.06) 1.02 (0.98, 1.05) 0.02 (-0.01, 0.06)
Standing upright 1.02 (0.99, 1.05) -0.01 (-0.04, 0.03) 1.02 (0.99, 1.06) 0.00 (-0.03, 0.03) 1.03 (0.99, 1.07) 0.00 (-0.03, 0.04)
Pain score 1.01 (0.98, 1.04) -0.01 (-0.05, 0.02) 1.01 (0.98, 1.04) -0.01 (-0.05, 0.02) 1.01 (0.97, 1.04) -0.01 (-0.05, 0.03)
Function limitation score 1.03 (1.00, 1.06) -0.03 (-0.07, 0.01) 1.03 (1.00, 1.06) -0.03 (-0.07, 0.00) 1.02 (0.98, 1.06) -0.03 (-0.07, 0.02)
Total WOMAC score 1.02 (0.99, 1.05) -0.01 (-0.05, 0.03) 1.02 (0.99, 1.06) -0.01 (-0.05, 0.02) 1.02 (0.98, 1.06) 0.02 (-0.06, 0.02)
Bold denotes p-value<0.05
Multivariable 1- adjusted for age, sex, BMI, knee extension strength
Multivariable 2 – further adjusted for presence of medial tibiofemoral BMLs, cartilage defects, and suprapatellar effusion.
25
Table 3. Associations of baseline PTE abnormalities and presence of baseline BMLs, increase in BML size >52mm2 over 10.7 years, and baseline infrapatellar fat pad area.
Univariable Multivariable 1 Multivariable 2
Baseline presence of BML (n=647) (RR (95%CI))
Tibial 1.58 (1.24, 2.01) 1.41 (1.10, 1.80) 1.27 (0.99, 1.62) Femoral 1.79 (1.35, 2.39) 1.68 (1.25, 2.24) 1.46 (1.12, 1.90) Patellar 1.21 (0.86, 1.71) 1.25 (0.88, 1.77) 1.17 (0.89, 1.55)
Increase in BML size >52mm2 over 10.7 years (n=489) (RR (95%CI))
Tibial 1.94 (1.43, 2.63) 1.94 (1.42, 2.65) 1.52 (1.12, 2.05) Femoral 1.19 (0.81, 1.73) 1.14 (0.78, 1.67) 1.04 (0.74, 1.48) Patellar 1.67 (0.91, 3.04) 1.64 (0.91, 2.95) 1.27 (0.73, 2.22)
Baseline Infrapatellar fat
pad area (n=961) (β (95%
CI)) -0.03 (-0.21, 0.16) -0.20 (-0.35, -0.05) -0.27 (-0.47, -0.06) Bold denotes p-value<0.05
Multivariable 1– adjusted for age, sex, and BMI. Baseline infrapatellar fat pad were also adjusted for interaction of age and sex.
Multivariable 2– baseline presence of BMLs and BML size change >52mm2 over 10.7 years were further
adjusted for baseline cartilage defects, and baseline BMLs for change in BML size. Baseline infrapatellar fat pad were further adjusted for cartilage defects and BMLs.
26
Table 4. Association of baseline PTE abnormalities and baseline cartilage defects, improved/worsening of cartilage defects over 2.7 years, cartilage volume over 10.7 years and TKR incident over 13.3 years.
Univariable Multivariable 1 Multivariable 2
Baseline cartilage defects (n=961) (RR (95% CI))
Tibial 1.73 (1.28, 2.34) 1.47 (1.09, 1.97) 1.70 (1.16, 2.47) Femoral 1.44 (1.12, 1.85) 1.28 (1.01, 1.64) 1.14 (0.84, 1.55) Patellar 1.15 (0.96, 1.38) 1.07 (0.90, 1.29) 0.97 (0.77, 1.21)
Worsening of cartilage defects over 2.7 years (n=419) (RR (95% CI))
Tibial 0.94 (0.60, 1.47) 0.90 (0.56, 1.44) 0.81 (0.51, 1.29) Femoral 1.27 (0.96, 1.67) 1.20 (0.90, 1.59) 1.12 (0.83, 1.51) Patellar 0.76 (0.48, 1.22) 0.78 (0.49, 1.25) 0.80 (0.50, 1.29)
Change in cartilage volume over 10.7 years (n=481) (β (95% CI))
Medial tibial -42.39 (-83.71, -1.07) -42.18 (-83.50, -0.87) -39.40 (-81.79, 3.00) Lateral tibial -25.44 (-176.99, 126.12) -24.12 (-175.67, 127.42) -15.61 (-171.48, 140.25) Tibial -213.27 (-466.07, 39.52) -211.10 (-463.86, 41.66) -186.22 (-446.04, 73.61) Patellar -58.49 (-198.51, 81.53) -58.33 (-198.34, 81.69) -47.53 (-192.54, 97.48)
Total knee replacement surgery over 13.3 years (n=961) (RR (95% CI))
Right knee (n=40) 1.55 (0.78, 3.10) 1.42 (0.71, 2.85) 1.61 (0.64, 4.05) Left knee (n=42) 1.42 (0.71, 2.83) 1.23 (0.63, 2.40) 0.91 (0.36, 2.29) Any TKR (n=65) 1.37 (0.79, 2.37) 1.22 (0.71, 2.10) 1.01 (0.49, 2.08)
Multivariable 1– adjusted for age, sex, and BMI
Multivariable 2– baseline cartilage defects were further adjusted for BMLs. Worsening of cartilage defect, change in cartilage volume loss, and TKR were further adjusted for baseline BMLs and cartilage defects. Baseline and worsening of cartilage defects were assessed using log binomial regression. Change in cartilage volume were assessed using mixed model; β-coefficient represents 1mm3 change in cartilage
27 Figure 1. Patellar tendon and enthesis (PTE) abnormalities measured on T2-w FSE MRI, indicated by white arrows. 1a shows bone signal (increased signal intensity) at the proximal end of PTE and 1b shows bone signal (increased signal intensity with black band) at the distal end of PTE. 1c shows bone erosion at the proximal end of PTE and 1d shows bone erosion at the distal end of PTE. 1e shows proximal and distal tendon signal, while 1f shows presence of deep infrapatellar bursae between the tibia, distal PTE and infrapatellar fat pad. Note: Tendon signal abnormalities and deep infrapatellar bursa were ubiquitous
abnormalities and thus were not included in the scoring system for PTE abnormalities
Figure 2. Study time line.
29
Phase 1
Baseline
Phase 2
2.7 years
Phase 4
10.7 years
Number of knee replacements over 13.3 years Change in WOMAC scales
Change in cartilage volume Change in BMLs size Change in cartilage defects
Time
PTE abnormalities WOMAC scales Cartilage volume Cartilage defects IPFP area BMLs
Cartilage defects
30 Loss to follow-up n=104
Deceased =8
Moved interstate or overseas =13
Moved to nursing home =0 Joint replacement =2 Physically unable =22
Participants at Phase 2 n=857
MRI machine decommissioned n=438 Participants included in the analysis at Phase 1 N=961
Participants at Phase 3 n=752
Loss to follow-up n=105
No MRI =3 Deceased =18
Moved interstate or overseas =13
Moved to nursing home =6 Physically unable =23
31 Participants at Phase 4 n=557
Loss to follow-up for BMLs and tibial cartilage volume
measures n=76 No T2-weighted MRI n=2
No MRI n=61 No MRI at baseline n=5
Loss to follow-up n=195
No MRI =32 Deceased =31
Moved interstate or overseas =19
Moved to nursing home =8 Joint replacement =19
32 Supplementary table.
Table 5. The demographic differences between participants included and excluded (without MRI scans (n=116) and artefacts at PTE sites (n=21)) in this study analysis at baseline.
Participants with MRI
(n=961)
Participant without MRI
(n=137) p-value
Age 62.9 (7.4) 64.1 (8.2) 0.086
Female sex (%) 51 53 0.732
BMI (kg/m2) 27.7 (4.7) 28.9 (5.1) 0.006 Knee Extension (kg) 30.2 (11.2) 28.3 (10.9) 0.060
Radiographic OA (%) 59 60 0.878