THE EFFECTS OF ß-ADRENOCEPTOR ACTIVATION ON CONTRACTION IN NORMAL AND FATIGUED RAT SKELETAL MUSCLE
by
Simeon Peter Cairns (BSc. Hons.)
A thesis submitted for the degree of Doctor of Philosophy of the AUSTRALIAN NATIONAL UNIVERSITY
The work presented in this thesis was performed entirely by the candidate.
This thesis is dedicated to the memory of HILDA MARIANA KERR
ABSTRACT
The ability of catecholamines to modulate contractile force was examined in directly stimulated bundles of fibres isolated from rat skeletal muscle. Terbutaline, a selective ß2-adrenergic agonist, was used to activate the catecholamine receptors normally present in skeletal muscle.
Terbutaline (10 jiM) potentiated non-fatigued isometric twitches and tetani by about 15% in the slow-twitch soleus and potentiated twitches by about 7% in fast-twitch stemomastoid fibres. Force potentiation was not modified by denervation indicating that terbutaline acted directly on the muscle fibres. Adrenaline, a physiological
catecholamine, also increased contractile force suggesting that this response may be functionally important. Propranolol, a ß-adrenoceptor blocker, abolished and dibutyryl- cAMP (DBcAMP), a membrane permeable derivative of cAMP, mimicked the force potentiation by terbutaline suggesting that ß-adrenoceptor activation and myoplasmic cAMP were involved in this response.
In addition, terbutaline and DBcAMP accelerated relaxation in normal soleus fibres whereas relaxation in stemomastoid fibres was slowed. The acceleration of relaxation in soleus may be due to the cAMP-dependent phosphorylation of phospholamban, a sarcoplasmic reticulum (SR) protein, which increases the activity of the SR Ca2+ pumps and hence accelerates myoplasmic Ca2+ removal.
The positive inotropic effect of terbutaline did not involve: (i) enhanced
sodium-potassium (Na-K) pump activity; (ii) enhanced action potential activation; (iii) accelerated carbohydrate metabolism; (iv) or an increased trans-sarcolemmal Ca2+ current. Caffeine (1 mM) produced similar effects to terbutaline on peak tetanic force but not on relaxation. Pretreatment with caffeine attenuated or abolished the
potentiation of twitches and tetani by terbutaline. This suggests that the myofilaments are not involved in the force potentiation and it is postulated that terbutaline, via myoplasmic cAMP, causes additional Ca2+ release from the SR which increases force.
High-frequency fatigue (HFF) - the decline of force in prolonged tetani - occurred more rapidly in the fast-twitch than in the slow-twitch fibres. Maximal potassium
may be caused by changes in the ionic concentrations in the T-system occurring as a direct consequence of action potential activity.
Terbutaline and DBcAMP both slowed HFF. This effect was not caused by a
stimulation of the Na-K pump. Caffeine (1-5 mM) caused a concentration-dependent slowing of HFF and the terbutaline-induced increase in fatigue resistance was abolished in the presence of 1 mM caffeine. It is hypothesized that the terbutaline-induced
iii
CONTENTS
Abstract i
Contents iii
Abbreviations vii
Definitions viii
Acknowledgements ix
Publications x
Chapter 1 GENERAL INTRODUCTION
1.1 Introduction 1
1.2 Cellular mechanisms of contractile activation 2
1.3 Regulation of muscle force 9
1.4 Aims of the experiments 13
Chapter 2 GENERAL METHODS
2.1 Muscle Preparations 14
2.2 Solutions and drugs 16
2.3 Force recording and stimulation 17
2.4 Experimental protocol 18
2.5 Membrane potential studies 20
2.6 Data analysis and presentation 20
2.7 Definitions 21
Chapter 3 EFFECTS OF ß-ADRENOCEPTOR ACTIVATION ON
CONTRACTION IN NON-FATIGUED SKELETAL MUSCLE
3.1 Introduction 24
3.2 Methods 25
3.3 Results
(a) Effects of terbutaline on isometric contractions in soleus muscle 26 (b) Effects of terbutaline on isometric contractions in
iv (c) Effects of terbutaline on isometric contractions
in denervated soleus muscle 28
(d) Effects of adrenaline on isometric contractions 29
(e) Effects of propranolol and dibutyryl-cAMP on isometric contraction 30
3.4 Discussion
(a) Effects of ß-adrenoceptor activation on isometric contractions in
different fibre-types 32
(b) Effects of ß-adrenoceptor activation on isometric contractions in
denervated muscle 33
(c) Pharmacological mechanism of action of terbutaline 34
(d) Physiological mechanisms for the force potentiation by terbutaline 35
(e) Physiological mechanisms for the effects of terbutaline on relaxation 36
3.5 Summary 38
Chapter 4 MECHANISM OF THE ß-ADRENERGIC
POTENTIATION OF ISOMETRIC FORCE
4.1 Introduction 40
4.2 Methods 41
4.3 Results
(a) Effect of terbutaline and dibutyryl-cAMP on peak tetanic force at
different stimulation frequencies 41
(b) Effect of terbutaline on peak tetanic force in solutions with a
high sodium concentration 42
(c) Role of the sodium-potassium pump in the force response to
terbutaline 43
(d) Effect of terbutaline and dibutyryl-cAMP on potassium contractures 44
(e) Effect o f terbutaline on peak tetanic force in the presence of
iodoacetate 45
(f) Effect of terbutaline on peak tetanic force in the presence of
nifedipine 45
V
(h) Effect of terbutaline on isometric force in the presence of
caffeine 48
4.4 Discussion
(a) Role of the action potential in the positive inotropic effect
of terbutaline 49
(b) Mechanism of action of caffeine in rat skeletal muscle 51
(c) Role of the myofilaments in the force potentiation by terbutaline 53 (d) Role of excitation-contraction coupling in the positve inotropic
effect of terbutaline 54
(e) Model for the force potentiation by terbutaline 57
4.5 Summary 57
Chapter 5 MECHANISMS OF HIGH-FREQUENCY FATIGUE
5.1 Introduction 59
5.2 Methods 61
5.3 Results
(a) High-frequency fatigue: Role of fibre-type 61
(b) Effect of denervation on the rate of high-frequency fatigue 64
(c) Potassium contractures during high-frequency fatigue 65
(d) Effect of extracellular ions on the rate cf high-frequency fatigue 66 (e) Effect of stimulation frequency on the rate of high-frequency fatigue 68
(f) Rate of force recovery from high-frequency fatigue 69
5.4 Discussion
(a) Possible site/s of failure in high-frequency fatigue 70
(b) Role of trans-sarcolemmal ionic shifts in high-frequency fatigue 72 (c) Differences in the rate of high-frequency fatigue with fibre-type
and denervation 75
(d) Effect of high-frequency fatigue on the rate of relaxation 76
v i
Chapter 6 EFFECTS OF ß-ADRENOCEPTOR ACTIVATION ON
CONTRACTION IN FATIGUED SKELETAL MUSCLE
6.1 Introduction 78
6.2 Methods 79
6.3 Results
(a) Effect of terbutaline and dibutyryl-cAMP on high-frequency fatigue 79 (b) Effect of terbutaline on high-frequency fatigue: Role of the
sodium-potassium pump 80
(c) Effect of terbutaline on high-frequency fatigue: Role of the
calcium release channel 82
6.4 Discussion
(a) Role of the sodium-potassium pump in high-frequency fatigue 84 (b) Effect of ß-adrenoceptor activation on high-frequency fatigue:
Role of the sodium-potassium pump 85
(c) Effect of ß-adrenoceptor activation on high-frequency fatigue:
Role of the calcium-release channel 86
6.5 Summary 87
Chapter 7 GENERAL DISCUSSION 89
vii
A B B R E V IA T IO N S A T P A d en o sin e trisphosph ate
C a2+ C alciu m ion
[C a2+ ]i In trac ellu lar free calcium con cen tratio n C a-p u m p C alciu m p u m p (C a2+ -A T P ase)
cA M P C yclic aden o sine m o nophosp hate
c A M P -P K C y clic ad en osine m o n o p h o sp h ate p ro tein kin ase
c i - C h lo rid e ion
CN S C entral N ervous System
D B cA M P D ib u ty ry l cyclic aden osine m o n o p h o sp h ate D H P -re c e p to r D ih y d ro p y rid in e recep to r
E -C co u p lin g E x citatio n -co n tra ctio n co upling E M G E lectro m y o g ram
F IX F atig u e index at x seconds H F F H ig h -freq u en cy fatigue IP3 Ino sito l trisp ho sp hate K + P o tassiu m ion
K -co n tractu re P o tassiu m con tracture
M B cA M P M o n o b u ty ry l cy clic aden osine m o n o p h o sp h ate
N a+ S odium ion
N a-K pu m p S o d iu m -p o tassiu m pum p (N a+ -K + -A T P ase) p C a -lo g lO ([C a2 + ])
S R S arcop lasm ic reticulum T E A T etraeth y lam m o n iu m ion T -sy stem T ran sv erse tu b u lar system
viii
DEFINITIONS
Contraction: refers to an increase in muscle force as as result of electrical stimulation, i.e. initiated by action potentials.
Contracture: refers to an increase in muscle force occurring independently of stimulation.
Excitation-contraction coupling: refers to those processes by which depolarization of the T-system membrane leads to Ca2+ release from the sarcoplasmic reticulum.
Fatigue: refers to any decline in the isometric force generating capacity of a muscle or fibre as a consequence of direct electrical stimulation.
Fibrillation: refers to the spontaneous force oscillations which are seen in denervated muscle. They are thought to be caused by twitches in individual fibres resulting from the spontaneous firing of action potentials.
Ionic shift: In this thesis refers specifically to the change in the trans-sarcolemmal ion gradients resulting from repetitive stimulation, i.e. K+ accumulation and Na+ depletion in the T-system, as well as increased [Na+] and decreased [K+] in the myoplasm.
Mechanical inactivation: refers to the spontaneous decay of force that occurs under conditions of maintained depolarization.
Relaxation: refers to the decay of force from the peak value back to the baseline level which occurs following the cessation of stimulation.
ACKNOWLEDGEMENTS
I would like to express my thanks to:
Dr. Angela Dulhunty, my supervisor, for all her advice and encouragement during the course of this work, and especially for her excellent comments on this thesis.
Prof. Peter Gage for the invitation to study muscle physiology in the Physiology Department at The John Curtin School of Medical Research.
Drs. Micheal Crouch, Dirk Van Helden, and Häkan Westerblad for their expert comments on various chapters in this thesis.
Prof. Pei-Hong Zhu, for stimulating discussion and encouragement during his stay in Canberra.
Ann and Nila for their excellent proofreading of this thesis.
Fellow members of SLAB (Bruce, Louis and Patto), as well as Anna, Guna, John, and Sharan for their neverending support.
All the technical staff of the Physiology Department especially Suzanne and Mary.
The New Zealand Maori Education Foundation for their supporting scholarship.
PUBLICATIONS
CAIRNS, S. P., MCCAIG, C. D. & HARRIS, A. J. (1986) Determination for
motoneuron death during embryonic development of rat spinal cord. Proceedings of the University o f Otago Medical School 64, 3-4
CAIRNS, S. P. & DULHUNTY, A. F. (1988) Effect of tetanus duration on the relaxation rate of rat fast and slow skeletal muscle. Proceedings o f the Australian Physiological and Pharmacological Society 19, 57P
CAIRNS, S. P. & DULHUNTY, A. F. (1989) Effect of terbutaline on the contractile properties of isolated rat fast- and slow-twitch skeletal muscle. Proceedings o f the Australian Physiological and Pharmacological Society 20(1), 45P
CAIRNS, S. P. & DULHUNTY, A. F. (1989) ß-adrenergic potentiation of peak tetanic force is mediated via excitation-contraction coupling in isolated rat skeletal muscle. Proceedings o f the Australian Physiological and Pharmacological Society 20(2), 163P
CAIRNS, S. P. & DULHUNTY, A. F. (1990) High-frequency fatigue is caused by action potential failure in isolated rat skeletal muscle. Proceedings o f the Australian Physiological and Pharmacological Society 21(2), 157P
CHAPTER 1
GENERAL INTRODUCTION
1
1.1 INTRODUCTION
The regulation of force production by contracting skeletal muscle is of prime
importance for normal function in all species throughout the animal kingdom. Graded dynamic or static contractions are required for activities such as eating, breathing, lifting, locomotion - such as walking or running - or simply to maintain posture, to name a few. Maximal muscle performance is a necessity for the survival of animals in the wild, enabling them to capture prey or to escape from predators. Similarly, for human performance in athletic events, such as sprinting, it is important that the working muscles can generate a high maximum power output (i.e. product of the force produced and the shortening speed) and can also maintain this power output for as long as
possible, i.e. minimize the development of fatigue.
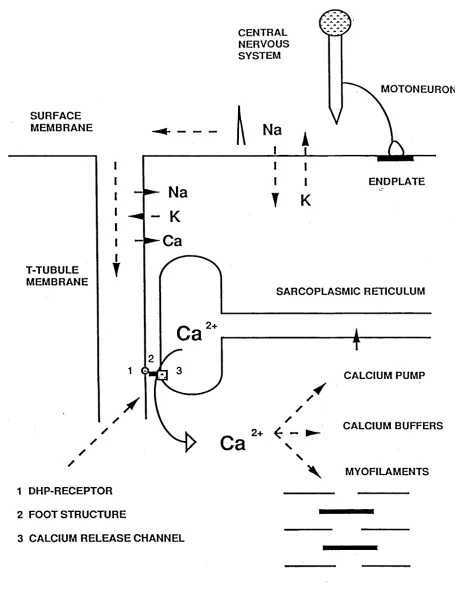
The basic framework for the chain of events involved in the voluntary activation of contraction is well established (Figure 1.1). Action potentials, initiated in the motor cortex of the brain, are propagated along descending motor pathways in the spinal cord and then via peripheral motor nerves to the musculature. When an action potential invades and depolarizes a motoneuron terminal, the process of neuromuscular transmission is initiated and culminates in the release of acetylcholine to activate specific receptors in the endplate region of the sarcolemma. The subsequent local depolarization, i.e. endplate potential, spreads passively to the adjacent surface
membrane to initiate an action potential. Muscle action potentials are propagated across the sarcolemma in all directions away from the centrally located neuromuscular
junction, and then radially into the depths of the fibre along narrow invaginated tubular extensions of the surface membrane, known as the transverse (T-) tubular system. Then, in the process known as excitation-contraction coupling (E-C coupling), depolarization of the T-tubule membrane somehow triggers the release of calcium ions (Ca2+) from the adjacent terminal cistemae of the sarcoplasmic reticulum (SR); the SR being a system of internal membraneous sacs which surround the myofibrils and release, sequester and store Ca2+. The processes involved in signal transmission between the membranes of the T-tubule and the SR, and which control Ca2+ efflux through
SURFACE MEMBRANE
T-TUBULE MEMBRANE
CENTRAL NERVOUS SYSTEM
MOTONEURON
ENDPLATE
SARCOPLASMIC RETICULUM
CALCIUM PUMP
CALCIUM BUFFERS
\ MYOFILAMENTS
1 DHP-RECEPTOR 2 FOOT STRUCTURE
3 CALCIUM RELEASE CHANNEL
[image:15.556.58.513.52.649.2]2
Relaxation occurs following termination of action potential activation, when [Ca^+]j falls towards resting levels due to deactivation of Ca2+ release and the continued removal of Ca2+ from the myoplasm. Ca2+ is removed by an ATP dependent SR Ca2+-pump (i.e. the Ca2+-ATPase), which transports Ca2+ into the lumen of the SR, and possibly by myoplasmic Ca2+ binding proteins, such as parvalbumin, which act in parallel with the Ca2+-pump. As myoplasmic [Ca2+] is reduced, Ca2+ dissociates from troponin-C, restoring the inhibitory influence of tropomyosin, and crossbridge cycling stops.
In this thesis two factors involved in the regulation of isometric muscle performance are examined: (i) the ability of a class of hormones, called catecholamines, to increase muscle force and to modulate the rate of relaxation and (ii) the effect of prolonged stimulation to reduce force production, i.e. fatigue. The development and modification of techniques involved with electron microscopy, patch and voltage clamping,
mciecular biology and biochemical methods, intracellular ion indicators,
pharmacological tools, and skinned fibre studies have led to an increased, but as yet incomplete, understanding of the cellular mechanisms of muscle contraction. This introduction reviews studies on contractile activation and the regulation of muscle force in accordance with the theme of this thesis. Since the present study was performed on mammalian skeletal muscle fibres I have referred to research on mammalian
preparations where possible. However, as less data are available from mammalian muscle compared to a wealth of information from elegant experiments on amphibian twitch fibres, the latter are discussed also.
1.2 CELLULAR MECHANISMS OF CONTRACTILE ACTIVATION
This section describes some of the processes involved in the activation of contraction, i.e. the action potential and E-C coupling. For further information the reader is referred to a number of excellent reviews (Stephenson 1981; Caputo 1983; Caille et al. 1985; Lüttgau & Stephenson 1986; Dulhunty 1988; Rios & Pizarrö 1988; Caswell & Brandt
1989; Fleischer & Inui 1989). For reviews on the thin filament regulation of force see El-Saleh et al. (1986), Walsh (1987) and Zot and Potter (1987), and for crossbridge function see Squire (1983) and Huxley and Kress (1985).
(a) The muscle action potential
Excitation of the sarcolemma involves the initiation and propagation of action potentials along the surface and T-system membranes. The configuration of the intracellularly recorded muscle action potential is similar to that for the nerve axon (Nastuk & Hodgkin 1950; Gage & Eisenberg 1969; MCArdle et al. 1980). Radio-isotope studies
3 potassium ions (K+), during the action potential in muscle (Hodgkin & Horowicz 1959a). Voltage clamp experiments have revealed a fast inward current through
depolarization-activated channels which has been identified as a Na+ current since it is reduced by lowering extracellular [Na+], has a reversal potential similar to the sodium equilibrium potential, and is antagonized by tetrodotoxin (TTX), a toxin which blocks the Na+ channel (Adrian et al. 1970; Duval & Leoty 1978; Pappone 1980; Stefani & Chiarandini 1982). Similarly, the overshoot of the action potential approaches the sodium equilibrium potential and depends on the extracellular [Na+] (Nastuk &
Hodgkin 1950; MCArdle et al. 1980) suggesting that a Na+ current is responsible for the upstroke of the action potential (Nastuk & Hodgkin 1950; Adrian et al. 1970; Stefani & Chiarandini 1982; Lüttgau & Stephenson 1986). The repolarization of the action potential is thought to involve at least two mechanisms. Firstly, the Na+ current is transient and is "turned o f f by the fast inactivation of Na+ channels during membrane depolarization (Adrian et al. 1970; Duval & Leoty 1978; Pappone 1980; Ruff et al.
1988). Secondly, a late outward K+ current through delayed rectifier K+ channels also contributes to membrane repolarization (Adrian et al. 1970; Duval & Leoty 1978; Pappone 1980). Notably, tetraethylammonium ions (TEA) which block the delayed outwards current (Pappone 1980; Stefani & Chiarandini 1982) also slow the
repolarization of the action potential (Delbono & Kotsias 1987).
Transmission of surface membrane excitation into the interior of the fibre is less well understood. The requirement of an intact T-system is essential for this process and contraction, as shown in the classical experiments of Gage and Eisenberg (1969). They demonstrated that, following disconnection of T-tubules from the surface membrane by glycerol treatment, the fibres could conduct surface action potentials of normal
amplitude but failed to contract. Transmission of the surface action potential along the T-tubular membrane is thought to be mainly due to the active propagation of action potentials rather than by the passive spread of depolarization (Adrian et al. 1969; Costantin 1970; Gonzalez-Serratos 1971; Bezanilla et al. 1972; Bastian & Nakajima
1974). Indeed, T-tubular action potentials have now been recorded optically with voltage sensitive dyes (Nakajima & Gilia 1980; Delay et al. 1986; Heiny et al. 1990). The ionic basis of the T-tubular action potential is thought to be similar to action potentials in the surface membrane. TTX-sensitive Na+ channels and delayed rectifier K+ channels are present in the T-tubule membrane (Jaimovich et al. 1976; Dulhunty
4
suggests that a CL current can contribute to repolarization of the T-tubular action potential (Heiny et al. 1990). Surprisingly, this result was obtained from amphibian muscle which is thought not to have a high T-tubular Cl- conductance (Eisenberg & Gage 1969). Also present in the T-tubule membrane are voltage-activated Ca2+ channels (Stefani & Chiarandini 1982; Donaldson & Beam 1983; Borsotto et al. 1984; Flockerzi et al. 1986; Hosey et al. 1986; Lamb & Walsh 1987) and Ca2+-activated K+ channels (Latorre et al. 1982). Currents through these channels are too slow to be involved during a single action potential although they may become important during repetitive activation (Donaldson & Beam 1983; Fink et al. 1983; Lüttgau & Wetter
1983; Avila-Sakar et al. 1986; Lamb & Walsh 1987).
Although only a small number of ions move across the sarcolemma during a single action potential (Hodgkin & Horowics 1959a; Adrian & Peachley 1973; Clausen & Everts 1988), the change in trans-sarcolemmal ion concentrations may become large during prolonged activation (Bezanilla et al. 1972; Juel 1986; Clausen & Everts 1988). Sarcolemmal sodium-potassium (Na-K) pump proteins are thought to be responsible for maintaining the normal trans-sarcolemmal ion gradients (Clausen 1986; Sejersted 1988; Clausen & Everts 1989). The Na-K pump is a ouabain-sensitive Na+-K+-ATPase, an enzyme which utilizes ATP to translocate 3 Na+ out of the fibre for 2 K+ into the fibre (Clausen 1986). It is located in the surface and T-tubule membranes, although the density is less in the T-system (Venosa & Horowicz 1981; Clausen 1986; Sabbadini & Dahms 1989). This enzyme is activated by stimulation-induced increases in the
extracellular [K+] or intracellular [Na+], the latter being the most important (Sejersted 1988; Clausen & Everts 1989).
(b) Excitation-Contraction Coupling
It is widely accepted that contraction is caused by an increase in the myoplasmic [Ca2+] (Caputo 1983; Lüttgau & Stephenson 1986; Stephenson 1988; Fleischer & Inui 1989). This is clearly demonstrated by the direct application of Ca2+ to the myofilaments in skinned fibre preparations whereby force is produced (Ashley & Moisescu 1977; Donaldson et al. 1978; Stephenson & Williams 1981; Godt & Nosek 1989). In the skinned preparation the sarcolemma is removed or disrupted either by mechanical peeling or chemical treatment, allowing the control of the ionic environment
surrounding the SR and myofilaments. Furthermore, the activation of contraction in intact fibres by action potentials, depolarization by voltage clamp or high [K+]
5 1983; Cannell & Allen 1984; Allen & Westerblad 1990). Moreover, electron
microprobe studies indicate that most, if not all, of the increase in [Ca2+]i is due to Ca2+ released from the SR (Somlyo et al. 1981).
Voltage-activation o f contraction
Hodgkin and Horowicz (1960), in their well known experiments, demonstrated that rapid application of high [K+] solutions produced an increase in force (K-contracture) in single intact amphibian twitch fibres. These K-contractures increased in amplitude with the [K+], and hence the extent of membrane depolarization (Hodgkin & Horowicz
1959b). These results suggested that force production does not depend on the action potential per se, but on membrane depolarization. Similarly, K-contractures can be induced in small bundles of fibres from mammalian muscles (Dulhunty 1980; Anwyl et al. 1984; Gallant & Donaldson 1989), although equilibration in low [C1-] solutions is required to produce large K-contractures (Dulhunty & Gage 1983, 1985; Chua & Dulhunty 1988). Force production can also be evoked by voltage-clamp depolarization in amphibian fibres (Caputo & De Bolanos 1979; Caputo et al. 1981; Ildefonse et al.
1985), or by depolarization of T-tubular membranes in skinned fibres induced by ionic substitution (Donaldson 1985; Donaldson et al. 1989; Lamb & Stephenson 1990a). Any study of contractile activation should, therefore, account for the normal voltage-
dependent mechanism of E-C coupling.
The possibility that the SR is electrically coupled to the T-tubule membrane and that direct depolarization of SR membrane triggers Ca2+ release (Mathias et al. 1980) is unlikely as the SR does not appear to have a membrane potential (Somlyo et al. 1981; Oetliker 1982) and the membrane capacitance is too low to account for the much greater area of the SR membrane (Dulhunty 1988). Another hypothesis is that during
membrane depolarization a T-tubular Na+ current triggers contraction, i.e. Na+-induced Ca2+ release (Potreau & Raymond 1982; Caille et al. 1985). However, removal of external Na+ or addition of TTX did not reduce the amplitude of Ca2+ transients evoked by voltage clamp depolarization (Miledi et al. 1984), and the amplitude of K-contractures were not influenced by TTX (Dulhunty & Gage 1985). These results suggest that a Na+ current through TTX-sensitive Na+ channels is not directly involved in triggering Ca2+ release. Therefore, it has been postulated that "voltage sensitive molecules" in the T-tubule membrane are responsible for the transduction of membrane depolarization into Ca2+ release from the SR (Schneider & Chandler 1973; Caputo
6
Asymmetrie charge movement
In 1973, Schneider and Chandler depolarized frog fibres by the voltage clamp technique and, after elimination of ionic and linear capacitive currents, discovered a small voltage displacement which is now called asymetric charge movement. This charge movement was thought to represent the activity of a putative voltage sensor which is required to trigger Ca2+ release from the SR. In support of this hypothesis, charge movement is mainly generated in the T-system and is activated over the same membrane potential range as it is required for contraction (Schneider & Chandler 1973; Chandler et al.
1976a, 1976b; Gage & Dulhunty 1983, 1985; Rakowski et al. 1985; Lamb 1986). Moreover, changes in the amount of charge moved correlate well with Ca2+ release under a variety of experimental conditions (Koväcs et al. 1979; Rakowski et al. 1985; Melzer et al. 1986; Rios & Brum 1987; Brum et al. 1988a, 1988b). However, there is still doubt about the involvement of some components of charge movement in Ca2+ release (Lamb 1986; Melzer et al. 1986; Lamb & Walsh 1987; Huang 1988).
Dihydropyridines (DHP), such as nifedipine, which are antagonists of the
voltage-activated Ca2+ channel of the sarcolemma, block a component of charge movement (Lamb 1986; Lamb & Walsh 1987; Rios & Brum 1987) as well as "slow" Ca2+ currents (Ildefonse et al. 1985; Lamb & Walsh 1987; Rios & Brum 1987). A close relation between the effects of nifedipine on slow Ca2+ currents and charge movement motivated Lamb and Walsh (1987) to propose that the nifedipine sensitive component of charge movement was a gating current for a T-tubular Ca2+ channel. Later in the same year, Rios and Brum observed a close correlation between the effects of nifedipine on Ca2+ release and charge movement and they proposed that the DHP-receptor was identical to the putative voltage sensor of E-C coupling. The importance of the DHP-receptor for E-C coupling has recently been shown in the elegant experiments of Tanabe et al. (1988). They demonstrated that microinjection of an expression plasmid, containing the complementary DNA encoding the
DHP-receptor, into muscle cells from mice with muscular dysgenesis restored both contraction and slow Ca2+ currents. Thus, the DHP-receptor is essential for E-C coupling.
T-tubule - SR communication
7
(i) Mechanical model:
Chandler and coworkers proposed a relatively simple model in which charge movement initiated a conformational change in a long molecule which transversed the junctional gap and subsequently unplugged a channel in the terminal cistemae to allow Ca2+ efflux into the myoplasm (Schneider & Chandler 1973; Chandler et al. 1976b). This model has recently become more compelling following electron microscopy and biochemical studies (Caswell & Brandt 1989; Brandt et al. 1990).
Structures in the junctional gap between the T-tubular and terminal cistemae
membranes - a distance of about 15 nm (Franzini-Arm strong 1970; Fleischer & Inui 1989) - which might be important in E-C coupling have been revealed by electron microscopy (Franzini-Armstrong 1970; Somlyo 1979; Eisenberg & Eisenberg 1982; Dulhunty 1988, 1989; Brandt et al. 1990). Franzini-Armstrong (1970) described
structures designated as "feet" and other workers observed "bridges" (Somlyo 1979) and "pillars" (Eisenberg & Eisenberg 1982), although these latter structures may also be pan of the foot structure (Dulhunty 1988). The importance of the junctional foot structure in E-C coupling has recently been confirmed by three experimental observations, (i) The alkaloid, ryanodine, has been shown to bind specifically to the Ca2+ release channel of the terminal cistemae (Fleischer et al. 1985). (ii) The isolated and purified ryanodine receptor has a morphology identical to the foot structure (Inui et al. 1987; Lai et al.
1988). (iii) The purified ryanodine receptor can function as a Ca2+ channel when reincorporated into lipid bilayers (Hymel et al. 1987; Imagawa et al. 1987; Lai et al.
1988) , with properties similar to those for the Ca2+ release channel of SR membranes (Smith et al. 1985, 1986). Thus, it has been suggested that the ryanodine receptor, the SR Ca2+ release channel and the junctional foot protein are all parts of the same structure (Caswell & Brandt 1989: Fleischer & Inui 1989).
The foot structures are aligned with the DHP-receptor in the junctional gap (Dulhunty 1989) . However, the molecular interaction between the DHP-receptor and junctional foot protein does not appear to be direct but via a glycolytic enzyme (Brandt et al.
1990) . Thus the machinery for a mechanical coupling mechanism seems to be available, although signal transmission via the foot protein is not necessarily mechanical
(Dulhunty 1989; Ikemoto et al. 1989; Lamb & Stephenson 1990c).
(ii) Calcium-induced calcium release:
8
et al. 1985, 1986; Lai et al. 1988; Rousseau et al. 1988). The hypothesis that a
trans-sarcolemmal Ca2+ influx occurs during membrane depolarization triggering Ca2+ release from the SR (Meissner et al. 1986) has recently become more attractive since the putative voltage sensor might also be a modified Ca2+ channel (Rios & Brum 1987; Tanabe et al. 1988). However, there are several lines of evidence against such a
mechanism in skeletal muscle, (i) Slow Ca2+ currents, recorded in the T-tubular membrane, are too slow to initiate twitches (Donaldson & Beam 1983; Lamb 1986; Lamb & Walsh 1987). (ii) There is no obvious relation between the amplitude of the Ca2+ current and the Ca2+ transient evoked by voltage clamp depolarization in frog fibres (Brum et al. 1987). (iii) Contraction still occurs in low extracellular [Ca2+] (Armstrong et al. 1972; Blinks et al. 1978; Dulhunty & Gage 1988), although Ca2+ transients may be slightly reduced (Blinks et al. 1978; Miledi et al. 1984). It is important to note, however, that the voltage sensors require at least some Ca2+ to function normally (Brum et al. 1988a, 1988b; Dulhunty & Gage 1988).
Therefore, a Ca2+ influx is unlikely to be involved in the normal voltage-dependent activation of E-C coupling, but this does not eliminate the possibility that a
Ca2-r-induced Ca2+ release mechanism might contribute to the total Ca2+ released. Indeed, the pharmacological blockade of Ca2+-induced Ca2+ release by procaine or ruthenium red eliminates a component of voltage-activated Ca2+ release in skinned fibres (Donaldson 1985; Donaldson et al. 1989; Lamb & Stephenson 1990b). It has been proposed that Ca2+ might activate Ca2+ release in parallel with the voltage-dependent mechanism (Rios & Pizzaro 1988) or further activate Ca2+ channels opened by
voltage-activation (Lamb & Stephenson 1990b).
(iii) inositol trisphosphate-induced calcium release:
It has been proposed that depolarization of T-system membrane stimulates the
production of inositol 1,4,5-trisposphate (IP3) which then diffuses across the junctional gap to cause Ca2+ release from the SR (Vergara et al. 1985; Volpe et al. 1985;
9
et al. 1987). Nevertheless, the machinery is available for an effect of IP3 on Ca^+ release (Surez-Isla 1988; Brandt et al. 1990) so that this chemical messenger may have a modulatory influence.
In summary, it appears that DHP-receptors in the T-tubule membrane act as the "voltage sensors" for E-C coupling. The DHP-receptors somehow convert membrane depolarization into Ca2+ release from the SR, possibly by activating Ca2+ release channels in the terminal cistemae membrane via the foot structures. However, the exact mechanism by which this occurs is at present unclear. Calcium- and IP3-induced Ca2+ release may have additional or modulatory effects on Ca2+ release.
1.3 REGULATION OF MUSCLE FORCE
The force developed by a whole muscle can be graded by controlling the number of fibres that are simultaneously contracting and the force developed by each individual fibre. In the first case, force can be regulated by varying the type and number of motor units activated in parallel, a process known as recruitment (Burke & Edgerton 1975; Buchthal & Schmalbruch 1980; Burke 1990; Kemell 1990). This discussion is
concerned with the second mechanism, namely the regulation of force development at the cellular level. Three important relationships are discussed.
(a) The force-[Ca2+] relationship
The steady state relation between isometric force and [Ca2+] is well documented for skinned fibres (Ashley & Moisescu 1977; Donaldson et al. 1978; Stephenson & Williams 1981; Fuchs & Fox 1982; Cooke et al. 1988; Godt & Nosek 1989), and has also recently been described for intact fibres (Allen et al. 1989; Allen & Westerblad 1990). Application of Ca2+ from a resting concentration of 10 nM up to a maximal concentration of 30 pM, in Ca^+ buffered solutions, causes force production in skinned fibres (Stephenson & Williams 1981; Wendt & Stephenson 1983). This relation is usually presented as a semilogarithmical plot, between the steady state force and the pCa of the bathing solution (pCa = -logio[Ca2+]). The force-pCa curve is typically sigmoidal, indicating that a threshold [Ca2+] is required to initiate contraction and that force reaches a plateau at high [Ca2+] (Lüttgau & Stephenson 1986). At intermediate Ca2+ concentrations force is graded and is related to the amount of Ca2+ bound to troponin-C (Fuchs & Fox 1982).
1 0
maximal rate of crossbridge cycling or force produced per crossbridge. This force level is modified by factors such as temperature (Stephenson & Williams 1981) and
metabolites (Donaldson et al. 1978; Cooke et al. 1988; Godt & Nosek 1989).
Force production at submaximal Ca2+ concentrations can be regulated, in principle, by two main mechanisms. Firstly, changing the myoplasmic [Ca2+], due to processes that alter SR Ca2+ release or Ca2+ removal, would change force as represented by a shift along the force-pCa curve. Secondly, the slope of the force-pCa curve or its position relative to the [Ca2+] axis may be altered. For instance, increasing the affinity of troponin-C for Ca2+, so that more Ca2+ binds to troponin-C at each submaximal [Ca2+], would result in a shift of the entire force-pCa curve towards lower [Ca2+], i.e. an increase in the Ca2+ sensitivity of the myofilaments. The converse would also be true for a reduction in the Ca2+ affinity of troponin-C. Such changes in Ca2+ sensitivity have been shown for a number of metabolites (Ashley & Moisescu 1977; Donaldson et al. 1978; Cooke et al. 1988; Godt & Nosek 1989) and drugs (Wendt & Stephenson
1983; Walsh 1987). The position of the force-pCa curve is also shifted towards lower [Ca2+] when submaximal crossbridge activity is increased following myosin light chain phosphorylation in last-twitch muscles (Walsh 1987; Metzger et al. 1989).
(b) The force-membrane potential relationship
Flodgkin and Horowicz (1960) were the first experimenters to quantify the steady state relation between isometric force production and membrane potential from their
K-contracture experiments in single frog twitch fibres. Force production started at 20-25 mM K+ and thereafter was related to the logarithim of the external [K+], or membrane potential, by a steep S-shaped curve that gave a maximal force output at about 100 mM K+. A similar relation is observed between force and membrane potential in voltage clamp experiments in frog fibres (Caputo & De Bolahos 1979; Caputo et al. 1981), and between force and [K+] in mammalian fibres - well described by a Boltzmann curve (Dulhunty 1980; Dulhunty & Gage 1983, 1985). The force-membrane potential relation shows that: (i) there is a voltage threshold for contraction; (ii) force is graded over a range of membrane potentials; and (iii) force reaches a maximum plateau level, i.e. maximum voltage-activated force.
11
similarly described by a sigmoidal curve and a Boltzmann function (Chandler et al. 1976a, 1976b; Dulhunty & Gage 1983, 1985; Lamb 1986; Melzer et al. 1986). When charge movement and [Ca2+]j were recorded simultaneously over a range of membrane potentials, it was found that the amount of charge moved and the peak rate of Ca2+ release were tightly coupled, although some charge had moved prior to the first detection of Ca2+ release (Koväcs et al. 1979; Rakowski et al. 1985; Melzer et al.
1986). Force could not be measured simultaneously, but it would appear that the coupling between membrane potential and charge movement resulting in Ca2+ release from the SR, is an important determinant of the force-membrane potential relation.
However, the above relation is not rigid since low concentrations of the drug caffeine cause the force-membrane potential curve to be shifted towards lower membrane potentials, i.e. to the left (Sandow et al. 1964; Caputo et al. 1981). When [Ca2+]j was measured in the presence of caffeine at various membrane potentials, it became apparent that caffeine increased the rate of Ca2+ release with both submaximal and maximal depolarizations (Delay et al. 1986; Klein et al. 1990). This result has important implications on the regulation of Ca2+ release since caffeine does not affect either charge movement nor membrane potential (Koväcs & Szucs 1983; Delay et al. 1986; Klein et al. 1990). Firstly, Ca2+ release can be regulated by a mechanism in addition to the normal voltage-dependent activation of E-C coupling during both submaximal and maximal depolarizations. Secondly, maximal voltage activation of E-C coupling does not produce maximal Ca2+ release from the SR. Thirdly, since caffeine does not affect maximum voltage-activated force in frog fibres (Sandow et al. 1964; Caputo et al.
1981) but increases the maximum [Ca2+]i, it appears that the myofilaments were saturated with Ca2+.
A second important feature of the force-membrane potential relation is that a
spontaneous decline of force occurs during prolonged depolarization, induced by either high [K+] solutions or voltage clamp (Hodgkin & Horowicz 1960; Lüttgau 1963; Caputo 1976; Caputo & De Bolanas 1979; Dulhunty & Gage 1983, 1985; Chua & Dulhunty 1988). This phenomenon, called mechanical inactivation, is dependent on the magnitude and duration of the maintained depolarization (Hodgkin & Horowicz 1960; Caputo & De Bolanos 1979; Chua & Dulhunty 1988). It is not due to a failure of the myofilaments (Axelsson & Thesleff 1958; Ludin et al. 1966; Lüttgau & Oetliker 1968) and is associated with a reduction in the Ca2+ transient (Blinks et al. 1978; Allen et al. 1989). Thus it seems to be a feature of E-C coupling. A popular theory is that
12
depolarization (Chandler et al. 1976b; Rakowski 1981). The possible involvement of other processes in E-C coupling, however, has not been eliminated.
(c) The force-frequency relationship
Muscle fibres are normally activated by trains of action potentials rather than by continuous depolarization (Grimby et al. 1981; Hennig & Lomo 1985, 1987). Neural regulation of force production is thought to involve control of the number, frequency, and pattern of action potentials delivered to the muscle; a process known as rate modulation (Burke & Edgerton 1975; Burke 1990). Certainly, the peak force response to a single stimulus, i.e. a twitch, is less than in a tetanus which is induced by trains of action potentials. The tetanus-to-twitch ratio, however, does vary from about 2 to 15 depending on the species and fibre-type (Lännergren & Smith 1966; Blinks et al. 1978; Dulhunty & Dlutowski 1979; Luff 1985). When force is expressed as a function of stimulation frequency, there was initially no change in force above twitch height until about 5-10 Hz when twitches start to fuse and then force rises steeply to a plateau at 50-200 Hz (Truong et al. 1964; Blinks et al. 1978; Edwards 1981; Hennig & Lomo
1987; Allen & Westerblad 1990). The stimulation frequency required to produce maximum tetanic force is very much dependent on fibre-type and temperature (Truong et al. 1964; Hennig & Lomo 1985, 1987). Notably, the recording of action potential activation in vivo indicates that maximum force is generated at much lower frequencies than in vitro and that the stimulation pattern is more complex than constant frequency trains (Grimby et al. 1981; Hennig & Lomo 1985, 1987).
Measurement of myoplasmic [Ca2+] during action potential stimulation reveals that the amplitude of Ca2+ transients increase with frequency, being two to three times greater for a fused tetanus than for a twitch (Blinks et al. 1978; Miledi et al. 1982; Baylor et al.
1983; Canned & Allen 1984; Allen & Westerblad 1990). It should be noted, however, that twitch [Ca2+] is unlikely to be in a steady state, and the Ca2+ transient represents only a small proportion of the total Ca2+ released (Canned & Aden 1984) so that twitch and tetanic [Ca2+] cannot be compared by relation to the force-pCa curve. It is likely that the greater force developed during tetani than twitches reflects a larger amount of Ca2+ bound to troponin-C. The control of Ca2+ release by membrane potential and charge movement during tetanic stimulation is unknown and is an important area for further investigation.
13
ultimate force production depends on the amount of Ca^+ bound to troponin-C and the precise location on the force-pCa curve.
1.4 AIMS OF THE EXPERIMENTS
As already mentioned, the main objectives of this thesis were to investigate (i) the hormonal regulation of isometric contractions, namely the effect of catecholamines on force and relaxation, and (ii) the effect of fatiguing stimulation on force production. Throughout this thesis differences due to either fibre-type or modifications due to inactivity - following removal of the nerve supply (denervation) - were examined.
Chapter 3, is concerned with the ability of catecholamines to regulate force production and the rate of relaxation of twitches and tetani in non-fatigued preparations. These effects were quantified and the pharmacology behind these responses was examined, i.e. the receptors involved, concentration-response relations, the second messenger/s
involved.
The main question in Chapter 4 is "What is the cellular mechanism for the
ß-adrenoceptor mediated potentiation of force?" The roles of various cellular processes associated with the action potential, myofilaments and E-C coupling were examined. The effects of terbutaline were compared with those of caffeine.
Chapter 5 deals with the reduction of force caused by prolonged continuous tetanic stimulation. The cellular mechanisms responsible for this "high-frequency fatigue" were examined with special emphasis on the action potential and changes in the
trans-sarcolemmal ionic distribution. Effects on relaxation and differences due to fibre-type and denervation were investigated.
In Chapter 6 the ability of catecholamines to regulate force production during
1 4
CHAPTER 2
GENERAL METHODS
All experimental protocols presented in this thesis were approved by the Animal Experimentation Ethics Committee of the Australian National University.
2.1 MUSCLE PREPARATIONS
Adult (4-10 months) male white Wistar rats (Rattus norvegicus) weighing 250-550 g were used in all experiments. The skeletal muscles chosen for study were the soleus, a slow-twitch hindlimb muscle and the stemomastoid, a fast-twitch superficial neck muscle. The stemomastoid was dissected into the visibly distinguishable white and red muscle segments. These muscles were chosen because (i) they can be used as models for different mammalian fibre-types and (ii) abundant data is available on them to assist the present study. Different methods of assaying for fibre-type show that the rat muscles used have the following composition: soleus (84-96% type I; 4-16% type Ila; Ariano et al. 1973; Edström et al. 1982), red-stemomastoid segment (55-76% type ila; 13-21% type lib; 11-21% type I; Dulhunty & Dlutowski 1979; Luff 1985) and the
white-stemomastoid segment (82-92% type lib; 8-18% type Ila; Dulhunty & Dlutowski 1979; Luff 1985).
Animals were killed by suffocation in either halothane or carbon dioxide gas. Rat body weight was measured prior to dissection. The gross muscle dissections were as follows: (i) Soleus muscle: The rat was pinned in a prone position to a cork dissecting board. Skin and hair overlying the posterior surface of a hindlimb were removed using surgical scissors. The Archilles tendon was severed close to the heel bone where it inserted. This tendon was held with forceps and the connective tissue on medial and lateral aspects of the lower hindlimb was transected up to the knee, thereby exposing the deep surface of the soleus. The proximal tendon was severed and the intact muscle freed from
surrounding tissues.
(ii) Stemomastoid muscle: The rat was pinned in a supine position and the skin and submandibular glands overlying each stemomastoid muscle were removed while ensuring not to damage the nearby arteries. The tendon on the mastoid process was cut close to its insertion and the muscle was freed from the connective tissue attached along its length up to the sternum. This procedure was repeated for the contralateral
15
Once excised, the intact muscles were pinned by their tendons, at approximately resting length, into a Petri dish lined with Sylgard (Dow Coming). Muscles were usually bathed in a modified Krebs solution (Solution 1, Table 2.1) at room temperature (18-22°C).
Preparations for contraction studies
Thefce preparations were small bundles of 5-50 intact fibres. Fine dissection of each fibre bundle was performed under a low powered stereomicroscope (Wild Heerbrugh,
12-50 X magnification), with the muscle illuminated from below (Wild - light source). Bundles of fibres were obtained by tendon-to-tendon dissection using fine tipped forceps and microsurgical scissors (Carl Teufel, D-7201). Sufficient tendon was left attached to the fibres (> 7-8 mm) to enable the preparation to be mounted in the muscle bath without damage. Pathways for cutting the connective tissue around groups of fibres were readily identifiable whereas this was not so for single fibres. This factor and the length of these fibres (up to 35 mm) meant that isolation of single intact fibres, at least from these muscles, proved unsuccessful. Preparations with broken fibres were rejected although small fragments of cut fibres sometimes remained attached at the tendons; these fragments had no noticable effect on the performance of the remaining fibres. Each preparation had at least one diameter of less than 500 pm. The small
cross-sectional dimensions of these preparations was thought to be adequate to prevent the major diffusion limitations of isolated whole muscles (Goldberg et al. 1975).
Preparations for membrane potential studies
These studies were performed on single fibres located on the surface of thin sheets of fibres, intact whole muscles or muscle segments. The surrounding connective tissue was carefully removed to assist with a clean microelectrode penetration of fibres. Thin sheets of fibres were obtained by dissecting away layers of fibres on one side of the preparation to reduce the chance of fibre damage on the other side of the preparation.
Denervation Procedure
TABLE 2.1: Composition of bathing solutions. Ion
concentrations are in mM
SOLUTION N a+ K + C a2+ c i- S 0 4 2 - Sucrose
Solution 1 80.5 3.5 7.6 16 42.6 170
Solution 2 196.5 3.5 7.6 16 100.6
-10K 190 10 7.6 16 100.6 . . .
60K 140 60 7.6 16 100.6 . . .
200K — - 200 7.3 16 100.3
-Normal Krebs Solution
150 3.5 2.5 159.5 — —
16
was located just distal to the sciatic notch. Closed scissors were inserted between the surrounding musculature and opened thereby exposing the sciatic nerve. Using forceps and scissors, a 4-5 mm section of nerve was removed. A violent twitch of the hindlimb was usually observed at this time indicating a successful nerve section. The skin incision was sutured and the animal allowed to recover.
Soleus muscles were used from animals that had been denervated and maintained for 2-14 weeks. The rat usually carried its left hindlimb in a retracted position following denervation. Otherwise it appeared normal. Successful denervations were confirmed by: (i) the presence of fibrillations in the low chloride solutions; (ii) whole muscle atrophy and (iii) a lower than normal tetanus-to-twitch ratio (Table 2.3). Only two out of about ninety animals failed to meet these criteria.
2.2 SOLUTIONS AND DRUGS
In most experiments, preparations were bathed in a modified low [Cl-] Krebs solution (Solution 1, Table 2.1). The main reasons that Solution 1 was used were that (i) force run-down (see Chapter 2.4) occurred more slowly in this solution than in normal Krebs solution - especially with stemomastoid preparations and (ii) a low extracellular [Cl-] is required to produce large potassium contractures in mammalian fibres (Dulhunty & Gage 1985). Since at least one hour was required for the preparations to equilibrate (stable tetanic force) in the low [Cl-] solutions (Dulhunty & Gage 1985; present study) the fine dissection and all isometric contraction measurements were usually made in the low [Cl-] Solution 1.
In Solution 1, the impermeable sulphate ion was used as a substitute for Cl". Because the sulphate ion is a divalent ion, a lower than normal [Na+] was used so that the ionic strength was similar to that of normal Krebs solution. Sucrose was added to maintain the osmolarity of Solution 1 at about 330 mosmol. TES (A-tris-(hydroxymethyl)- methyl-2-amino-ethanesulphonic acid) was used as the pH buffer. pH was set to 7.4 ± 0.1 pH units by adjustment with sodium hydroxide (measured with a T.P.S. digital pH meter). In most studies the solutions were bubbled with 100% oxygen gas (Med Grade, CIG). The absence or presence of 100% 0 2 did not modify the contractile properties of these preparations.
17
& Gage 1985). The larger K-contractures produced in low rather than high [Cl'] solutions are thought to be due to a relatively bigger tubular length constant in low Cl* solutions (Dulhunty et al. 1984). Hence, this condition would allow a more rapid and synchronous passive spread of depolarization along the T-tubule membrane resulting in a larger K-contracture (Dulhunty & Gage 1985).
The use of Solution 1 does have some limitations. The lower [Na+], relative to that in the normal Krebs solution (Table 2.1), although not influencing peak twitch force, does depress peak tetanic force slightly (see Chapter 5.3d(i)). Hence, it was necessary to use the normal Krebs solution in some experiments (see Chapters 3.3c, 5.4b(iii)). It should be noted that by using the normal [Na+], but at a higher ionic strength than in Solution 1, there results a faster run-down of force in these preparations (Dulhunty pers. comm.).
2.3 FORCE RECORDING AND STIMULATION
A small volume (1.4 ml) Perspex muscle bath was used. The maximum rate of solution flow through the bath was (2 ml/s) giving a solution change over time of 700 ms. Solutions entered the bath via an inlet at one end and were removed at the opposite end of the bath by a motor driven suction pump (Charles Austen Pumps Ltd., model
DYMAX MF1). Platinum plate electrodes (40 mm long) were mounted parallel on each side of the bath and separated by 4 mm. These electrodes were designed to extend beyond the entire length of the relatively long stemomastoid fibres as well as the shorter soleus fibres. The muscle bath was mounted on to a temperature controlled water jacket. Water temperature was thermostatically controlled by a Peltier element (thermomix
1420). Solutions were passed through small coiled tubing located in the water jacket and applied to the muscle bath through the solution inlet. A thermistor, calibrated immediately prior to each experiment, was placed close to the preparation, next to the solution outlet.
The muscle bath and thermal water jacket were mounted on to an air table (Vibraplane Kinetic system, model 1201-01-12, Boston) and surrounded by a Faraday cage, to reduce electrical noise. Spring-loaded clamping forceps, attached to a
FO RCE
TRANSDUCER RECORDERCHART O SCILLO SCO PE
DATA COLLECTION Preparation
AMPLIFIER
STIMULATION A-D CONVERTER
LAB COMPUTER (DIGITAL PDP 11/33) ISOLATED
STIMULATOR
I
ANALYSIS
LONG-TERM STORAGE MAINFRAME COMPUTER (Magnetic T ape) (44/PYRAMID)
i r
ANALYSIS
DATA PRESENTATION
PERSONAL COMPUTER
[image:33.556.58.495.60.651.2]18
Stimulation patterns were initiated from the laboratory computer using software previously developed for this laboratory (by R. Malbon, J.C.S.M.R., A.N.U.). This program was capable of initiating twitches and tetani at different stimulation frequencies, durations and delays. The pattern of stimulation was transmitted to the platinum electrodes via an isolated Grass stimulator (Type 2533) which was used to set the voltage pulse parameters. The general features involved with stimulation and the recording of force are shown in Figure 2.1.
2.4 EXPERIMENTAL PROTOCOL
Preparations were mounted horizontally to their long axis in the muscle bath, ensuring they were fully immersed in solution and was not contacting the sides of the bath. One tendon was fixed between the clamping forceps and the other tendon attached via a small stainless steel hook to the force transducer. The bathing solution was maintained at 24.0 ± 0.5°C unless otherwise stated. This temperature was chosen in an attempt to minimize the run-down of force seen at higher temperatures (Segal & Faulkner 1985). Isometric contractions were evoked by massive transverse electric field stimulation applied via platinum electrodes. Contraction was thus initiated by a uniform surface membrane action potential. Curare was usually not used. Pulse parameters were
adjusted to ensure supramaximal stimulation for the twitch. Rectangular voltage pulses were set at a duration of 0.5 ms and at 1.1-1.3 X, the amplitude that first produced the maximum twitch force response. The length of the preparation was adjusted to that optimal for twitch force. From a relatively slack length, the fibres were stretched by fine adjustment of a micromanipulator attached to the clamping forceps until there was no further increase in peak twitch force with further stretch. The pulse parameters were checked again before the experiment commenced.
Isometric Contractions
Following equilibration, when stable reproducible twitches and tetani were produced, some basic contractile properties were measured (see Chapter 2.7, Tables 2.2 and 2.3). Fused tetani were induced at a stimulation frequency of 100 Hz in all types of
19
Preparations that displayed a rapid run-down of peak tetanic force, i.e. > 0.5% per min, or large force undershoots following tetani were regarded as being unhealthy and were rejected.
Potassium Contractures
K-contractures were induced by rapidly exposing the preparation to solutions containing high [K+] (60K or 200K, Table 2.1). These solutions were applied by gravitational flow via polystyrene tubing at a maximal rate of 2 ml/s. A high [K+] solution was applied until contracture force had just started to decline from its peak (i.e. at the start of mechanical inactivation). It was then washed out with the control Solution 1. The contracture was not due to the higher ionic strength of 10K, 60K, 200K than Solution 1 since all high [K+] solutions had the same ionic strength and 10K did not produce a contracture. K-contracture amplitude was normalized to peak tetanic force to eliminate variations due to preparation size. Following wash-out of high [K+] solutions, no further contractures were induced until peak tetanic force had recovered to a steady force level close to the pre-contracture force. Normalized K-contracture force was usually reproducible to within 5% for a given preparation. 200K normally produces maximal contractures in normal and denervated soleus fibres (Chua & Dulhunty 1988). In the present study the 200K-contracture amplitude was close to or greater than peak tetanic force. However, it was important that at least one diameter of the preparation was only one or two fibres thick to achieve this ratio.
Drug Administration
Drugs were usually added to solutions just prior to commencement of experiments. Drugs were administered to the fibres by bath application using either (i) gravitational flow as for K-contractures, via the water jacket or directly into the muscle bath, or (ii) glass micropipettes when rapid exposure to drugs was not required.
Concentration-response relations were tested in two ways. Drugs that did not readily wash-out or caused tachyphylaxis (i.e. smaller responses on successive applications) were added cumulatively whereas other drugs were added in a random order.
Run-down
20
with 100% C>2 and a temperature of 24°C were all optimised to reduce force loss due to hypoxia (Goldberg et al. 1975; Segal & Faulkner 1985). The ratio of 200K-contracture force to peak tetanic force stayed much the same during run-down indicating that the action potential is not impaired. Run-down may be related to the use-dependent decline in voltage activated force seen in skinned fibres and attributed to an impairment of E-C coupling in vitro (Lamb & Stephenson 1990a).
2.5 MEMBRANE POTENTIAL STUDIES
Standard glass microelectrodes (tubing from Clark Electromedical Instruments), filled with 2.5 M potassium chloride and with tip resistances of 5-8 MO were used. Muscle preparations were mounted in a Perspex bath lined with Sylgard (Dow Coming), at approximately resting length, in Solution 1 at 22 ± 1°C. Individual surface fibres were impaled only once to avoid depolarization, seen in preliminary experiments, when fibres were impaled several times. Membrane potential was measured using standard procedures, as the potential difference between a microelectrode in a fibre and a reference microelectrode in the bathing solution adjacent to the preparation. The signal from the microelectrode was fed into an amplifier and displayed simultaneously on a digital voltmeter and an oscilloscope (TEKTRONIX S223 digitizing oscilloscope).
Individual fibres were impaled by fine adjustments with a micromanipulator. Only those fibres displaying a sharp increase in membrane potential on microelectrode penetration, a stable membrane potential, and less than a 2 mV potential difference on
microelectrode withdrawal were regarded as viable. Fibres with a resting potential of less than -70 mV were regarded as depolarized and were not used. The stable potential following the initial penetration was recorded and taken to be the membrane potential for that fibre. Impalement of the microelectrode deeper into the fibre usually increased the potential by 5-15 mV. However, this was thought to be due to placement of the microelectrode tip into the myofilament lattice where the ion concentrations are different from that of the myoplasm (Stephenson et al. 1981). Membrane potentials were recorded in different fibres by moving the intracellular microelectrode laterally across the preparation, in small steps, and ensuring that the same fibre was not impaled twice.
2.6 DATA ANALYSIS AND PRESENTATION
2 1
parameters (see Chapter 2.7). Data were acquired as one point every 0.5, 1 or 2 ms when time-course measurements were required and every 10 or 30 ms when only peak force or fatigue measurements were required. Files were transferred to magnetic tapes or cartridges for long term storage. Selected files were transferred to a personal
computer (Fox 2010M, 16BIT) and converted to analogue form. These data files were loaded onto macros, developed using Lotus 123 software, which allowed measurement of some additional contractile parameters. The macro was also used to recreate,
normalize and superimpose force traces for graphical presentation. Final graphs were produced with Sigmaplot software and plotted using a Hewlett Packard plotter or laser printer. Tables and diagrams were produced on a Macintosh computer using MacDraw and Microsoft Word 4.0 software. All wordprocessing was performed using Microsoft Word 4.0. on personal computers.
Drug-induced effects on force were expressed relative to the immediate preceding control force record. Small systematic errors could occur with this measurement due to force run-down. However, a post-wash control was not used to calculate an average control value because it was often difficult to distinguish between drug wash-out and force run-down. To best quantify the effect of a drug on peak force the value for each preparation was taken as that for the first application of the drug. This was to avoid cumulative drug-induced effects or tachyphylaxis. When investigating non
drug-induced effects such as with changes in frequency or solutions, the average response for the preparation was used. Statistical analysis was performed using Lotus
123. Some statistics (analysis of variance with combined paired and unpaired data) was performed by Mr. R. Cunningham, Department of Statistics, A.N.U..
2.7 DEFINITIONS
Contractile properties were measured at the optimal fibre length for the twitch, using supramaximal stimulation (0.5 ms pulse duration, 1.1-1.3 X the pulse strength required to produce maximum peak twitch force) at 24°C, unless stated otherwise in the text. The following definitions and methods of measurement were used:
Force Parameters:
Peak twitch force (TW): The difference in amplitude between the resting force,
recorded at the onset of stimulation, and the peak isometric force resulting from a single stimulus.
Peak tetanic force (TET): The difference in amplitude between the resting force,
A
100 150 200 250 300 350
TIME (m s )
PEAK TETANIC
FORCE (TET)
80-20XRT 20-60SAT
TIME (m s )
FIG. 2 2: Force records showing (A) twitch and (B) tetanic contractions (100 Hz
[image:38.556.86.506.81.669.2]TABLE 2.2: Basic contractile properties in preparations
composed of different fibre-types
C O N T R A C T IL E
PR O PE R T Y
White-Stemomastoid
Red-Stemomastoid
Normal Soleus
Twitch 20-80%AT
(ms)
21.0 ± 3 .0 * (n = 28)
19.5 ± 0.5 * (n = 13)
53 ± 2 (n = 18)
80-20%RT (ms)
43.0 ± 2.5 (n = 39)
58.5 ± 4.5 (n = 16)
157 ± 5 (n = 42)
Tetanus 20-60%AT
(ms)
27.5 ± 2.5 (n = 15)
41.0 ± 5 .0 (n = 14)
84 ± 4 (n = 22)
80-20%RT (ms)
35.0 ± 2.5 (n = 17)
70.0 ± 9.5 (n = 7)
154 ± 7 (n = 33)
TET/TW 8.9 ± 0.8 **
(n = 17)
10.1 ± 0.8 ** (n = 9)
14.1 ± 0.6 (n = 49)
TABLE 2.3: Basic contractile properties in preparations
from normal and denervated soleus muscles
NORMAL DENERVATED SOLEUS
CONTRACTILE SOLEUS
PROPERTY 2W 3W 4W 5-6W 8-9W
Twitch
20-80%AT (ms)
53 ± 2 (n = 18)
30 ± 2 (n = 7)
40 ± 4 (n = 25)
44 ± 4 (n = 20)
26 ± 2 (n = 12)
80-20%RT (ms)
157 ± 5 (n = 42)
147 ± 12 (n = 6)
134 ± 6 (n = 31)
141 ± 7 (n = 17)
123 ± 7 (n = 23)
108 ± 6 (n = 13) Tetanus
20-60%AT (ms)
84 ± 4 (n = 22)
35 ± 3 (n = 6)
40 ± 2 (n = 15)
36 ± 2 (n = 17)
41 ± 4 (n = 8)
57 ± 5 (n = 10)
80-20%RT (ms)
154 ± 7 (n = 33)
101 ± 8 (n = 6)
101 ± 3 (n = 31)
103 ± 4 (n = 16)
99 ± 5 (n = 15)
76 ± 4 (n = 12)
TET/TW 14.1 ± 0.6
(n = 49)
2.5 ± 0.2 (n = 7)
3.1 ±0.1 (n = 32)
2.8 ± 0.1 (n = 17)
3.1 ±0.1 (n = 20)
3.2 ±0.1 (n = 13)
Shown are the mean values (± s.e.m.), n = number of preparations. The contractile properties were measured as described in the text. W indicates the weeks of
22
of high frequency stimuli. The frequency used was 100 Hz or as otherwise defined in the text.
Tetanus-to-twitch force ratio (TET/TW): The ratio of peak tetanic force (100 Hz) to the peak force for the preceding twitch, with twitch stimulation at 0.067 Hz.
Force was expressed in units of mN. Some calculations of specific force (force per cross-sectional area) were made. Cross-sectional area was determined from bundle diameters (Dulhunty & Gage 1973). Values for specific peak tetanic force (200-300 mN/cm2) were similar to those reported previously indicating that the preparations were healthy (Dulhunty & Dlutowski 1979; Dulhunty 1985; Luff 1985). Some values were up to 50% lower which may have resulted from an overestimation of cross-sectional area due to spaces between fibres within these bundles.
Time-course Parameters:
20% to 80% rise (or activation) time (20-80% AT): The time for force to rise from 20%
to 80% of peak force, recorded for the twitch (units ms) (Figure 2.2A).
20% to 60% rise (or activation) time (20-60%AT): The time for force to rise from 20%
to 60% of peak tetanic force (units ms). This is the early faster phase of force development prior to a slower gradual climb to a plateau (Figure 2.2B).
These rise time parameters were chosen instead of the "time to peak twitch force" and the "maximum rate of rise" for the tetanus because their method of measurement are clearly defined and reduces possible systematic errors associated with the other rise time parameters.
80% to 20% relaxation time (80-20%RT): The time for force to decay from 80% to
20% of peak or end stimulation force following the cessation of stimulation (units ms).
Figure 2.2 shows twitch and tetanus records from a soleus preparation and how the contractile properties were measured. Average peak force and time-course parameters for preparations composed of different fibre-types and from denervated muscles are shown in Tables 2.2 and 2.3.
Fatigue Parameters:
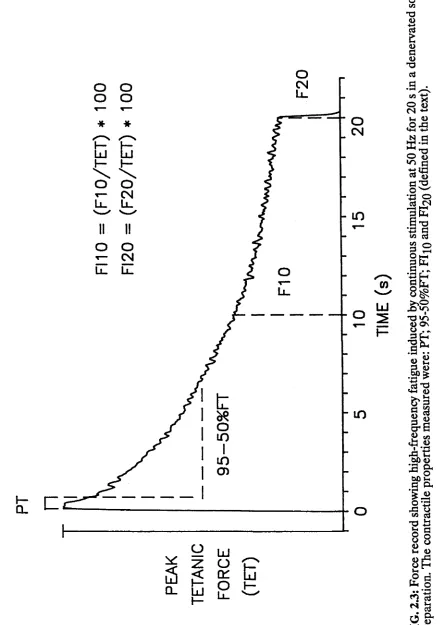
High-frequency fatigue (HFF) refers to any decline of peak tetanic force induced by
23 Fatigue index (FI*): The force generated at a stimulation duration of * seconds
expressed as a percentage of peak tetanic force (e.g. FIio = force at 10 s/ peak tetanic force x 100).
Plateau time (PT): The time from 95% of peak tetanic force on the rising phase to 95% of peak tetanic force on the falling phase (units ms).
95% to 50% fatigue time (95-50%FT): The time for force to decline from 95% to 50% of the peak force generated during continuous tetanic stimulation at constant frequency (units ms).