This is a repository copy of
Can demographic information predict MOOC learner
outcomes?
.
White Rose Research Online URL for this paper:
http://eprints.whiterose.ac.uk/86184/
Proceedings Paper:
Morris, NP orcid.org/0000-0003-4448-9381, Swinnerton, BJ
orcid.org/0000-0002-4241-4952 and Hotchkiss, S (2015) Can demographic information
predict MOOC learner outcomes? In: Experience Track: Proceedings of the European
MOOC Stakeholder. eMOOCs Conference 2015, 18-20 May 2015, Mons, Belgium. .
[email protected] https://eprints.whiterose.ac.uk/ Reuse
Items deposited in White Rose Research Online are protected by copyright, with all rights reserved unless indicated otherwise. They may be downloaded and/or printed for private study, or other acts as permitted by national copyright laws. The publisher or other rights holders may allow further reproduction and re-use of the full text version. This is indicated by the licence information on the White Rose Research Online record for the item.
Takedown
If you consider content in White Rose Research Online to be in breach of UK law, please notify us by
Can demographic information predict MOOC learner outcomes?
Neil Peter Morris, Stephanie Hotchkiss, Bronwen Swinnerton
School of Education, University of Leeds, UK
Abstract: There has been much written about the disruptive nature of Massive Open Online
Courses on Higher Education, and online learning over the last two years. During that time, universities have been delivering online courses to many thousands of participants from around the world. Studies are beginning to use the data gathered from participants before, during and after courses to understand and evaluate these online learning courses. Generally, to date studies have focussed on the drop-out rate of learners from courses. This study uses pre-course survey data and online learner behaviour data gathered from five MOOCs delivered by the University of Leeds in 2014 to understand which learner characteristics might impact on completion. The results show that four characteristics are significantly associated with degree of completion. However, further examination of the data reveals anomalies and suggests that the MOOC population is much more complex than the headline data implies.
Introduction
Massive Open Online Courses (MOOCs) have caused unprecedented debate within the academic community over the last 3 years, with some commentators speculating that they will result in a revolution in Higher Education (Agrawal, 2013). Since the advent of the modern form of MOOCs in Canada in 2008, their popularity with online learners globally has risen rapidly. The first MOOCs were cMOOCs or connectivist MOOCs, which encouraged networks of learners to connect and create learning communities using a variety of web tools. In 2012, the creation of the Coursera and Udacity platforms heralded the first xMOOCs, which are more didactic in nature, providing courses with video lectures, discussion and quizzes to many thousands of online participants. In 2013, the Open University launched FutureLearn in the UK. By January 2014, these main xMOOC providers, along with the edX platform, had offered almost 700 xMOOCS and enrolled more than 8 million users worldwide (Perna et al., 2014). The FutureLearn platform has over 800,000 registered participants and partnerships with over 35 universities and other organisations from the UK and countries around the world. FutureLearn has a social constructivist pedagogy underpinning its design, and is labelled as a social learning platform, by virtue of its ‘water-cooler’ style discussion areas provided alongside learning content (Ferguson & Sharples, 2014).
MOOC learners are an extremely heterogeneous group, consisting of male and females learners of all ages from across the world, with a wide range of prior educational attainment, prior online experience, employment status and motivations. However, focus has been drawn to the relatively high proportion of male 26-35 year old professionals with a bachelor’s degree taking online courses on the large xMOOC platforms (Ho et al., 2014), even though this group normally only represents around a quarter to half of the learner cohort. Interestingly, FutureLearn has more women registered than men: around 58% are women. However, over 70% of people registered on the platform already have a degree or higher and over 50% are working. FutureLearn users are from a wide age range: the largest group (23%) are aged between 26 and 35, but around 13% are over the age of 55 (Press Association, 2014). Other platforms have similar learner profiles (Breslow et al., 2013; Palin, 2014; Perna et al., 2014), and whilst there are emerging patterns about ‘typical’ MOOC learners, there are platform differences. As yet there is not a shared understanding of the most appropriate definition of a MOOC student (Perna et al., 2014).
A continual criticism of MOOCs has been their low completion rate, with reported rates of between 5% and 12% (Jordan, 2014; Perna et al., 2014) However, as discussed by a number of commentators, completion rates in MOOCs are not necessarily an indicator of educational success, as participants may achieve their learning goal through engaging in only a proportion of the course (Liyanagunawardena et al., 2014; Reich & Ho, 2014). Despite a lack of agreement as to what constitutes success, there is a growing body of literature that has analysed the characteristics of learners on MOOCs and how these characteristics are related to success in terms of completion. Kizilcec et al. (2013) examined MOOC completion rates, and categorised ‘completion’
into four classifications of engagement trajectories (‘auditing’, ‘completing’, ‘disengaging’ and ‘sampling’), to
gain insight into those learners who may have varying motivations for enrolling on a MOOC and therefore may
‘drop out’ after what they feel is a satisfactory point.
There have been very few empirical studies of the relationships between MOOC learners’ demographics and completion rates. Guo and Reinecke (2014), in their study of four edX MOOCs with data from 140,546 students, found that age was positively correlated with the volume of coverage, which in turn was positively correlated with grade. However, Breslow et al. (2013) found no correlation between age and
‘success’, where ‘success’ was defined as achievement in terms of the grade awarded rather than
(e.g. the US and European countries) covered more content and gained higher grades. Cisel (2014) found when examining data from the first French MOOC, that geographical location was associated with achievement. Also, learners from countries with a high HDI (Human Development Index) had higher achievement (Cisel, 2014), something which Kizilcec et al. (2013) also found for levels of engagement. Cisel (2014) also found that employment status had an impact on achievement: unemployed learners achieved higher grades than students in work. However, Cisel found no association between gender and achievement, nor did Breslow et al. (2013). Although much has been written about learners on MOOCs having a high level of prior educational attainment (Breslow et al. 2013; Palin, 2014), Breslow et al. (2013) only found a marginal association between highest degree earned and achievement.
Method
The aim of this study is to explore MOOC participants’ patterns of engagement on five MOOCs delivered by the University of Leeds on the FutureLearn platform. The five courses were: Physical actor training (Actor); Anatomy: Exploring the abdomen (Anatomy); When Worlds Collide (WWC); Innovation: the key to business success (Innovation); and Starting a business (Enterprise). Participants’ online learning activity was combined with their responses from a pre-course survey to explore relationships between completion and demographic factors, including age, gender, prior online learning experience, educational attainment, country of residence and employment status. The study attempts to answer the research question ‘Do MOOC learners who complete courses to differing degrees share any similarities in terms of demographic profile?’
Building on the work of Kizilcec et al. (2013) we have categorised learners into four groups according
to classifications adopted by FutureLearn to identify learners’ level of engagement:
1. Learners who only engaged in the first week of the course, termed ‘Week 1 only’;
2. Learners who complete the first week, and return to the second week but do not complete the course,
termed ‘Returning learners’;
3. ‘Completers’ - those who complete at least 50% of the steps and all of the assessments (required by FutureLearn to be eligible for a certificate);
4. ‘100% engaged’ - those who complete all the steps and assessments.
Data collection
Data for this study was collected by FutureLearn and supplied to the University of Leeds. FutureLearn users are advised that data collected on the platform may be used for research purposes, and this study was conducted in accordance with the FutureLearn Code of Practice for Research Ethics. Two data sources have been used in this study: (1) responses from a pre-course survey sent to all enrolled learners prior to the start of all courses, and (2) online learner activity populated by participants visiting course ‘steps’ and completing course activities.
FutureLearn uses the term ‘step’ to define the chunks of content within each course. A step can be a video, a
discussion, some textbook style content etc. Data from each source has been linked using a unique code for each participant (where available) for analysis in this study. All data is completely anonymous and individuals can not be identified by the University of Leeds. The results provided in this study offer a preliminary analysis of this large and complex data set.
Data Analysis
The data provided by FutureLearn is categorical and therefore all analyses in this paper employed non-parametric methods. The chi-square test was applied to assess whether differences in the distribution of learners across groups are statistically significant at the p<.05 level. This was performed for all independent variables across all five courses combined and at an individual course level. For some courses, the expected group sizes did not meet the minimum required to meet the assumptions of the chi-square test, therefore, where possible
Fisher’s exact test was run instead, with the categories of ‘week 1 only’ and ‘returning learners’ collapsed into
‘non-completer’ and the categories of ‘completers’ and ‘100% engaged’collapsed into ‘completer’. Age data was collected in the form of age group. Therefore it is not possible to calculate means; rather, estimated median ages have been calculated for each learner group. The median split test has been used to gauge whether the groups differ significantly by age.
Results
Our aim in this study is to compare degree of completion by various demographic variables. Therefore, for analysis purposes we are including only those learners who completed some or all of the pre-course survey (We are assuming that no educators, administrators or moderators completed the pre-course survey and thus
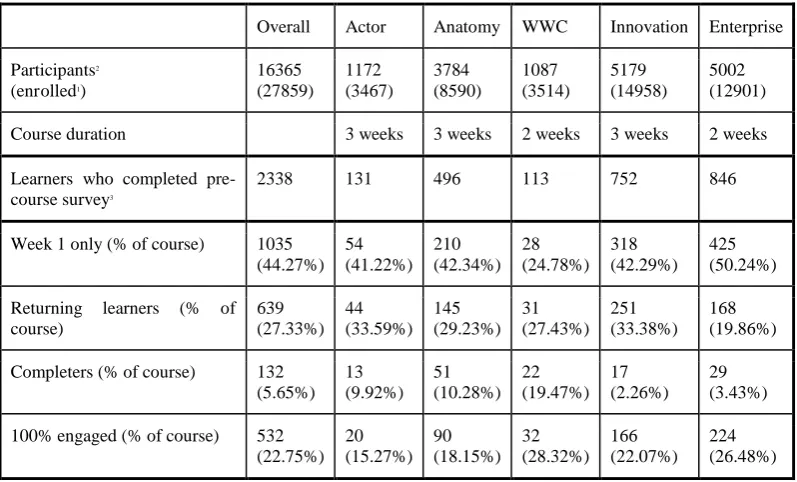
define those who did as ‘learners’.) 2,338, or 14.3% of engaged enrollers completed the survey. Table 1 shows the number of learners categorised into the four groups according to degree of completion of their course. The largest group of learners is on the Enterprise course, followed by Innovation, and the smallest number is on When World Collide. In terms of completion, overall and for each course, except When Worlds Collide, the largest group is those who did not complete the first week. For each course and overall, the smallest group is
[image:4.595.98.497.210.453.2]‘completers’.
Table 1: Course statistics, overall and by course, and by completion group
Overall Actor Anatomy WWC Innovation Enterprise
Participants2
(enrolled1)
16365 (27859)
1172 (3467)
3784 (8590)
1087 (3514)
5179 (14958)
5002 (12901)
Course duration 3 weeks 3 weeks 2 weeks 3 weeks 2 weeks
Learners who completed pre-course survey3
2338 131 496 113 752 846
Week 1 only (% of course) 1035 (44.27%)
54 (41.22%)
210 (42.34%)
28 (24.78%)
318 (42.29%)
425 (50.24%)
Returning learners (% of course)
639 (27.33%)
44 (33.59%)
145 (29.23%)
31 (27.43%)
251 (33.38%)
168 (19.86%)
Completers (% of course) 132 (5.65%)
13 (9.92%)
51 (10.28%)
22 (19.47%)
17 (2.26%)
29 (3.43%)
100% engaged (% of course) 532 (22.75%)
20 (15.27%)
90 (18.15%)
32 (28.32%)
166 (22.07%)
224 (26.48%)
1. Enrolled – those who enrolled
2. Participants – those who enrolled and completed at least two steps 3. Learners – subset of participants who completed the pre-course survey
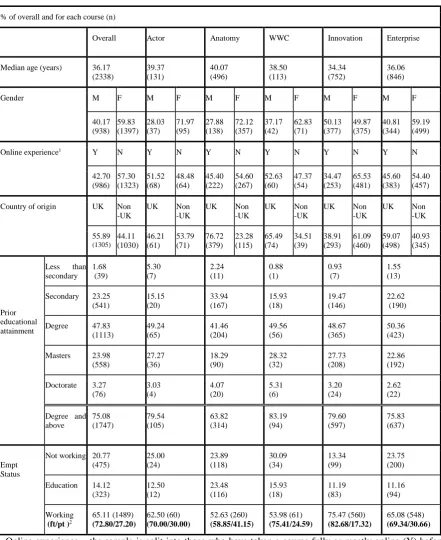
[image:4.595.99.498.211.452.2]Table 2: Characteristics of learners in sample, overall and by course
% of overall and for each course (n)
Overall Actor Anatomy WWC Innovation Enterprise
Median age (years) 36.17
(2338) 39.37 (131) 40.07 (496) 38.50 (113) 34.34 (752) 36.06 (846)
Gender M F M F M F M F M F M F
40.17 (938) 59.83 (1397) 28.03 (37) 71.97 (95) 27.88 (138) 72.12 (357) 37.17 (42) 62.83 (71) 50.13 (377) 49.87 (375) 40.81 (344) 59.19 (499)
Online experience1 Y N Y N Y N Y N Y N Y N
42.70 (986) 57.30 (1323) 51.52 (68) 48.48 (64) 45.40 (222) 54.60 (267) 52.63 (60) 47.37 (54) 34.47 (253) 65.53 (481) 45.60 (383) 54.40 (457)
Country of origin UK Non
-UK
UK Non
-UK
UK Non
-UK
UK Non
-UK
UK Non
-UK
UK Non
-UK 55.89 (1305) 44.11 (1030) 46.21 (61) 53.79 (71) 76.72 (379) 23.28 (115) 65.49 (74) 34.51 (39) 38.91 (293) 61.09 (460) 59.07 (498) 40.93 (345) Prior educational attainment
Less than
secondary 1.68 (39) 5.30 (7) 2.24 (11) 0.88 (1) 0.93 (7) 1.55 (13)
Secondary 23.25
(541) 15.15 (20) 33.94 (167) 15.93 (18) 19.47 (146) 22.62 (190)
Degree 47.83
(1113) 49.24 (65) 41.46 (204) 49.56 (56) 48.67 (365) 50.36 (423)
Masters 23.98
(558) 27.27 (36) 18.29 (90) 28.32 (32) 27.73 (208) 22.86 (192)
Doctorate 3.27 (76) 3.03 (4) 4.07 (20) 5.31 (6) 3.20 (24) 2.62 (22)
Degree and above 75.08 (1747) 79.54 (105) 63.82 (314) 83.19 (94) 79.60 (597) 75.83 (637) Empt Status
Not working 20.77 (475) 25.00 (24) 23.89 (118) 30.09 (34) 13.34 (99) 23.75 (200)
Education 14.12
(323) 12.50 (12) 23.48 (116) 15.93 (18) 11.19 (83) 11.16 (94) Working (ft/pt )2
65.11 (1489) (72.80/27.20) 62.50 (60) (70.00/30.00) 52.63 (260) (58.85/41.15) 53.98 (61) (75.41/24.59) 75.47 (560) (82.68/17.32) 65.08 (548) (69.34/30.66)
1. Online experience – the sample is split into those who have taken a course fully or mostly online (Y) before and those who have not (N)
2. Learners who are working are also split into those who are in full-time employment and those in part-time employment (%)
groups have more UK-based learners than non-UK; ‘completers’ has the largest proportion of UK-based with 65.65% (n=86), whilst ‘returning learners’ has the least with 53.36% (n=341). For all groups the majority of
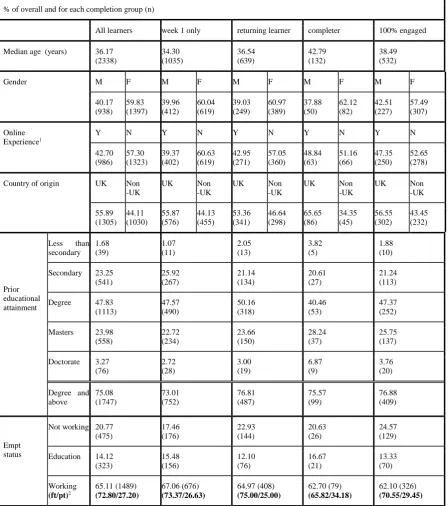
[image:6.595.74.523.180.687.2]learners are educated to degree level or above. ‘100% engaged’ has the highest proportion of learners with a degree or above (76.88%, n=409), with ‘returning learners’ having almost the same proportion (76.81%, n=487) and those who drop out in the first week have the lowest proportion with 73.01% (n=752), but these proportions are very similar across all four groups.
Table 3: Characteristics of learners in sample, overall and by completion group
% of overall and for each completion group (n)
All learners week 1 only returning learner completer 100% engaged
Median age (years) 36.17
(2338) 34.30 (1035) 36.54 (639) 42.79 (132) 38.49 (532)
Gender M F M F M F M F M F
40.17 (938) 59.83 (1397) 39.96 (412) 60.04 (619) 39.03 (249) 60.97 (389) 37.88 (50) 62.12 (82) 42.51 (227) 57.49 (307) Online Experience1
Y N Y N Y N Y N Y N
42.70 (986) 57.30 (1323) 39.37 (402) 60.63 (619) 42.95 (271) 57.05 (360) 48.84 (63) 51.16 (66) 47.35 (250) 52.65 (278)
Country of origin UK Non
-UK
UK Non
-UK
UK Non
-UK
UK Non
-UK
UK Non
-UK 55.89 (1305) 44.11 (1030) 55.87 (576) 44.13 (455) 53.36 (341) 46.64 (298) 65.65 (86) 34.35 (45) 56.55 (302) 43.45 (232) Prior educational attainment
Less than
secondary 1.68 (39) 1.07 (11) 2.05 (13) 3.82 (5) 1.88 (10)
Secondary 23.25
(541) 25.92 (267) 21.14 (134) 20.61 (27) 21.24 (113)
Degree 47.83
(1113) 47.57 (490) 50.16 (318) 40.46 (53) 47.37 (252)
Masters 23.98
(558) 22.72 (234) 23.66 (150) 28.24 (37) 25.75 (137)
Doctorate 3.27 (76) 2.72 (28) 3.00 (19) 6.87 (9) 3.76 (20)
Degree and above 75.08 (1747) 73.01 (752) 76.81 (487) 75.57 (99) 76.88 (409) Empt status
Not working 20.77 (475) 17.46 (176) 22.93 (144) 20.63 (26) 24.57 (129)
Education 14.12
(323) 15.48 (156) 12.10 (76) 16.67 (21) 13.33 (70) Working (ft/pt)2 65.11 (1489) (72.80/27.20) 67.06 (676) (73.37/26.63) 64.97 (408) (75.00/25.00) 62.70 (79) (65.82/34.18) 62.10 (326) (70.55/29.45)
1. Online experience – the sample is split into those who have taken a course fully or mostly online (Y) before and those who have not (N)
2. Learners who are working are also split into those who are in full-time employment and those in part-time employment
We carried out chi-square analyses to test the extent to which these characteristics are significantly associated with degree of completion. There is very strong evidence of an association between age and degree of completion (chi-square = 59.7, df=18, p<0.001), with older learners completing more of their course (see Figure 1).
Figure 1. Completion group by age (%)
We have examined gender for the whole sample, both at the level of the four completion groups and with collapsed groups of ‘completer’ and ‘non-completer’ and have not found any evidence to suggest that gender has an effect on the degree of completion, although there are some differences by course, which for the whole sample cancel each other out. This suggests that gender differences may well be a function of the content and /or the design of the course and this area merits further research.
[image:7.595.153.468.369.520.2]There is strong evidence of an association between prior online experience and degree of completion of the course (chi-square =11.28, df=3, p=0.010) (see Figure 2).
Figure 2. Completion group by Figure 3. Completion group prior online experience (%) by educational attainment (%)
Does prior educational attainment impact on degree of completion?. The association is significant (chi-square = 9.83, df=4, p=0.043), and for most groups it appears that the higher the prior educational attainment the more likely the learner is to complete (see figure 3).However, contrary to expectation given this trend, those who have less than secondary education have the highest completion rate at 38.5% (n=15).
Figure 4. Completion group by employment status (%)
[image:7.595.228.361.589.705.2]Discussion
The analyses above have shown that four of the variables investigated have a significant association with degree of completion; namely age, prior online learning experience, prior educational attainment and employment status. Some of our findings concur with previous studies. The relationship of age with completion is similar to the findings of Guo and Reinecke (2014), although Breslow et al., (2013) found no such relationship. Knox
suggests that MOOCs may be overwhelming and that they ‘can disorientate learners who may be expecting the
orderly setting of the classroom or lecture hall’ (Knox, 2014, p.170). It is not surprising therefore that we found that learners with experience of participation in an online course previously complete more of their course. Although no prior qualifications are required for access to any of these MOOCs, over three-quarters of learners on these MOOCs have a degree or higher, with this rate reaching as high as 83.19% for When Worlds Collide. Our analysis has found that the higher the prior educational attainment the greater the completion. Those who
have been through education successfully are used to ‘finishing’ things or at least completing the requirements
for a qualification. Breslow et al. (2013) also looked at this variable, but only found a marginal association. We have also found, in common with Cisel (2014) that those learners not working are more likely to complete more of their course. This is not too surprising as this group of learners probably have more free time. We did not find overall statistical significance for gender, which aligns with the findings from Breslow et al. (2013) and Cisel (2014). However, when we looked at gender at course level we did find it was significant for two courses, although be aware that the groups are small (n = between 5 and 29) and any findings should be treated with caution. Is it related to the content, the design, the length, the number of steps, the types of steps, or something else entirely?
However, when these results are examined more closely there are anomalies within our findings. When we found that age and completion were strongly associated, and that those who were not working were more likely to complete more than those working or in education, it was thought that this may be accounted for by a group of retired learners who have more time than most learners completing all, or most of, the course they enrolled on. However, despite the trend for older learners to complete more, the oldest group, aged 66+ are slightly less likely to complete than the 56-65 age group. We also found that prior educational attainment is associated with degree of completion, except for the group of learners who had the lowest level of prior educational attainment. Learners who had less than secondary education (the lowest category of educational attainment) were likely to complete more of their course than any other group, even than those with doctorates. Again, the ‘less than secondary education’ group is small (n=39) in relation to the whole sample and their results should be treated with caution.
What these anomalies suggest is that whilst we can find trends in the behaviour of learners, there are also anomalous groups which buck these trends. More detailed analyses which examine small groups such as those who have less than secondary school education may help us to understand them better. Are they
‘unemployed’ rather than retired and thus have more time on their hands and a particular motivation to finish the
course, to make themselves more employable? Actually, when this group was examined further we found that it contains 39 learners, 55% of whom are under 18, and 53% of them are in full time education, i.e. they are still in full-time compulsory education and have not yet finished secondary education, rather than being older learners who did not reach this educational attainment. The two courses that these learners were most likely to be enrolled on are the two that are aimed at school level learners; Enterprise and Anatomy.
Limitations
Motivation of the learner may also have a significant effect in terms of the learners’ goals and intentions in
relation to the course (Hew & Cheung, 2014; Wang & Baker, 2014). For example, if a learner enrols intending to audit a course, success for them may consist of remaining engaged with the content but without completing assignments. Our four completion categories miss those learners whose intention from the outset was to audit the course, a category which Kizilcec et al. (2013) does include. They are captured in the ‘Returning Learners’ in our categorisation, but this group includes others too. However, Breslow et al.’s (2013) work suggests that learners may not be dropping out where they feel it is a satisfactory point for them individually and that there may be other reasons for non-completion. Yuan and Powell (2013) also argue that it is important to find out more about those who drop out, and suggest looking at why and at what stage they drop out.
Conclusions
young university student with limited time who wants to know more about a particular area of statistics, for example, who enrols on a MOOC finds out what they need and exits. Our future work will explore analyses which group learners by multiple characteristics, and thereby provide a starting point to build portraits of different types of learners, with different motivations and intentions, as well as different characteristics, which may then help us to understand who might need support to achieve their learning goals.
References
Agrawal, A. (2013, June 15). Online universities: it's time for teachers to join the revolution. The Observer.
http://www.theguardian.com/education/2013/jun/15/university-education-online-mooc Accessed 8
January 2015
Breslow, L., Pritchard, D. E., DeBoer, J., Stump, G. S., Ho, A. D., & Seaton, D. T. (2013). Studying learning in the worldwide classroom: Research into edX’s first MOOC. Research and Practice in Assessment. 8, 13-25.
Cisel, M. (2014). Analysing completion rates in the First French xMOOC. EMOOCs 2014: European MOOCs Stakeholders Summit. Proceedings. Research Track. 26-32.
Department for Business, Innovation & skills (BIS). (Sept, 2013). The Maturing of the MOOC: Literature Review of Massive Open Online courses and Other Forms of Online Distance Learning. BIS Research Paper. No. 130.
Ferguson, R., & Sharples, M. (2014). Innovative Pedagogy at Massive Scale: Teaching and Learning in MOOCs. In Open Learning and Teaching in Educational Communities (pp. 98-111). Springer International Publishing.
Press Association, (29th December 2014). ‘More turning’ to online learning. Available on FutureLearn press
coverage website. https://about.futurelearn.com/press-coverage/ Accessed 19 January 2015.
Glance, D. (2014). Online courses, diets, and going to the gym. The science of why we give up. The Conversation.
http://theconversation.com/online-courses-diets-and-going-to-the-gym-the-science-of-why-we-give-up-33746 Accessed 8 January 2015.
Guo, P.J. & Reinecke, K. (2014). Demographic Differences in How Students Navigate Through MOOCS. Proceedings of the first ACM conference on Learning@ scale conference (21-30). ACM
Hew, K.F. & Cheung, W.S. (2014). Students’ and instructors’ use of massive open online courses (MOOCs):
Motivations and challenges. Educational Research Review. 12, 45-58.
Ho, A. D., Reich, J., Nesterko, S., Seaton, D. T., Mullaney, T., Waldo,J., & Chuang, I. (2014). Harvard X and MITx: The first year of open online courses (HarvardX and MITx Working Paper No. 1).Cambridge, MA: Harvard University/MIT.
Jordan, K. (2014). Initial Trends in Enrolment and Completion of Massive Open Online Courses. The International Review of Research in Open and Distance Learning. 15 (1), 133-160.
Kizilcec, R.F., Piech, C & Schneider, E. (2013). Deconstructing Disengagement: Analyzing Learner Subpopulations in Massive Open Online Courses. LAK conference presentation. Accessed 15 December 2014.
Knox, J. (2014). Digital culture clash: “massive” education in the E-learning and Digital Cultures MOOC. Distance Education. 35, (2), 164-177.
Liyanagunawardena, T.R., Parslow, P. & Williams, S.R. (2014). Dropout: MOOC Participants’ Perspective.
EMOOCS 2014: European MOOCs Stakeholders Summit. Proceedings. Research Track. 95-100. Palin, A. (2014). Moocs: Young students from developing countries are still in the minority. FT.com. March 9.
2014.
Perna, L.W., Ruby, A., Boruch, R.F., N, Scull, J, Ahmad, S & Evans, C. (2014). Moving Through MOOCs: Understanding the Progression of Users in Massive Open Online Courses. Educational Researcher. 43 (9), 421-432.
Reich, J. & Ho, A. (2014). The Tricky Task of Figuring Out What Makes A MOOC Successful. The Atlantic. 23 January 2014 .
http://www.theatlantic.com/education/archive/2014/01/the-tricky-task-of-figuring-out-what-makes-a-mooc-successful/283274/ Accessed 8 January 2015.
Wang, P & Baker, R. (2014). MOOC Research Initiative – Final Report: MOOC Learner Motivation and Course Completion Rates.
http://www.moocresearch.com/wp-content/uploads/2014/06/MRI-Report-WangBaker-June-2014.pdfAccessed 7 January 2015
Yang, D., Sinha, T., Adamson, D. & Penstein Rose, C. (2013). "Turn on, tune in, drop out: Anticipating student dropouts in massive open online courses." Proceedings of the 2013 NIPS Data-Driven Education Workshop.