USING PROBABILITY TREE METHOD TO
PERFORM HUMAN RELIABILITY AND ERROR
ANALYSIS IN ROAD TRANSPORTATION SYSTEM
Neda Javadieh
1, Dr Amir Abdekhodaee
2, Dr Mehran Ektesabi
31
PhD Student,
2,3Senior Lecturer, Faculty of Science, Engineering and Technology,
Swinburne University of Technology (Australia)
ABSTRACT
Worldwide, an estimated 1.2 million people are killed in road crashes each year and as many as 50 million are injured. Projections indicate that these figures will increase by about 65% over the next 20 years unless there is new commitment to prevention. Accident prevention mission is to prevent accidents in the future. To do so the focus should theoretically be on how accidents will happen rather than how they did happen. Despite this in road transportation system much effort has been put on accident investigation than prediction. There are different approaches for accident prevention and each comes with different analysis methods; however one important thing remains the same in all of them; to prevent an accident from happening in the future there is a need to identify the contributing factors or causes via investigating the past accidents or predicting the future ones. Approximately over %70 of transportation accidents are the result of driver error. Such accidents can, in theory, be predicted and prevented by risk assessment/ human reliability assessments.
Several risk (human) reliability analysis methods like Fault Tree Analysis and Failure Mode and Effect analysis have been developed in road transportation system with different goals [1-3], however a driver error based risk analysis study using these methods is yet to be carried out. In this paper we have performed risk analysis and human reliability in road transportation network using Probability Tree Method to study the effects of human error in safety and the reliability of road transportation. Our results indicate that Probability Tree as a quantitative method enables us to perform task analysis and helps us to predict the possible effects of errors on driving and road network.
Keywords: Human reliability analysis, Probability Tree Method, human error, driving system
I. INTRODUCTION
Each year billions of dollars are spent to construct or build roads and motor vehicles throughout the world to
move people and goods from one point to another. Road transportations account for a large sum of annual
revenues. In road transportation systems, safety is a pressing problem because worldwide more than 1 million
To prevent happening of future accidents, the focus of road safety should shift from accident investigation to
accident prediction which means from a systematic view beside the need to investigate and analyse the previous
accidents there is a need to predict and identify future accidents.
Accident causation is often found to be attributable to a diversity of factors including; poor engineering, poor
man-machine interface design, inadequate training, poorly worded instruction manuals, driver error and etc. The
biggest cause of road accidents however is driver error. A recent research in UK indicates that human error is
the main contributor in 68% of all roadway crashes while in some other researches this share reaches to %75
[5-7].
The traditional view in road safety has been that when accidents occur, they are usually the sole responsibility of
individual road users, despite the fact that other factors beyond their control may have been involved, such as
the poor design of roads or vehicles. It is still believed today that since human error is a factor in some 80% of
road accidents, the leading response should be to persuade road users to adopt “error-free” behaviour [4].
In this paper we firstly review accident prevention approaches and their analysis method. We will then get use
of Probability Tree Method to perform human reliability and error analyses in road transportation system. Using
Probability Tree Method our aim is to perform task analysis to identify the most unreliable performance shaping
factors and to estimate the driver error risk associated with driving.
1.1 Accicent Prevention
According to Heinrich et al. [8], accident prevention is a cyclic process to maintain or improve the system
performance. There are two main accident prevention approaches, the passive approach and the proactive
approach. In passive approach the aim is to reduce the difference between current and desired system state while
in a proactive approach the aim is to minimize the difference between upcoming and desired system state. For
both of these approaches there is a need to analyse the system via task analysis and identify the performance
shaping factors (causes) contributing in accidents [9].
1.1.1 Passive Approach
In Passive approach as mentioned before the aim is to minimize the difference between upcoming and desired
system state. This means that for every accident occurred there would be an attempt to immediately develop
remedies or countermeasures to prevent it from happening again.It can be said that Passive accident prevention
approach follows accidents
.
Based on how passive accident prevention approach performs in dealing with accident situations, there is a need
to get use of Retrospective analysis. Here is a definition of retrospective analysis: Retrospective analyses consist
of the assessment of events involving human machine interaction, such as accidents, incidents, or “near-misses”, with the objective of a detailed search for the fundamental reasons, facts, and causes (“root cause”)
that fostered them [10]. The purpose of the retrospective analysis is to identify the contributing factors (causes) of an accident and address them with countermeasures.
1.1.2 Proactive Approach
In a proactive approach the aim is to minimize the difference between upcoming and desired system state. This
means that there would be an attempt to predict the probable future accidents before taking place and develop
preventive remedies or countermeasure to avoid their happening. It can also be said the proactive approach acts
Based on how proactive accident prevention approach performs in dealing with accident situations, there is a
need to get use of prospective (predictive) analysis. Here is a definition of prospective analysis: Prospective
analyses entail the prediction and evaluation of the consequences of human-machine interaction, given certain initiating events and boundary configurations of a system [10]. The purpose of the prospective analysis is to predict and evaluate future accidents.
1.2 Driver Error Analysis Using Accident Prevention Approaches
In each of these accident prevention approaches the aim is to prevent accidents from happening in the future
whether by learning from previous accidents or predicting the future ones. The first step either in passive or
proactive approach is to identify or predict the causes in the past or contributory factors in the future accidents.
Road traffic is a complex dynamic system composed of driver, vehicle, road and environment. Although
accident happening has various reasons, human error is the most important element. This importance is due to
over %75 contribution of human error in road accidents.
To study driver error role in traffic accidents there are some risk analysis/ human reliability methods considered
useful which are among the prospective analysis.
II. RISK ANALYSIS/ HUMAN RELIABILITY METHODS TO STUDY DRIVER ERROR
In road transport safety research some analysis methods have been developed for analysing technical and human
failures. In this paper our focus is on methods which are capable of using in risk analysis/ human reliability
analysis and concentrate on human failure (errors) Human Failure Mode and Effect Analysis and Fault Tree
Analysis methods are reviewed precisely while Probability Tree Method is discussed more using a case study.
2.1 Human Failure Mode and Effect analysis (H-FMEA)
Failure Mode and Effect Analysis (FMEA), is a technique to prospectively identify, analyse and evaluate the
potential failure modes of a process, in order to reduce the risk of the production process systematically and
effectively. FMEA is an engineering activity that explores the effects of possible failure modes on a system and
its environment. Human Failure Mode and Effect Analysis (H-FMEA) is based on the philosophy that human
errors can be controlled by managing the performance shaping factors effecting human performance, building
barriers to prevent human error, adding controls to detect and correct human error before it leads to an
undesirable outcome and building error tolerant systems [11].
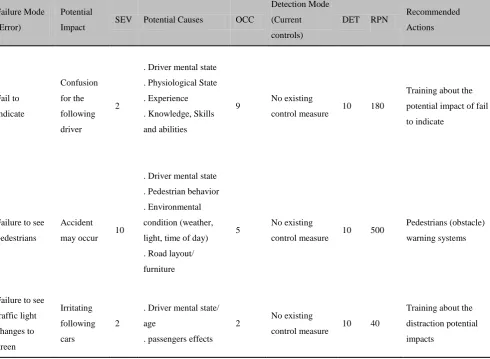
In our previous study, H-FMEA is applied to driving system and demonstrated such a system could be used to
investigate what are the risks associated with driving, what error causing failures exist across road transport
systems, how they influence driver behaviour and which failures lead to what driving errors [12]. In Table 1 you
Table 1- Part of H-FMEA Developed in [12]
2.2 Fault Tree Analysis
FTA is a method of examination of a particular event which is an undesired outcome of a process or system and
is referred as the „top event‟. If we consider driving as a system the undesired event could be an error caused by
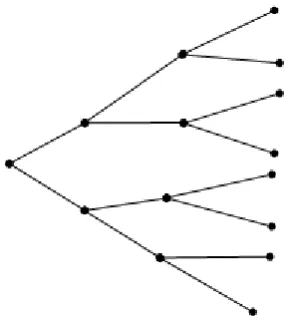
driver which is one of the system elements. It is a tree-like diagram and paths of the fault tree describe the
sequences and relationships between basic events and top events. The tree expands to reach to basic events or
the first causes of that undesired event. In Figure 1 you can see how a fault tree looks like.
Figure 1- Example of Fault Tree
Failure Mode(Error)
Potential
Impact SEV Potential Causes OCC
Detection Mode
(Current
controls)
DET RPN Recommended Actions Fail to indicate Confusion for the following driver 2
. Driver mental state
. Physiological State
. Experience
. Knowledge, Skills
and abilities
9 No existing
control measure 10 180
Training about the
potential impact of fail
to indicate
Failure to see
pedestrians
Accident
may occur 10
. Driver mental state
. Pedestrian behavior
. Environmental
condition (weather,
light, time of day)
. Road layout/
furniture
5 No existing
control measure 10 500
Pedestrians (obstacle)
warning systems
Failure to see
traffic light changes to green Irritating following cars 2
. Driver mental state/
age
. passengers effects
2 No existing
control measure 10 40
Training about the
distraction potential
2.3 Probability Tree Method
The Probability Tree Method is frequently used to perform task analysis. To do so, the method diagrammatically
denotes critical human actions (errors) and other related events. The task analysis diagram is represented by the
probability tree. Each branch represents outcomes (success or failure) of each event associated with a given
problem and is assigned an occurrence probability. Some of the advantages of this method are:
An effective visibility tool
Simplified mathematical computation
Useful tool to predict the quantitative effects of errors [13].
In this paper we develop a Probability Tree Method as a quantitative method to perform task analysis and to
predict the possible effects of human errors on road transport.
Figure 2- Example of a Probability Tree
III. A PROBABILITY TREE METHOD FOR DRIVING SYSTEM
Driving is a dynamic complex task consisting driver, vehicle and environment. To study driver error, the most
influential element in traffic accidents, there is a need to have some good knowledge about the driver error
types. Many studies have sought to classify the different driver error types. The most dominant error
classification is Reason‟s slips, lapses, mistakes and violations [14]. Slips are those errors in which the intention
or plan was correct but the execution was incorrect and they are the most common error type. Lapses involve a
failure to perform an intended action or forgetting the next action. Mistakes originate at the planning level rather
than execution level in which an inappropriate intention or wrong decision is followed by correct execution.
Violations involve any behaviour that deviates from the accepted procedures (intentionally or unintentionally).
There are many different types of driver behaviour models and based on them different driver error types are
identifiable. One of the most used driver behaviour model is Treat et al.„s model [15] involving recognition
phase , decision phase and performance phase. Different driver errors can be divided in these three phases
which causes errors of recognition, errors of decision and the errors of performance. The driver behaviour model
which is going to be used in our study and to classify errors is a simplistic form of Rumar‟s model which
focuses on the Perception errors, decision making errors and action-taking process errors [16]. The idea behind
all these classifications relies on driver behaviour models which perceive driving process involves three step
If we perceive driving tasks of perception, decision making and action are independent and performed one after
each other correctly (without error) or incorrectly (with error), we can develop a probability tree and calculate
the probability of successfully/ un successfully (with or without error) accomplishing the overall mission
(driving). To calculate the probability of accomplishing the driving task (with or without error), we firstly need
to calculate the probability of performing each task (perception, decision making and action), successfully or
unsuccessfully (with or without error).
We use the data from an on road study of driver errors published in a report by Austroads [17], The Nature of
Errors Made by Drivers. The main aim of the Austroad study has been to conduct a pilot study focussing on the
nature of the errors made by drivers and for that purpose an on road study involving the use of instrumented
vehicle was undertaken. Twenty five drivers (15males, 10 females) aged 19-59 (mean=29.5. SD=11.9) took
apart in that study which was driving a 21 km urban route incorporating 29 intersections. The errors observed
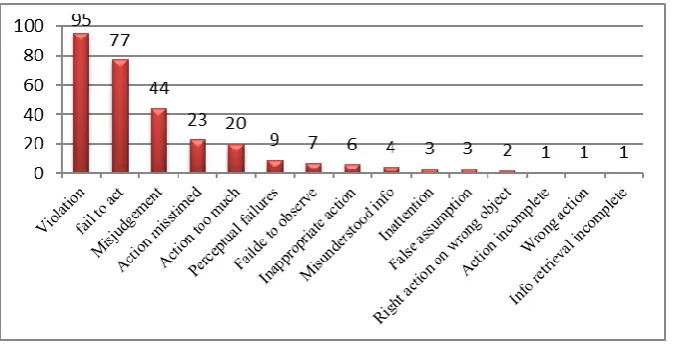
during the on road study were further classified into external error modes using the driver error taxonomy
presented by Stanton and Salmon [18]. Figure 3 presents a breakdown of the different error modes identified
during the on road study.
Figure 3- Frequency of Different Error Types Made During on Road Study
In this stage there is a need to categorise these driver error modes extracted from on road study by Austroads in
to the three driver error types related to driver behaviour model which are, perception errors, decision making
errors and action errors. In table 2 some error modes are classified under each error type categories of
perception, decision making and action. For each error mode there are some examples to describe the situations.
Table 2- Driver Error Types, Error Modes and Error Examples Categorise Under Perception,
Decision Making and Action Errors
General Characteristics Error Modes Error Example
P er ce p ti o n Er ro
rs Environmental
complexity
Visibility restrictions
Inattention
Distraction
Perceptual failure
Failure to see pedestrian crossing, delays in recognition road signs,
signals providing driver information and road features, such as
on-coming curves, lane narrowing, etc.
Inattention
Nearly hit car in front when queuing, failing to see traffic lights change
to green, inattention to road features, such as on-coming curves, lane
narrowing, etc.
Distraction Distracted by secondary task e.g. mobile phone, conversation,
Adjusting window, vent, heater, or similar control
False assumption
Wrongly assume a vehicle will not enter path, wrongly assuming the
speed limit is 50km/H when it is in fact 60km/h, Assumed other driver
would stop or yield at intersection
Misjudgment Misjudged speed of oncoming vehicle, misjudging braking
requirements or gap in the traffic
Misread information Misread road sign, traffic control device or road markings
Misunderstood information Perceive information correctly but misunderstand it
Information retrieval incomplete Only retrieved part of information required
Situation Assessment
Wrong information retrieved Read wrong information from road sign
D ec is io n m ak in g Er ro
rs Incorrect decisions
(due to inexperience/
expectancy)
False assumptions
Misjudgment (speed,
distance)
Intentional violation Overtake on the inside, knowingly speeding
False assumption
Wrongly assume a vehicle will not enter path, wrongly assuming the
speed limit is 50km/H when it is in fact 60km/h, Assumed other driver
would stop or yield at intersection
Inappropriate action Following too close (tailgating) , race for gap, risky overtaking,
Braking later than should have or at inappropriate location
Misjudgment Misjudged speed of oncoming vehicle, misjudging braking
requirements or gap in the traffic
Failed to observe Failed to observe area in front of vehicle, failed to observe a vehicle
Right Observation on Wrong
Object
Failed to observe appropriate area
Observation Mistimed Looked in drivers side mirror too late when changing lane
A ct io n Er ro rs
Reaction delay
Incorrect control
handling
Vehicle
characteristics
Fail to act Fail to check rear view mirror, fail to indicate
Wrong action Press accelerator instead of brake
Action mistimed Brake too early or too late, activated the indicator too early
Action too much Press the accelerator too much
Action too little Fail to press the accelerator enough
Action Incomplete Fail to turn the steering wheel enough
Inappropriate action Following too close (tailgating) , race for gap, risky overtaking,
Braking later than should have or at inappropriate location
Right action on wrong object Press accelerator instead of brake, activating windscreen wipers instead
of indicators
Panic or freezing Fail to perform any action at confusing situation or performed improper
action due to panic
As you can see in the table some error modes due to their nature can be categorised in more than one group. For
instance violation errors can be categorized as either in decision making errors or action errors cause they can be
intentionally/ unintentionally so although they are action errors the possibility of deciding to perform them or
not (intentionally) could place them among decision making errors as well.
Based on the number of errors happened during the study. Out of 296 happened errors during the on road study,
61 errors were Perceptual errors, 10 errors were decision making errors and the rest which is 225 were action
errors. The most common error mode was violation (intentional/ unintentional). Therefor probability of
performing Perceptual errors is %22, Probability of occurring decision making errors is %52 and probability of
action errors happening is %43.
We now can develop the probability tree method for driving system errors based on these data to calculate the
probability of the completing the driving task with or without error.
If consider the first branch of Probability Tree Method, performing Perception phase of driving, one branch
represents Probability of performing the task without Perception errors (P(P)) and the other presents probability
of Perception errors occurred )). For the each of these branches we now will have 2 branches for decision
making phase, which is probability of performing the task with no decision errors (P(D)) and the other is
probability of decision making errors occurred (P( )) . In third layer for each branch we would have the
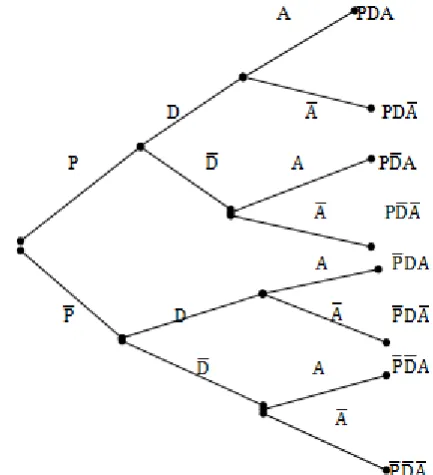
possibility of performing action task with (P( )or without errors (P(A)). You can see the developed tree in
Figure 4.
Figure 4- The Probability Tree Method for Driving Error Analysis
The six symbols used in figure 4 are defined below;
P represents the process that perception phase is performed with no error.
represents the process that perception phase is performed with error.
D represents the process that decision making phase is performed with no error.
represents the process that decision making phase is performed with error.
represents the process that Action phase is performed with error.
And also;
P (P) is the probability of performing Perception phase with no error.
P ) is the probability of performing Perception phase with error.
P (D) is the probability of performing Decision making phase with no error.
P ( ) is the probability of performing Decision making phase with error.
P (A) is the probability of performing Action phase with no error.
P ( is the probability of performing Action phase with error.
Since for each of these errors, for example for decision making errors, P (D) = 1 - P ( );
P (completing driving task with no error) = P (P) * P (D) * P (A)
P (completing driving task with error) = 1 - P (P) * P (D) * P (A)
Based on the data from the on road study if we calculate the probabilities,
P (P) = 1- 0.22 = 0.78
P (D) = 1- 0.52 = 0.48
P (A) = 1- 0.43 = 0.47
P (completing driving task with error) = 1- 0.8*0.96*0.24 = 0.83
P (completing driving task with no error) = 0.78*0.48*0.47 = 0.17
In a study by Treat et al. they classified the errors happened during a study based on their categories of errors
(errors of recognition, errors of decision and errors of performance and found that errors of recognition were
involved in %56 of crashes analysed, decision errors were involved in %52 of the crashes analysed and
performance errors were involved in %11 of the crashes analysed.
We also have developed a Probability tree for this data to compare it with our results. However there is one
difference in data gathering between this study and Austroads which is, Treat et al. study focuses on crash
analysis and presents the type and number of errors contributed to crashes while Austroad study‟s main focus
has been on driver error types and developing an on road study to explore the nature of errors made by drivers
within an on road study without any crash occurring.
If we use the data from Treat et al. study involving the type and number of errors contributing in accident to
estimate the probability of those errors happening again and to predict the probability of completing the driving
task without those errors, the results would be as follows:
P (P) = 1- 0.56 = 0.44
P (D) = 1- 0.52 = 0.48
P (A) = 1- 0.11 = 0.89
P (completing driving task with error) = 1- 0.44*0.48*0.89 = 0.81
P (completing driving task with no error) = 0.44*0.48*0.89 = 0.19
There is a consistency in the results of developed Probability Trees for both of the studies and it indicates
however the number of errors in one study represents just errors leading/ not leading to crashes and in the other
study number of errors contributing to accidents are considered, the Probability of completing the driving task
Starting to develop Probability Tree we deemed the independency of driving tasks of perception, decision
making and action. The final result and comparing with other studies validates there was nothing wrong with
our assumptions, since The Probability Trees developed for both data came out with consistent results.
IV. CONCLUSION
This paper presents some human reliability/ risk analysis methods that can be used in road transportation system
including Human Failure Mode and Effect Analysis, Fault Tree Method and Probability Tree Method. These
methods have been widely used in road transportation studies with different goals; however their application in
driving errors analysis seemed to be an area requiring more attention. This paper is part of an ongoing research
on systematic risk (human) reliability analysis of driver errors during performing driving tasks. Probability Tree
Method as one of the methods used in reliability analysis has further been explained and a Probability Tree has
been developed for driver errors occurring in road transport. Using Probability Tree Method enables us to
calculate the probability of successfully/ unsuccessfully accomplishing the overall mission, which in our study
the mission is driving task and occurring or not occurring driver error is an index representing successfully/
unsuccessfully finishing of our mission. This Method along with other human reliability/ risk analysis methods
can be used to study the effects of human error in safety and the reliability of road transportation and will help to
estimate the possible effects of errors on road network.
REFERENCES
[1]. ADVISORS, Compendium of existing Insurance schemes and Laws, risk analysis of ADA systems and
expected driver behavioural changes. ADVISORS projecr deliverable D3/8.1. 2001.
[2]. RESPONSE2, Final Report: ADAS – from Market Introduction Scenarios towards a Code of Practice for
Development and Evaluation. 2005.
[3]. Curtin-Monash Accident Research Centre, Designing Safer Roads to Accommodate Driver Error. 2011.
[4]. World Health Organization, World report on road traffic injury prevention. 2004.
[5]. Medina, A.L., et al., Relationship between infrastructure, driver error, and critical incidents. 2004.
[6]. Wierwille, W.W., et al., Identification and Evaluation of Driver Errors: Overview and Recommendations.
2002.
[7]. Salmon, P.M., M.A. Regan, and I. Johnston, Human error and road transport : phase one : literature review
Report (Monash University. Accident Research Centre) ; no. 256. 2005, Clayton, Vic. :: Monash
University Accident Research Centre.
[8]. Heinrich, H.W., et al., Industrial Accident Prevention: A Safety Management Approach. 1980:
McGraw-Hill.
[9]. Huang, Y.-H., Having a New Pair of Glasses, Applying Systemic Accident Models on Road Safety 2007.
[10]. Cacciabue, P.C., Guide to applying human factors methods : human error and accident management in
safety-critical systems book, 2004.
[11]. Mei, R., Z. Tingdi, and Y. Yang. Advanced human factors Process Failure Modes and Effects analysis. in
[12]. Javadieh, N., A. Abdekhodaee, and M.M. Ektesabi, Risk Analysis of Human Errors in Road Transport
Using H-FMEA Technique. 2014.
[13]. Dhillon, B.S., Human reliability and error in transportation systems. 2007, London: London : Springer.
[14]. Reason, J.T., Human error. 1990, Cambridge [England]; New York: Cambridge University Press.
[15]. Treat, J.R., et al., Tri-level Study Of The Causes Of Traffic Accidents: An Overview Of Final Results
1979.
[16]. Rumar, K., The Role of Perceptual and Cognitive Filters in Observed Behavior, in Human Behavior and
Traffic Safety, L. Evans and R. Schwing, Editors. 1985, Springer US. p. 151-170.
[17]. Austroad reserch report, M., The Nature of Errors Made by Drivers. 2011.
[18]. Stanton, N.A. and P.M. Salmon, Human error taxonomies applied to driving: A generic driver error