White Rose Research Online URL for this paper:
http://eprints.whiterose.ac.uk/87933/
Version: Accepted Version
Article:
Chandler, JH, Hood, A, Culmer, PR et al. (2 more authors) (2014) Technological
assessment of the biogalvanic method for tissue characterization. Physiological
Measurement, 35 (2). 297 - 308. ISSN 0967-3334
https://doi.org/10.1088/0967-3334/35/2/297
[email protected] https://eprints.whiterose.ac.uk/ Reuse
Unless indicated otherwise, fulltext items are protected by copyright with all rights reserved. The copyright exception in section 29 of the Copyright, Designs and Patents Act 1988 allows the making of a single copy solely for the purpose of non-commercial research or private study within the limits of fair dealing. The publisher or other rights-holder may allow further reproduction and re-use of this version - refer to the White Rose Research Online record for this item. Where records identify the publisher as the copyright holder, users can verify any specific terms of use on the publisher’s website.
Takedown
If you consider content in White Rose Research Online to be in breach of UK law, please notify us by
characterization
J H Chandler1, A Hood1, P R Culmer1, D Jayne2and A. Neville1
1
School of Mechanical Engineering, University of Leeds
2
Leeds Academic Surgical Unit, St. James’s University Hospital, Leeds
Email: [email protected]
Abstract. Biogalvanic cells have the potential to be used in characterising biological tissue properties and ultimately tissue health. A biogalvanic cell is established by placing two differing metal electrodes across a target tissue allowing an electrical tissue-specific internal resistance to be determined. A novel data analysis method using least-squares fitting has been developed to more effectively determine the parameters of the biogalvanic system model proposed in the literature. The validity of the method has been examined through characterisation of electrical models,ex vivoporcine tissue, andin vivoporcine tissue. Strong agreement between test results and the proposed characterisation model has been shown. However, determined internal resistances are influenced by mechanical strain, current modulation direction and tissue thickness, indicating complexities at the electrode-tissue interface. These complexities undermine some assumptions upon which the biogalvanic model is based. Ultimately this technique could offer potential for use in minimally invasive surgery for discriminating tissue health but requires improved understanding and control of testing conditions.
1. Introduction
Minimally invasive surgery is increasingly used in the treatment of cancer with proven benefits for patients and healthcare providers. The lack of tactile feedback in minimally invasive surgery has driven clinical demand for new instrumentation that provides surgeons with improved intraoperative information, particularly to assess and differentiate between tissue that is healthy and unhealthy. Current options are scarce and determination of adequacy of oncological resection is often made postoperatively. Considerable effort has been employed in order to deliver tissue-specific information to the surgeon. Sensing modalities look to exploit various underlying properties that pertain to tissue health. Alteration of tissue mechanical properties with pathology has been assessed intraoperatively through direct mechanical contact measurement (Zbyszewski et al., 2009, Noonan et al., 2007) and ultrasound based elastography techniques (Gao et al., 1996, Elias et al., 2011). Palmeri and Nightingale (2011) discuss some of the issues associated with elastography, with the challenges of applying repeatable physical stimulation and quantitatively interpreting data through a suitable mathematical model being shared throughout mechanical characterisation modalities.
electrical tissue properties (conductivity and permittivity), a bioimpedance measurement is typically conducted (Ivorra et al., 2009, Spottorno et al., 2008). A four-electrode cell is contacted with the tissue and alternating current applied through one electrode pair while the potential difference between the second electrode pair is measured (Martinsen and Grimnes, 2011). Magnitude and phase data are determined over a range of frequencies, and are typically fitted to a continuous electrical model; the Cole-Cole model is normally utilised for tissues (Cole and Cole, 1941). This simplifies the output metric allowing direct comparison between tissues, although relation of the model to physical properties is somewhat subjective (Martinsen and Grimnes, 2011). Frequency range and model selection are critically important for fast, reliable measurements, making bioimpedance spectroscopy a challenging technique to successfully implement.
As an alternative to bioimpedance, the flow characteristics of biogalvanic current have been proposed as a means to distinguish tissue type and health (Golberg et al., 2009, 2011). In this scenario tissue acts as a salt bridge between two dissimilar metal interfaces. The specific tissue (electrolyte)/electrode reactions determine the potential difference across the cell. Characterisation of the salt bridge (DC) resistance is possible through measurement of the combined system when current levels are modulated using external resistors. Golberg et al (2009)showed that Galvanic Apparent Internal Resistance ( ) gives significantly different results for tests on heart, lung and liver tissues from Sparge Dewery rats. Additional testing on in vivo rat liver tissue showed statistical significance between healthy and electroporated tissue, and showed similar trends to bioimpedance data obtained in parallel (Golberg et al., 2011). The apparent simplicity, relative to active frequency based techniques used in measurement of bioimpedance (Martinsen and Grimnes, 2011, Bayford and Tizzard, 2012), makes biogalvanic characterisation a promising technique for intra-operative tissue characterisation. However the validity of assumptions made regarding the tissue-electrode interface reactions and mechanical contact conditions require further assessment prior to its application in clinical tissue characterisation. This paper reports the findings from initial tests on electronic,ex vivo porcine tissue and in vivoporcine tissue models using the biogalvanic characterisation technique. A novel method of characterisation is presented and assessed and the initial assumptions made regarding the methodology are challenged in light of some experimental results.
2. Method
2.1. Biogalvanic system characterization
Characterisation of the internal resistance, as presented by Golberg et al (2009), makes use of a galvanic electrochemical cell acting as a non-ideal power source. That is one in which a fixed internal resistance is present within the power generating unit. Connecting suitable metal electrodes through a functioning salt bridge will generate a potential difference with magnitude and polarity depending on the specific metal/solution interface reactions. The Open Circuit Voltage ( ) is the potential difference measured between the galvanic electrode couple when no current flows; typically using a high impedance volt meter. The is sufficient in many cases to drive a measurable current when the cell is closed externally through a nominal resistance. The magnitude of current will show dependence on a combination of external and internal resistances and the electrode contact areas. By sequentially connecting the cell through a range of external resistances, Golberget al(2009) proposed that the Galvanic Apparent Internal Resistance ( ) can be determined as:
= (1)
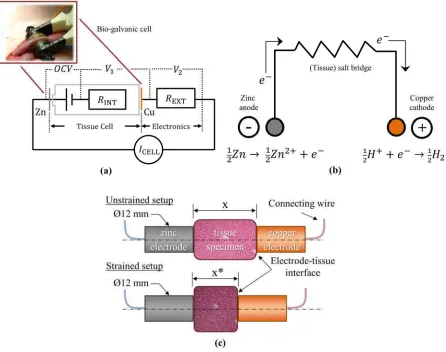
Where and represent the external and internal resistance respectively, is the current flow through the circuit and is a correction factor to allow for cell geometry. Assuming a fixed geometric arrangement, the determined value of may show specificity to differing cell media. Figure 1(a) shows an idealised electronic equivalent model of the galvanic cell arrangement under characterisation. The potential differences across the internal and external resistance are represented by and respectively.
Figure 1.(a) Proposed equivalent electrical model of the biogalvanic cell under characterisation, (b) specific galvanic cell generated in the zinc/copper system and (c) schematic of electrode arrangement for biogalvanic
tissue testing, where x and x* represent the unstrained and strained electrode separation respectively.
The zinc and copper electrodes employed produce an through two primary reactions; proposed by Golberget al(2009, 2011) as:
Giving the full cell reaction and galvanic potential difference under standard conditions of:
( ) (g) (3)
dissolution of the zinc electrode into zinc ions and the evolution of hydrogen at the copper electrode thus making the zinc and copper electrodes the anode and cathode respectively. The resulting galvanic cell is shown in figure 1(b), with the connecting salt bridge represented as an electrical resistance to the flow of current. Figure 1(c) shows schematically the test setup employed for connecting to and straining tissue specimen.
Using the model in figure 1(a) it is possible to derive many theoretically valid characterisation methods, including that proposed by Golberg et al (equation (1)) (2009) . In this case, a point wise characterisation based on the independent current flow at one external resistance value is employed. Internal resistance ( ) can be determined for any external resistance as long as the is known. In this paper, an alternative method has been developed to incorporate all data measured over the
range into a single value of . The developed model is described by equation (4), where represents the vector of measured ( ) voltages for the external resistor set ( ). A Levenburg-Marquardt (Moré, 1977) algorithm has been employed within LabVIEW (National Instruments Ltd., TX) to allow minimisation of the sum of squares ( ) determined by equation (4).
=
( ) (4)
( ) = [ ( , )] (5)
Where is the voltage measured across the external resistance and represents the vector length determined by the number of external resistors employed. The vector of model coefficients to be optimised is which in this case represents the and . A single value for each element of is determined for each dataset, thereby reducing the variability associated with a point-wise scheme. The flexibility to determine an effective value also removes the need for it to be measured directly under open cell conditions.
2.2. Electronic model validation
A custom circuit was produced to enable digitally controlled resistor switching between high precision fixed value resistors. The board was interfaced with data acquisition hardware (NI myDAQ, National Instruments Ltd., TX) and custom software (National Instruments Ltd., TX) allowing time coded measurement of and control of switching. Tests were conducted on an electronic model of the galvanic system where and were generated using a calibrated power supply and a fixed value resistor respectively. Series connection to the external resistor switching circuit completed the circuit. Characterisation using 15 resistor values ranging from ( ) were conducted. The switching rate for the external resistors was set to 0.05 Hz with sampled at 25 Hz. Voltage readings for each external resistor were averaged over 250 samples prior to resistor switching. Three systems were characterized with values of 1, 10 and 100 k at an of 0.5 V, representing parameter ranges typically seen in biological systems (Golberg et al., 2009, 2011).
2.3. Porcine tissue testing ex vivo
were conducted on thick liver (28.3 mm), thin liver (9.7 mm) and closed colon (9.1 mm) tissue under two mechanical strain conditions (0% nominal contact and ~50% strain). Repeat tests for each tissue type were conducted using the same tissue sample, taken from a single animal. The resistor switching rate was fixed at 0.2 Hz throughout and measurement points taken as an average over the last 10 samples prior to resistor switching. Each dataset was characterized using the electrical model (equation (3)).
2.4. Porcine tissue testing in vivo
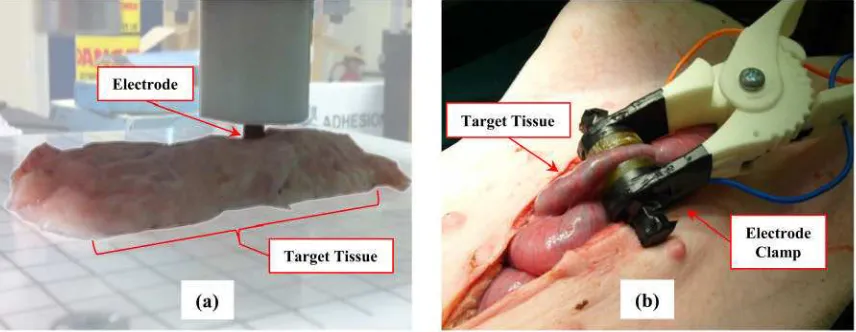
[image:6.595.84.512.392.558.2]Tests were conducted on a single anesthetised 30kg female white pig under UK Home Office regulations for animal experimentation. Access to the colon, rectum and liver was facilitated via a large abdominal incision (laparotomy). Test electrodes (12 mm Zn & Cu) were set in non-conducting resin, wet ground (1200 grit) and mounted in the jaws of a custom clip to provide fixed axial alignment (9.2 mm). Figure 2(b) shows the typical contact conditions obtained during the testing. Investigation was made into the influence of resistor switching direction i.e. the value of external resistance either increases or decreases during testing. Five resistor sweeps were made for increasing and decreasing resistor switching respectively at three different tissue locations (colon, rectum and liver). Resistor switching rate was fixed at 0.2 Hz and measurement points taken as the mean of the last 10 samples prior to resistor switching. Electrodes were rinsed with distilled water between each set of repeats. Influence of resistor switching direction on each tissue configuration was assessed using a two-tailed Student’s t-test. To determine if internal resistance or OCV are specific to tissue type a ranked statistical comparison (Kruskal-Wallis test) was conducted.
Figure 2.(a)Ex vivotesting on porcine colon tissue showing vertically applied tissue strain. (b)In vivoporcine testing showing electrode clamped onto the colon tissue during measurement.
3. Results
3.1. Electronic Model Characterisation
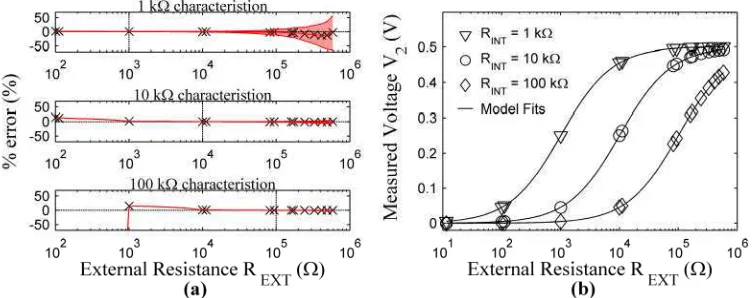
Figure 3(a) shows typical values obtained for the electronic systems as a function of the external resistor using the point-wise calculation (equation (1)). For these calculations the was input as that measured on the power supply as well as values ±1% of this, representing the influence of small variations in as seen in biogalvanic systems (Rao and Richter, 1974). Figure 3(b) shows typical characterisation using the proposed least-squares method.
increases linearly with increasing . For values smaller than , errors become large due to the resolution of the voltmeter. Variations in the used exaggerates these errors, making point-wise characterisation accurate only with values similar to the unknown internal resistance. Accurate measurement of prior to each characterisation is also required. Figure 3(b) shows that model fitting over the full range of external resistances generates a highly accurate fit to the measured data.
Figure 3.Results from characterisation of electronic model; = 0.5, = 1, 10 & 100 k (a) Error (%) in determined values using point-wise method, as a function of used in calculation; (x) represent determined using correct , error range from ±1% variation of correct shown. (b) Least-squares
[image:7.595.176.404.552.697.2]model fits for same electronic models; determined fit parameters for 1,10&100 k models were 1009±0.29 , 10.04±0.00 k and 100.2±0.64 k respectively (n=10). values of 0.501V were determined in all cases.
Figure 4 compares errors produced by point-wise and least squares characterisation of for the electronic systems tested. In contrast to the point-wise data, the errors associated with the least squares characterisation (equation (3)) are much lower, ranging from 0.9% to 0.19% with increasing . More significantly, the variation seen within repeats is negligible compared to the point-wise variation of ±5% (±1 standard deviation) across all test configurations. Improved characterisation accuracy and precision coupled with reduced sensitivity to external resistor range and indicate that the least squares fitting method (equation (3)) is more robust than the point-wise method. Subsequent characterisations reported here have therefore been carried out using this method.
3.2. Porcine tissue testing ex vivo
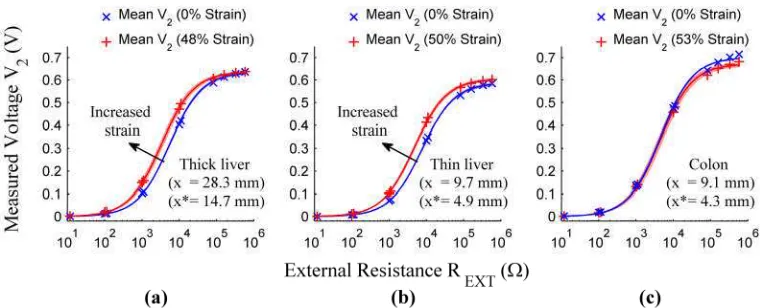
[image:8.595.107.478.358.517.2]Figure 5 shows the mean measured data points for each ex vivo test case, presented alongside the mean model fit. Figure 6 shows the distribution of characterized internal resistances and values for repeat tests of each tissue configuration. A two-tailed Student’s t-test with equal variance (n=5) was applied to the two strain cases for each tissue configuration.
Figure 5.Mean measured data and model fits for nominal and high strain for (a) ‘thick’ liver tissue, (b) ‘thin’ liver tissue and (c) closed colon tissue; shaded region representing 1 SD of mean (n=5). Repeat measurements
taken from a single tissue sample.
Figure 6.Box plots of characterized parameters fromex vivoporcine tests on single sections of liver and colon tissue with strain levels indicated; showing (a) determined internal resistance, and (b) . Potential line (red dashed) corresponding to standard conditions also shown. Levels of statistical significance between strain levels
(two-tailed Student’s t-test, equal variance (n=5)) are shown; statistical significance taken as p < 0.05.
the standard galvanic potential difference . The values show less variability during repeat testing when compared to internal resistance and have reduced sensitivity to mechanical strain conditions suggesting that it could be used as a robust discriminating parameter.
[image:9.595.100.486.209.365.2]3.3. Porcine tissue testing in vivo
Figure 7 shows the mean measured data and the mean model fit for each in vivotest case. The data spread is illustrated through the shaded region which represents the standard deviation produced by the characterisations. Figure 8 (a) and (b) show boxplots for the characterized internal resistance and
[image:9.595.108.478.427.585.2]respectively.
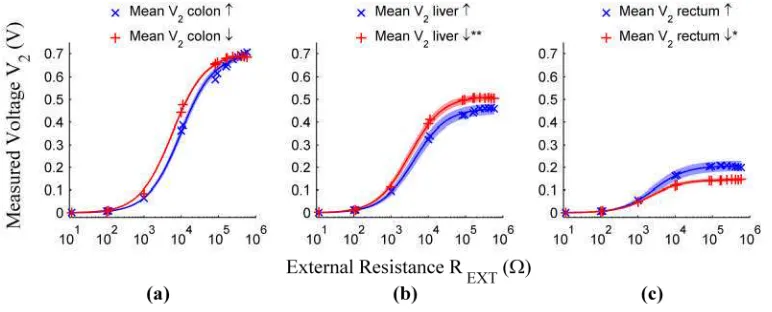
Figure 7.Average measured data and model fits for in vivo porcine tests with increasing ( ) and decreasing ( ) external resistor switching, on (a) colon, (b) liver, and (c) rectum; shaded regions represent ±1 SD of mean
(n=5). *(n=4), **(n=3).
Figure 8.Box plots of characterized parameters from in vivo porcine tests on colon, liver, and rectum tissue with increasing ( ) and decreasing ( ) external resistor switching; showing (a) determined internal resistance, and (b) , potential line (red dashed) corresponding to standard conditions also shown. Sample size (n) and statistical significance between resistor switching direction tests (two-tailed Student’s t-test, equal variance) are
shown.
levels prior to switching, thereby skewing the data away from a directionally independent steady state internal resistance. Time dependent behaviour of this nature is often associated with electrochemical interfaces (Bard and Faulkner, 2001) but may also be caused by tissue capacitance often noted during bio-impedance characterisation (Martinsen and Grimnes, 2011). Statistical analysis (Kruskal-Wallis test) shows internal resistance to be significantly different (p < 0.05) between tissue types.
Resistor switching direction shows no influence on for colon tissue. However, rectum and liver tissue values are significantly altered by the direction of external resistor switching. This is again attributed to the time dependent nature of the system during characterisation. It can be seen in figure 7 that the measured voltage values at high external resistor values (toward ) differ markedly between the three tissue types. In all cases the values are below the standard potential difference predicted by the proposed reaction. It can be inferred that ion concentrations are non-standard at the electrode-tissue interface with the possibility of a reaction different to equation (3) being present in some cases. This indicates that model fitting to this data with the assumed of equation (3) would be highly inappropriate and justifies the use of the proposed adaptive least-squares fitting method. Figure 8(b) shows comparatively the characterized for each test case. Statistical analysis (Kruskal-Wallis test) shows significant differences between tissue types (p < 0.05) for both characterized internal resistance and . This result is consistent for testing with either resistor switching direction, indicating that the technique is capable of distinguishing between tested tissue typesin vivo.
Direct comparisons cannot be made between ex vivo and in vivo results due to differences in test temperatures and mechanical contact conditions. However the characterized internal resistances all fall within the same order of magnitude and show similar levels of variation. The values forex vivotissues are similar, with colon tissue being marginally higher than liver tissue. However,in vivo tests show a more exaggerated difference between colon and liver tissue and a lower still for rectum tissue. This suggests that living tissue has a greater influence on the interface conditions within the galvanic cell and therefore the relative potentials between electrodes within an open cell.
4. Discussion
When characterising tissues in the manner proposed by Golberg et al (2009, 2011), a number of significant assumptions are made: (1) electrode potentials are stable and due only to proposed half-cell reactions of equation (3). (2) Tissue acts as an ideal salt bridge with a fixed value of resistance across a range of currents. (3) The electrode-tissue interface does not influence the measured internal resistance. (4) Internal resistance is specific to tissue type and health.
Measurements taken using electrical analogues (figure 3) show the efficacy of the test system and model. Highly accurate and repeatable predictions of the fixed resistance values are shown. When extended to tissue tests strong agreement is again seen over a wide current range for both ex vivoand in vivotests, indicating that assumption (2) appears valid. However, adjusting test conditions such as applying mechanical strain or altering external resistor switching direction shows significant influence on the determined internal resistance. This demonstrates that the determined resistance in each case is not purely as a result of a fixed tissue resistance but includes complex condition dependent behaviour. The hysteresis shown in figure 7, caused by external resistor switching direction, indicates inherent time-dependent system properties. This behaviour is typical of interface phenomena; charge/discharge of the electric double layer and diffusion of ions to/from the metal surface (Bard and Faulkner, 2001). This indicates that there is influence from the electrode-tissue interface and therefore assumption (3) is not valid under the cell arrangements tested. The possible interface behaviour discussed will contain associated time dependent resistive behaviour which may be captured within the determined internal resistance values.
The assumption of internal resistance being specific to tissue type is supported by the significant differences seen between tissue types tested in vivo. However, the determined value is greatly affected by adjustment to test conditions and is potentially contaminated by interface resistances. For internal resistance values to be directly compared, highly repeatable test conditions are required. In contrast the determined offers less sensitivity to test conditions, particularly mechanical strain, while maintaining specificity to tissue type. This parameter can be characterized using the proposed least-squares fitting method and may offer a simple measure for determining tissue type and health with or without internal resistance information.
5. Conclusions
The results presented indicate that modelling a galvanic tissue system as a fixed open circuit voltage and internal resistance in series corresponds well with measured data both ex vivo and in vivo. Through application of the proposed measurement technique and least-squares data fitting method, repeatable determination of these two parameters is possible. Results from porcine tissues ex vivo show that internal resistance is sensitive to the tissue type, thickness and mechanical strain conditions. In addition,in vivoresults also showed sensitivity of the determined internal resistance to the resistor switching direction. In combination these results indicate that the simplicity of the model proposed does not allow for complete capture of the tissue resistive properties. The variability found in the determined due to test conditions was found to be less than for . In addition, this parameter also shows specificity to tissue type and may be an appropriate parameter in determining tissue health.
True assessment of the biogalvanic technique is not possible without further understanding and control of the influencing parameters discussed. Variations of the electrochemical system, the mechanical strain conditions, external resistor control strategy and the chosen electrical model must all be considered for successful characterisation. By addressing these factors, biogalvanic measurements may show potential for intraoperative tissue assessment.
Acknowledgments
References
BARD, A. J. & FAULKNER, L. R. 2001.Electrochemical Methods: Fundamentals and Applications,New York, Wiley.
BAYFORD, R. & TIZZARD, A. 2012. Bioimpedance imaging: an overview of potential clinical applications.Analyst,137,4635-43.
COLE, K. S. & COLE, R. H. 1941. Dispersion and Absorption in Dielectrics I. Alternating Current Characteristics.The Journal of Chemical Physics,9,341-51.
ELIAS, J., MAUAD, F. M., MUGLIA, V. F., CAETANO, E., DOS SANTOS, J. S., KEMP, R., PAVAN, T. Z. & CARNEIRO, A. A. O. Year. Intraoperative application of real-time tissue elastography for the diagnosis and staging of pancreatic tumours.In: 2011 Pan American Health Care Exchanges (PAHCE), March 28 2011-April 1 2011 2011 Rio De Janeiro. 179-181.
GAO, L., PARKER, K. J., LERNER, R. M. & LEVINSON, S. F. 1996. Imaging of the elastic properties of tissue—A review.Ultrasound in Medicine & Biology,22,959-77.
GOLBERG, A., LAUFER, S., RABINOWITCH, H. D. & RUBINSKY, B. 2011. In vivo non-thermal irreversible electroporation impact on rat liver galvanic apparent internal resistance.Physics in Medicine and Biology,56,951-63.
GOLBERG, A., RABINOWITCH, H. D. & RUBINSKY, B. 2009. Galvanic apparent internal impedance: An intrinsic tissue property.Biochemical and Biophysical Research Communications, 389, 168-171.
IVORRA, A., AL-SAKERE, B., RUBINSKY, B. & MIR, L. M. 2009. In vivo electrical conductivity measurements during and after tumor electroporation: conductivity changes reflect the treatment outcome.Physics in Medicine and Biology,54,5949.
MARTINSEN, O. G. & GRIMNES, S. 2011.Bioimpedance and Bioelectricity Basics, Elsevier Science. MORÉ, J. 1977. The Levenberg-Marquardt algorithm: Implementation and theory.In:WATSON, G. A.
(ed.)Numerical Analysis.New York: Springer-Verlag.
NOONAN, D. P., LIU, H., ZWEIRI, Y. H., ALTHOEFER, K. A. & SENEVIRATNE, L. D. Year. A Dual-Function Wheeled Probe for Tissue Viscoelastic Property Identification during Minimally Invasive Surgery. In: Robotics and Automation, 2007 IEEE International Conference on, 10-14 April 2007 2007. 2629-2634.
PALMERI, M. L. & NIGHTINGALE, K. R. 2011. What challenges must be overcome before ultrasound elasticity imaging is ready for the clinic?Imaging in Medicine,3,433-444.
RAO, J. R. & RICHTER, G. 1974. Implantable bio-electrochemical power sources.
Naturwissenschaften,61,200-206.
SPOTTORNO, J., MULTIGNER, M., RIVERO, G., ÁLVAREZ, L., VENTA, J. D. L. & SANTOS, M. 2008. Time dependence of electrical bioimpedance on porcine liver and kidney under a 50 Hz ac current.
Physics in Medicine and Biology,53,1701.
WANG, J. 2007. Electrochemical Glucose Biosensors.Chemical Reviews,108,814-825.