Layer-by-Layer Assembly of Supported Lipid Bilayer Poly
‑
L
‑
Lysine
Multilayers
George R. Heath,
†Mengqiu Li,
†Isabelle L. Polignano,
‡Joanna L. Richens,
§Gianluca Catucci,
‡Paul O
’
Shea,
§Sheila J. Sadeghi,
‡Gianfranco Gilardi,
‡Julea N. Butt,
∥and Lars J. C. Jeuken
*
,††School of Biomedical Sciences, University of Leeds, Leeds LS2 9JT, United Kingdom ‡Life Sciences and Systems Biology, University of Torino, 10123, Turin, Italy
§Cell Biophysics Group, Institute of Biophysics, Imaging and Optical Science, School of Life Sciences, University of Nottingham,
Nottingham, NG7 2RD, United Kingdom
∥Centre for Molecular and Structural Biochemistry, School of Biological Sciences, and School of Chemistry, University of East Anglia,
Norwich NR4 7TJ, United Kingdom
*
S Supporting InformationABSTRACT: Multilayer lipid membranes perform many
important functions in biology, such as electrical isolation (myelination of axons), increased surface area for biocatalytic purposes (thylakoid grana and mitochondrial cristae), and sequential processing (golgi cisternae). Here we develop a simple layer-by-layer methodology to form lipid multilayers via vesicle rupture onto existing supported lipid bilayers (SLBs) using poly L-lysine (PLL) as an electrostatic polymer linker.
The assembly process was monitored at the macroscale by quartz crystal microbalance with dissipation (QCM-D) and the
nanoscale by atomic force microscopy (AFM) for up to six lipid bilayers. By varying buffer pH and PLL chain length, we show that longer chains (≥300 kDa) at pH 9.0 form thicker polymer supported multilayers, while at low pH and shorter length PLL, we create close packed layers (average lipid bilayers separations of 2.8 and 0.8 nm, respectively). Fluorescence recovery after photobleaching (FRAP) and AFM were used to show that the diffusion of lipid and three different membrane proteins in the multilayered membranes has little dependence on lipid stack number or separation between membranes. These approaches provide a straightforward route to creating the complex membrane structures that are found throughout nature, allowing possible applications in areas such as energy production and biosensing while developing our understanding of the biological processes at play.
■
INTRODUCTIONMultilayered lipid membrane assemblies are utilized throughout nature and are involved in a wide range of energy producing pathways, from the double membranes surrounding mitochon-dria and Gram-negative bacteria to the stacked thylakoid membranes of photosynthetic plant chloroplasts.1,2 The benefits of multiple membrane structures lie with the ability to amplify and compartmentalize single membrane functions in series. This presents significant technological potential for mimicking and harnessing a diverse range of energy production machinery. Such applications range from producing fuels from organic matter, to converting organic matter into electricity and exploiting photosynthesis for solar power. In addition to energy production it has been thought that multilayered membranes may allow serial coupling of membrane proteins that could lead to new applications in photonics, biosensing, and the 3D crystallization of membrane proteins.3,4 Accompanying the functionality, the multilayered structures also offer increased mechanical robustness, a trait that can hinder single membrane systems. For such applications, methodologies to create
multilayered membranes should be simple to construct, stable, and scalable.
The formation of double membranes has been previously demonstrated in a number of ways. The rupture of giant unilamellar vesicles (GUVs) onto existing solid-supported lipid bilayers (SLBs) was initially achieved through electrostatic interaction by fusing GUVs with opposing charged lipids.5 Control over the separation between the supported bilayer and ruptured GUV was then shown by Chung et al. utilizing DNA hybridization to link the two membranes.6DNA was also used in a separate approach in which cationic lipid bicells were fused to cationic SLBs by linking the two with DNA duplexes.7More recently, Minner et al. showed that multilayered membranes composed of up to four layers could be formed with GUVs via specific pegylated maleimide lipid to sulfhydryl linkages with 2−4 h incubation per layer.8 The conditions used to form
Received: October 27, 2015 Revised: December 2, 2015 Published: December 7, 2015
Article
pubs.acs.org/Biomac
GUVs, however, make the incorporation of functioning membrane proteins much more difficult than with proteolipo-somes. Hence approaches based on self-assembly from small vesicles provide a significant advance in the type of applications that multilayered bilayers can be used for. Han et al. used NHS/EDC lipid coupling chemistry to fuse vesicles to form a second bilayer.9 However, data suggested that the second bilayer was incomplete, and thus attempting to extend this to any further layers would carry and amplify these defects. Biotin−streptavidin coupling has also been used to form stable double bilayer systems while showing the incorporation of a transmembrane protein.10 Composite lipids multilayer stacks have also been created with silica templates11 and with graphene oxide.12
While practical for fundamental biophysical studies, these methods may require large amounts of preparation and, in some cases, several hours to form each additional layer as well as costly materials/chemistry. Here we describe a technique using polyL-lysine (PLL) as an electrostatic linking polymer
layer between membranes. PLL is a widely used biocompatible cationic polypeptide that has been intensively studied and broadly used in a wide range of applications, providing one of the most commonly used substrate coatings to allow cell adhesion.13 It has also been used as a key building block in many self-assembled systems such as numerous drug delivery vehicles,14−17 in the preparation of hydrogels for tissue engineering applications,18and for coating many materials for further surface modification.19 In most applications, the high positive charge of PLL is utilized to adhere subjects that carry a negative charge (e.g., cells or proteins) to negatively charged substrates (e.g., glass or SiO2). Following this route, we bind PLL to the surface of negatively charged SLBs to reverse the membrane surface charge and allow a second bilayer to be formed via vesicle fusion. Additional layers are built up in a simple layer-by-layer methodology with defined vesicle rupture signatures, which are visible via quartz crystal microbalance with dissipation (QCM-D) for up to six lipid bilayers. Atomic force microscopy (AFM) imaging is used to show the integrity of the bilayers at each stage of multilayer formation. While PLL typically adopts random coil conformations at physiological pH, at higher pH it is able to form rigid, rod-likeα-helical structures. Using this property and by varying the length of PLL used at pH 9.0 we create a polymer cushion mixed with stiffer alpha helices somewhat akin to actin cytoskeleton. AFM imaging, force spectroscopy, and QCM-D show how at this higher pH, separation between the membranes increases from 0.8 to 2.8 nm. Additionally, we perform fluorescence recovery after photobleaching (FRAP) experiments to investigate the diffusion of lipid and three different transmembrane proteins in the multilayered membranes.
■
EXPERIMENTAL SECTIONMaterials. If not otherwise stated, all chemicals were purchased from Sigma-Aldrich (Dorset, U.K.). 1,2- palmitoyl-2-oleoyl-sn
-glycero-3-phosphocholine (POPC), palmitoyl-2-oleoyl-sn
-glycero-3-phospho-glycerol (POPG),
palmitoyl-2-{6-[(7-nitro-2-1,3-benzoxadiazol-4-yl)-amino]hexanoyl}-sn-glycero-3-phosphocholine (NBD-C6) and
dio-leoyl-sn-glycero-3-phosphoethanolamine-N-(carboxyfluorescein)
(DOPE-CF) were obtained from Avanti Polar Lipids (Alabaster, AL). Di-8-butyl-amino-naphthyl-ethylene-pyridinium-propyl-sulfonate
(Di-8-ANEPPS, D3167) andfluorescein-phosphatidyl-ethanolamine (FPE,
F-362) were purchased from Life Technologies (Paisley, UK).
Ultrapure water (resistance 18.2 MΩ cm) from a Milli-Q system
was used throughout.
Multilayer Bilayer Formation. Formation at pH 5.5−7.0. To form the base bilayer, dried POPC/POPG (1:1) was hydrated in 5 mM MOPS at pH 7.0, then tip sonicated for 20 min, followed by benchtop centrifugation to remove titanium particles (5 min at 12000
rpm). The bilayer was then formed on mica, glass, or SiO2by adding
the POPC/POPG (1:1) vesicle solution at 0.5 mg/mL with 5 mM CaCl2at room temperature for 30 min. The bilayer was rinsed 5 times with 1 mM EDTA followed by at least 15 washes with 5 mM buffer at
pH 5.5 or pH 7.0. The buffer used for experiments at pH 5.5 was 5
mM Bis-Tris, while 5 mM MOPS was used for experiments at pH 7.0.
PLL was added to the base bilayer at 10μg/mL in the same buffer and
incubated for 40 min, followed by rinsing 20 times with buffer. To form the second bilayer, a POPC/POPG (3:1) vesicle solution (tip
sonicated as above) in buffer (without CaCl2) was added at 0.5 mg/
mL and left to incubate for 1 h followed by rinsing 20 times with
buffer. To form additional bilayers, the steps to form the second
bilayer were repeated, i.e., incubating PLL, followed by rinsing then incubating POPC/POPG (3:1) vesicle solution.
Formation at pH 9.0.The base bilayer was formed as for pH 5.5 and pH 7.0 but using 5 mM CHES pH 9.0 buffer. Ten micrograms per milliliter of PLL was added in 5 mM CHES at pH 9.0 and incubated on the base bilayer for 1 h followed by 10 rinses with 5 mM CHES (pH 9.0) and then 10 rinses with 5 mM Bis-Tris at pH 5.5. The second bilayer was formed by incubating a POPC/POPG (1:1) vesicle solution (tip sonicated) in pH 5.5 buffer (without CaCl2) at 0.5 mg/ mL for 1 h. The second bilayer was then rinsed 10 times with 5 mM Bis-Tris at pH 5.5 followed by 10 rinses with 5 mM CHES (pH 9.0). Additional bilayers were formed by repeating the PLL incubation followed rinsing followed by vesicle incubation as for the second bilayer. We note that attempts to form the second bilayer directly at pH 9.0 (rather than at low pH, followed by increasing the pH) were unsuccessful.
QCM-D.QCM-D measurements were performed using a QSense E4 multifrequency QCM-D instrument (Q-Sense, Gothenburg,
Sweden) in aflow through cell of 40μL volume. Data from 15, 25,
35, 45, 55, and 65 MHz overtones (3rd, 5th, 7th, 9th, 11th, and 13th, respectively) were collected. Before use, all SiO2crystals were cleaned by ultrasonication in 0.4% SDS for 15 min followed by copious rinsing and ultrasonication in water for 15 min. The crystals were then dried under nitrogen and UV-ozone cleaned for 20 min. After UV-ozone treatment, they were rinsed with water, dried under nitrogen, and used immediately. Initially, the system wasfilled with buffer such that the resonant frequencies of each overtone used could be found.
Experiments were performed at 22°C at flow rates of 70 μL/min.
Data was modeled using the QTools software (QSense AB,
Gothenberg, Sweden) with a Kelvin−Voigt model and a minimum
of three overtones.
Atomic Force Microscopy.AFM experiments were performed at
room temperature (22°C) in aqueous conditions using a Dimension
FastScan Bio (Bruker). Oxide-sharpened silicon nitride tips (Bruker) with typical spring constants of 0.7 N/m were used in either PeakForce tapping mode or tapping mode. All images were performed on mica substrates mounted on Teflon discs.
Fluorescence/FRAP. FRAP data was recorded using an
epi-fluorescence microscope (Nikon ECLIPSE Ti). The sample was
illuminated and bleached using a high-pressure mercury arc lamp. The
bleached spot had a diameter of 55μm viewed using a 40×objective
lens. After bleaching, a series of time-lapsefluorescence images were collected using a Zyla sCMOS 5.5 CCD camera (Andor Technology Ltd. Belfast, UK) with the aid of NIS elements software (Nikon, USA).
The Axelrod method was employed to calculate the diffusion
coefficient and the mobile fraction of the supported lipid bilayer.20 Phospholipid Vesicle Labeling with Fluorescent Probes (FPE and Di-8-ANEPPS).Lipid vesicles were labeled in the outer bilayer leaflet with FPE as previously described.21 Briefly, the vesicles were incubated with ethanolic-FPE (never more than 0.1% v/v ethanol) at
37°C for 1.5 h in the dark. Unincorporated FPE was removed by gel
filtration on a PD10 Sephadex column. For the labeling of phospholipid vesicles with Di-8-ANNEPS, the phospholipid vesicles
were incubated for at least 1 h at 37°C in the dark in the presence of
ethanolic-Di-8-ANNEPS (14.8μg/mL).
Fluorescence Spectroscopy.Fluorescence spectroscopy of lipid vesicles labeled with either FPE or Di-8-ANEPPS was conducted on a Fluoromax-4 Spectrofluorimeter (HORIBA Jobin Yvon). For FPE-based experiments, excitation and emission wavelengths were set at 490 and 518 nm, respectively. Di-8-ANEPPS spectra were obtained by exciting the samples at 468 and 520 nm and measuring the emission ratio at 580 nm.22,23 Fluorescence intensity was measured pre- and post-addition of appropriate concentrations of PLL to phospholipid vesicles (100μM lipid) at 25°C.
Protein Purification.MtrCAB was purified by minor modification of the previously published method.24Shewanella oneidensisMR-1 was grown microaerobically in LB media supplemented with lactate and Fe(III)citrate. Harvested cells were washed cells, resuspended in 20 mM HEPES pH 7.6, and broken using a continuous French Press (1000 Psi). Cell debris was removed by centrifugation at 12 000 rpm and the supernatant subject to ultracentrifugation at 42 000 rpm, 4°C for 2 h to pellet membrane vesicles. Vesicles were resuspended by
gentle overnight stirring at 4°C in 20 mM HEPES pH 7.6. Sarkosyl
(sodium lauroyl sarcosinate) was added to the resuspended
membranes to a final concentration of 2%, and the solution was
stirred for approximately 45 min at 4°C. Sarkosyl washed membranes
were recovered by ultracentrifugation at 42 000 rpm, 4°C for 2 h. The membrane pellet was resuspended by overnight stirring in 2% Triton
X-100, 20 mL HEPES pH 7.8, at 4°C. Insoluble material was removed
by 1 h ultracentrifugation at 42 000 rpm, 4 °C. The supernatant
containing soluble proteins was loaded onto a Q-sepharose column equilibrated with 2% Triton X-100, 20 mM HEPES pH 7.8. A NaCl gradient was applied to elute MtrCAB. Pooled fractions were concentrated prior to further resolution using HiLoad Superdex eluted with 2% Triton X-100, 20 mM HEPES, 150 mM NaCl pH 7.8. Purity of the purified MtrCAB was confirmed by SDS-PAGE with protein visualized by Coomassie and heme stain.
Human flavin-monooxygenase 3 (hFMO3) was expressed in
Escherichia coliJM109 cells and grown 24 h postinduction as described
previously.25 The protein was purified from the membrane fractions
via Ni affinity chromatography, as described.25 Spectra of the eluted
fractions (with 40 mM histidine) were recorded using a diode array HP-8453E spectrophotometer. FAD-containing fractions with charac-teristic absorption peaks at 375 and 442 nm were pooled and changed
to storage buffer (100 mM potassium phosphate buffer pH 7.4, 20%
glycerol, and 1 mM EDTA) and stored at−20°C.
Human cytochrome P450 (CYP2D6) was expressed in E. coli
DH5α cells transformed with pCW2D6 and grown 48 h
post-induction, as described previously.26The protein was purified from the
membrane fractions in the presence of 20μM quinidine via Ni affinity
chromatography. Spectra of the eluted fractions (with 40 mM histidine) were recorded using a diode array HP-8453E spectropho-tometer. CYP2D6-containing fractions were pooled and changed to
storage buffer (100 mM potassium phosphate buffer, pH 7.4, 20%
glycerol, 0.5 mMβ-mercaptoethanol, 1 mM EDTA, 20μM quinidine,
14 mM CHAPS) and stored at−20°C until use.
Fluorescent Labeling of Proteins. MtrCAB samples were
labeled with a Texas Red C2 maleimide fluorescent dye (Molecular
Probes). First, disulfide bonds in the protein were reduced using a 10-fold molar excess of a reducing agent tris(2-carboxyethyl)phosphine, hydrochloride (TCEP) for 1 h. The protein was labeled using 10-fold molar excess (dye to protein) for 1 h and unreacted label was removed
with a Zebra Desalt spin columns with a 7 kDa cutoff (Thermo
Scientific). The reduction of the disulfide and labeling reactions were both carried out in 20 mM HEPES pH 7.0 in an oxygen free environment at room temperature. hFMO3 and CYP2D6 samples were labeled withfluorescein fluorescent dye functionalized with N
-hydroxysuccinimide (NHS) active ester group (Thermo Scientific).
The labeling reaction was carried out at pH 8.3 for 1 h at room temperature to allow the nucleophilic attack of deprotonated primary amine groups coming from the N-terminus of the protein and surface-exposed lysine residues (of pKa< 8.3) on the NHS-ester of the dye. The protein was labeled using 5-fold molar excess of dye to protein,
and unreacted label was removed with Zebra Desalt spin columns with
a 7 kDa cutoff(Thermo Scientific).
Protein Reconstitution into Liposomes. Mixtures of 3:1 POPC/POPG were dried from a chloroform solution under nitrogen for 30 min at a total lipid mass of 5 mg. This was then further dried under vacuum for a minimum of 1 h. To reconstitute MtrCAB into vesicles, the lipid was resuspended in 45 mM octyl-β-D
-glucopyrano-side 20 mM MOPS, 30 mM Na2SO4pH 7.4; the solution should be
optically transparent upon vortexing. MtrCAB (labeled with Texas Red) was then added at 4% w/w to lipid mass. The resuspended solutions were then allowed to equilibrate at 4°C for 15 min. A rapid dilution was performed by pipetting the solution into Ti 45 centrifuge
tubes containing ∼50 mL 20 mM MOPS, 30 mM Na2SO4 pH 7.4
buffer such that the detergent was diluted below its critical micelle concentration. The rapidly diluted solution was then centrifuged (142 000g, 4°C, 1 h) to pellet the vesicles from the solution, using a Beckman Coulter L80-XP ultracentrifuge (Fullerton, CA) and a Ti45 rotor. The detergent-containing supernatant was then removed, and
the pellet was washed with a small amount of buffer. The pellet was
then resuspended to 1 mL by vortexing with 5 mM MOPS pH 7.0 buffer. hFMO3 and CYP2D6 proteins were reconstituted into liposomes using biobeads following a previously described protocol
by Reed et al.27Briefly, 3:1 POPC/POPG lipid solutions were
bath-sonicated until clarified in a 0.1 mL solution of a 250 mM MOPS pH
7.2 containing 75 mM MgCl2and 5% (w/v) cholate detergent. The
solubilized lipid solution was then mixed with a 0.4 mL solution containing the proteins at a 14.4% hFMO3 or 13.4% CYP2D6 w/w to
lipid ratio. The mixture was incubated at 4 °C for 1 h before the
addition 0.25 g of Bio-Beads SM-2. The sample was rocked for 2 h at 4
°C. The solution and a 0.4-mL volume wash of the beads with 50 mM
MOPS buffer (pH 7.25) was drawn up with a 32-gauge needle and
then filtered through a 5-μm syringe filter (GE Osmonics, Inc.,
Minnetonka, MN). The resuspended vesicle solutions containing either MtrCAB, hFMO3, or CYP2D6 were subsequently extruded using an Avanti Polar Lipids Mini Extruder (Alabaster, AL) through a 200 nm membrane. This step was to homogenize vesicle sizes from the
resuspended solution, aiding planar bilayer formation. UV−vis was
then used to measure the characteristic adsorption bands of each protein, allowing the determination of the protein concentration in the extruded proteoliposomes via the appropriate extinction
coeffi-cient.27,28 Furthermore, enzyme assays were used to confirm that
hFMO3 and CYP2D6 retained their enzymatic activity after reconstitution.27,29
■
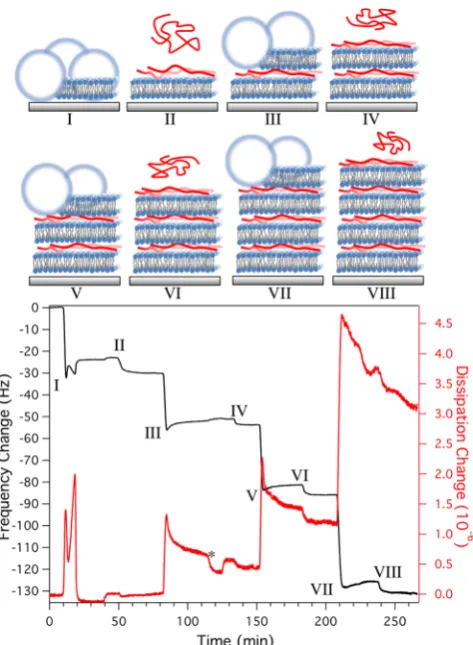
RESULTS AND DISCUSSIONAssembly of the PLL multilayered lipid bilayers is schematically shown inFigure 1(top). PLL is allowed to bind to a negatively charged “base” supported lipid bilayer (SLB) (POPC/POPG 1:1) until saturation. Excess PLL is then rinsed away, and a second membrane is formed on top via a solution of negatively charged vesicles (POPC/POPG 3:1). This process is then repeated for each additional layer: binding of PLL followed by rupturing vesicles in a layer-by-layer fashion. While the formation of the first “base” bilayer requires calcium in solution, all subsequent lipid bilayers do not, since they bind to the positively charged PLL layer.
To follow the binding of PLL and the formation of membranes, QCM-D was used, a tool that has proved to be fundamental in the understanding of how SLBs are formed.30,31
Figure 1 shows QCM-D data with illustrations depicting the stages of the lipid multilayer formation at pH 7.0 using PLL with molecular weights ranging between 70 and 150 kDa.
Figure 1(I) shows the formation of the 50% negatively charged POPC/POPG (1:1) base lipid bilayer in the presence of 5 mM CaCl2. The dissipation and frequency show a double peak
behavior, the first due to the vesicle binding followed by rupture. The second was caused by the adsorption of additional
vesicles onto the bilayer that were then rinsed when vesicles were removed from the solution.32,33After EDTA washing, the resulting bilayer had a frequency shift ofΔF=−24.3±0.5 Hz with dissipation ofΔD= (0.1 ± 0.1)×10−6, consistent with typical values for SLBs. InFigure 1(II), the PLL is added to the bilayer, resulting in a frequency shift of−6.5±0.2 Hz with no change in dissipation. Using the Sauerbrey equation converting the mass density to lysine per square nanometer, this frequency shift corresponds to a surface density of 3.6 lysine monomers/ nm2.34
Converting this to coverage using the 0.35 nm repeating distance per lysine residue35and 0.7 nm thickness observed by AFM gives an approximate PLL coverage of 87 ± 15% corresponding to a densely packed monolayer (most likely with some overlapping polymer). The lack of change in dissipation suggests that the PLL layer is packed very tightly to the bilayer with very little polymer extending into the solution.36 The density of lipids in POPC:POPG bilayers has been previously shown to be on the order of 1.7 lipids/nm2.37
With only 50% of the lipids charged, this leads to roughly four lysine charges per charged lipid. However, it should be noted that it has been previously shown that PLL can draw charged lipids to the
[image:4.625.62.299.65.388.2]proximal leaflet, inducing a bilayer asymmetry and therefore increasing the membrane surface charge.38 Overlooking any lipid redistribution, this still leaves a large excess positive charge on the PLL, free to bind the second membrane.
Figure 1(III) shows the addition of a POPC/POPG 3:1 lipid vesicle solution, resulting in a change in frequency of−21.0± 0.5 Hz (after washing). The dissipation change shows a sharp peak, characteristic of vesicles rupturing at a critical vesicle surface concentration.39,40It should be noted that vesicles were rinsed through the QCM-D cell for over 15 min before changing to buffer only, and thus the peak is not due to the change from vesicle solution to buffer. A water wash inFigure 1(*), with the aim of rupturing (by osmotic pressure) and/ removing bound vesicles (by increasing the Debye length of the vesicles and thus repulsion between vesicles), resulted in negligible change in frequency or dissipation compared to washing with buffer. However, when PLL was added to the second bilayer atFigure 1(IV), the dissipation decreases as does the frequency, suggesting that as the PLL binds,fluid is released from the multilayer. This behavior is even more pronounced when PLL is added to the third lipid bilayer (POPC/POPG 3:1) (Figure 1(VI)). These changes in dissipation are possibly either due to dehydration of the gap between membranes, decreasing the separation between the bilayers, or the further rupture of remaining nonruptured vesicles.12If the latter is true, this implies that PLL may not only be used to bind bilayers together but also as a fusogen to encourage the formation of a bilayer from negatively charged vesicles. Other fusogenic agents that have been shown to induce rupture and fusion include peptides41and, more recently, graphene oxide.12
The total dissipation change between the base bilayer with PLL and the second bilayer with PLL was 0.45×10⁻⁶, and this increased to steps of 0.75 and 1.9×10⁻⁶between layers for the third and fourth lipid bilayers, respectively. Increases in dissipation indicate viscoelastic behavior, which could be due to trappedfluid in the free space in the underlying PLL layers. The frequency changes for the third and fourth lipid bilayers composed of POPC/POPG 3:1 were −27 Hz and −39 Hz. The addition of PLL and lipid was continued for a total of six lipid bilayers, which continued to show an increased step change in dissipation and frequency with each layer (Supporting Figure S1). While the QCM-D data suggests new lipid bilayer formation after each addition of PLL and lipid vesicles, the increasing frequency and dissipation changes at higher multilayer numbers suggests that the viscoelasticity of the system increases more with each layer. Increased frequency and dissipation could be a sign of intact vesicles on the surface and, therefore, to further investigate the structures being formed, AFM was performed underfluid conditions to image the surface topography at each stage.
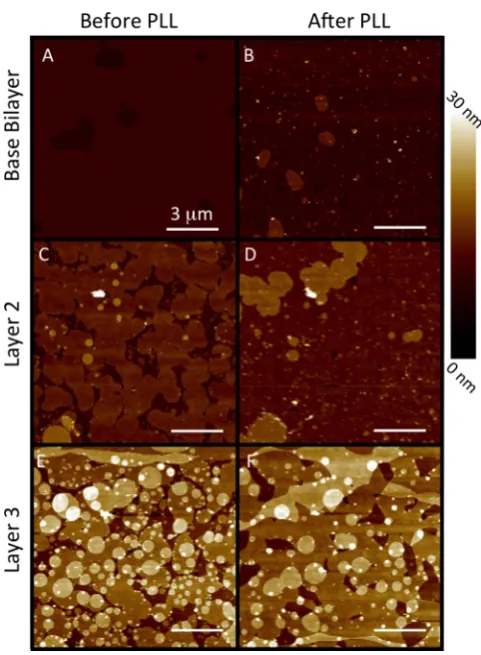
Figure 2A shows a POPC/POPG 1:1 base bilayer on mica with several defects giving a bilayer thickness of 5.3±0.3 nm. After the addition of PLL, the defects were observed to close up, and patches of a second lipid bilayer had already formed (Figure 2B). In addition to the small fraction of secondary membrane patches, a high coverage (60%) of domain like structures was observed with heights of 0.8±0.1 nm, a height that corresponds to the thickness of PLL observed on mica (Figure 4A). Imaging the same area immediately after the addition of POPC/POPG 3:1 vesicles, the base bilayer is covered with circular membrane patches, which slowly laterally fuse together over 30 min resulting in a coverage of 80±5% (Figure 2C andSupporting Video S1). The coverage is in close
Figure 1. QCM-D data showing the buildup of multilayered lipid bilayers and PLL starting from (I) the formation a POPC/POPG 1:1
bilayer from liposomes onto the silica surface (5 mM CaCl2, 5 mM
MOPS pH 7.0). After a change to 1 mM and another change back to 5
mM MOPS pH 7.0 buffer, (II) PLL (10 μg/mL) with molecular
weights of 70−150 kDa is added, additional injections of PLL are at (IV, VI, and VIII). Injections (III, V and VII) are of POPC/POPG 3:1 vesicles (5 mM MOPS pH 7.0). The additions of PLL and liposomes are preceded by rinses with 5 mM MOPS pH 7.0. A change from
buffer to water back to buffer is indicated by (*). QCM-D frequency
shift, ΔF, is shown by the black line (left axis), and the red line represents shifts in dissipation,ΔD(right axis).
agreement with the frequency shift observed in the QCM-D of 21 Hz corresponding to 86 ± 5% coverage. After a further incubation with PLL (Figure 2D), we observed the almost complete closing of these defects, leading to the second bilayer having a coverage of 95±3% and again some patches of extra (third) lipid bilayer. These AFM images indicate that the drop in dissipation observed with QCM-D upon PLL binding may not be due to vesicle rupture, but rather the electrostatic healing of membranes and the expulsion of water trapped in
defects. Incubating POPC/POPG 3:1 vesicles on the PLL-coated double bilayer (Figure 2E) led to a third bilayer with 84
[image:5.625.59.300.63.391.2]± 3% coverage with a large amount of fourth layer circular membrane patches. After further addition of PLL, the third bilayer had a coverage of 90±4% of which 44% had fourth-layer bifourth-layers and 6% hadfifth-layer bilayers (Figure 2F). This increase in membrane adsorption with each layer was also observed with the QCM-D. The cause of these unintentional extra membrane layers is unknown; however, it appears the continuous AFM imaging in the same area encourages additional membrane layers, since changing to a different area on the sample showed fewer additional stacks (Supporting Figure S2).
Varying pH and Chain Length.While the experiments in
Figure 1 and Figure 2 were performed at pH 7.0 using PLL with a molecular mass in the range of 70−150 kDa (as determined by the manufacturers by viscosity measurements), PLL is also readily available in larger and smaller chains and is known to change conformations to α-helical at higher pH. Thus, we repeated QCM-D experiments at higher and lower pH levels using PLL with weights of 1−5 kDa (PLL1−5k) and
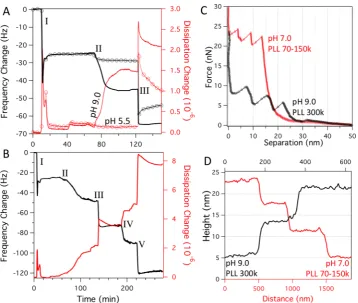
≤300 kDa (PLL300k), giving chains ranging from∼6 to over 1900 lysine residues. Table 1 shows QCM-D data of PLL adsorption (and subsequent second bilayer) to POPC/POPG 1:1 bilayers for pH 5.5, 7.0, and 9.0 and for three different PLL lengths. At pH 5.5, PLL adsorption is generally at its lowest corresponding to 55−85% monolayer coverage across all 3 PLL lengths. This reduced surface packing is most likely due to the increase in positive charge of PLL at lower pH. As the surface concentration of PLL on the bilayer increases over time (during incubation with PLL), the bilayer will become saturated with positive charge and therefore prevent the further binding of PLL, preventing overlapping or dense packing. Additionally, the increased charge on PLL will increase its persistence length, which can further reduce polymer packing.
The addition of POPC/POPG 3:1 vesicles at pH 5.5 to these layers showed the greatest frequency changes with values in agreement for a complete single lipid bilayer.Figure 3A displays the QCM-D response for the PLL 1−5k at pH 5.5. After the addition of vesicles to the base bilayer-PLL layer, the dissipation is observed to sharply peak, indicating rapid vesicle rupture at a critical surface concentration.
At pH 7.0, PLL adsorption is slightly greater for PLL70− 150k and PLL300k compared to at pH 5.5 but remains within the range for dense monolayer coverage. However, PLL1−5k increased to 5.2 ± 1.7 lysine monomers/nm2, giving a layer thicker than a monolayer. PLL1−5k has approximately 6−32 residues, corresponding to lengths ranging between 2 and 11 nm (assuming 0.35 nm distance between each residue).35With
Figure 2.AFM images of the same region showing each stage of the
formation of a triple lipid bilayer using PLL70−150k in 5 mM MOPS
pH 7.0 buffer. (A) Image of the POPC/POPG 1:1 base bilayer on
mica with a number of defects. (B) Resulting bilayer after 30 min
incubation with PLL70−150k. (C) After 30 min incubation with
[image:5.625.58.567.644.714.2]POPC/POPG 3:1 vesicles, the second bilayer has a large number of defects that close after further incubation with PLL (D). (E) Same region after incubation with POPC/POPG 3:1 vesicles to create a third bilayer followed by further incubation with PLL (F). All scale bars are 3μm with azscale of 30 nm set relative to the mica substrate.
Table 1. Adsorbed Mass of Various PLL Lengths on POPC/POPG 1:1 Bilayers under Different pH Buffer Conditionsa
PLL1−5k PLL70−150k PLL300k
lysine monomers per
nm2 second lipidΔF(Hz) lysine monomers pernm2 second lipidΔF(Hz) lysine monomers pernm2 second lipidΔF(Hz)
pH 5.5 1.9±0.4 23.5±0.5 3.0±0.5 27±1 1.9±0.4 28±1 pH 7.0 5.2±1.7 20±1 3.6±0.7 21.0±0.6 2.8±0.7 19±2 pH 9.0 2.7±0.7 1±1b 6.2±0.5 24±1b 12.0±1.1 22±2b
aAlso shown is the frequency shift after the addition of vesicles to these PLL layers under the same pH conditions. For pH 5.5 and 7.0 POPC/POPG
3:1 vesicles were added in the respective pH conditions. Data was obtained by QCM-D, converted to mass density via the Sauerbrey equation, and
then to lysine monomers per nm2 using the mass per PLL residue.34Errors values (SE) are obtained from repeat experiments.bValues are for
POPC/POPG 1:1 vesicles added at pH 5.5.
the polymer length being similar to its expected persistence length (∼4 nm)42it is possible that at pH 7.0 the interaction with the bilayer permits a more extended brush like conformation on the surface. Using a density of 1.2 g/m3(ref
43) and converting the surface mass to a thickness gives a value of 1.4 nm. The formation of the second bilayer at pH 7.0 showed no noticeable dependence on PLL with frequency shifts of−20 ±1 Hz across all PLL lengths.
At pH 9.0, the magnitude of PLL adsorption was strongly dependent on PLL length, greatly increasing to 12.0 ± 1.1 lysines per nm2 for PLL300k (Table 1 and Figure 3A). The QCM-D data (Figure 3A) shows that in addition to the frequency change due to the adsorption of PLL300k at pH 9.0, there is a relatively large increase in dissipation to 1.5×10⁻⁶, indicating a swollen and viscous PLLfilm due to a greater water content associated with the surface.44To form a second lipid bilayer, the POPC/POPG (3:1) vesicles had to be added at pH 5.5, as vesicles additions at higher pH values showed no response by QCM-D. Seemingly, at higher pH, the charge on the PLL is not sufficient to counter the charge of the base SLB. As shown in Table 1, no bilayer formation was observed on PLL1−5k layers formed at pH 9.0. This is most likely due to there not being enough free charges on the adsorbed PLL layer. InFigure 3A(III), the introduction of pH 5.5 vesicles produced a frequency shift of −20.1 ± 0.5 Hz and a sharp peak in dissipation, which rapidly decreased. It should be noted that the buffer was changed from pH 9.0 to pH 5.5 10 min before the vesicle addition, with the PLL layer showing negligible changes
in conformation/organization. Increasing the amount of charged lipid in the second layer lipid mixture to 50% showed an increase in the frequency shift of−24.5 ± 0.5 Hz (Figure 3B(III)) implying that a more complete bilayer was formed. Additionally, the third lipid bilayer was formed with a frequency shift of 27.3± 0.4 Hz. While the POPC/POPG 3:1 vesicles previously showed a peak in dissipation, the dissipation behavior after addition of POPC/POPG 1:1 did not, implying that the vesicles of higher charge directly rupture on the PLL layer rather than rupturing at a critical surface concentration.
[image:6.625.134.493.65.368.2]Assuming a random coil chain, the frequency shift observed due to PLL300k adsorption at pH 9.0 corresponds to over three layers of PLL. However, PLL is well known to change to a right-handed helical conformation in aqueous solution at more alkaline pH because of the decrease of electrostatic repulsion between amino side chains, where the side chains are oriented outward from the helical peptide chain.45,46AFM imaging of PLL300k adsorbed at pH 9.0 to POPC/POPC 1:1 bilayers shows the arrangement of these α-helices (Figure 4B) in contrast to the random coil conformation, which could be observed when binding PLL to mica at pH 7.0 (Figure 4A). We note that individual PLL peptides in the random coil conformation on lipid bilayers could not be observed with AFM, most likely because the high coverage of PLL, the diffusion of the random coil peptides, and soft interface of the lipid bilayer make the imaging of such small structures impossible. The heights of the α-helical structures are 2.8 ± 0.2 nm, in reasonable agreement with previous AFM reports of
Figure 3.(A) QCM-D data showing the buildup of double lipid bilayers for PLL1−5k and PLL300k. After (I) the formation of a POPC/POPG 1:1 base bilayer from liposomes, (II) PLL300k is added at pH 9.0 (solid line) and PLL1−5k at pH 5.5 (⊖). After rinsing both in pH 5.5 buffer, (III) POPC/POPG 3:1 vesicles were added to both to form a second bilayer. (B) QCM-D data showing the buildup of alternating layers of POPC/POPG 1:1 in 5 mM Tris-HCl pH 5.5 (III and V) and PLL300k in pH 9.0 buffer (II and IV). Before each addition of PLL or lipid, the surfaces were rinsed with buffer and equilibrated in the appropriate buffer. (C) AFM force spectroscopy measurements and (D) AFM height profiles across defects of
PLL300k at pH 9.0 (black line) and PLL70−150k pH 7.0 (red line) lipid bilayer multilayers.
PLL on mica.47Measurements of the lateral thicknesses of the
filaments give values ranging from 10 to 50 nm, suggesting that many of them are in bundles, which is further evident from the large number of helices branching away from the larger bundles. From a biomimetic perspective, these structures could be seen to resemble an actin cytoskeleton found at the cell membrane and at model supported membranes.48,49 The average length of each repeating unit per residue is 0.15 nm for the α-helical chain.35 Therefore, a 300 kDa PLL chain, which has approximately 1900 residues, will have a total length of 210 nm in theα-helical conformation (495 nm in random-coiled chain conformation). The lengths of the α-helices as analyzed from several AFM image gave a wide length
distribution, peaking at 230±130 nm (σ), in close agreement with the predicted value based on 0.15 nm/residue.
The coverage of α-helical filaments (based on the number per unit area and their length) can be converted to an approximate mass per unit area. This value, however, is 20-fold less than the total PLL adsorption measured by QCM-D under the same conditions. This, in addition to the QCM-D dissipation increase observed when binding PLL at pH 9.0, both suggests that only a fraction of the PLL is in aα-helical conformation with possibly much of the PLL in a compact globular shape with larger radius of gyration and much more associatedfluid.
[image:7.625.66.293.65.470.2]These results show that, while reducing pH to 5.5 improves bilayer formation, the main differences infilm thickness occur at higher pH with longer PLL chain lengths. Figure 3D compares AFM height profiles across multilayered membrane defects in the pH 9.0 PLL300k and the pH 7.0 PLL70−150k systems. It clearly shows that two lipid bilayers with pH 9.0 PLL300k is of similar thickness to three lipid bilayers with pH 7.0 PLL70−150k. Removing the thickness of the first “base” bilayer of 5.3±0.3 nm (measured base bilayer thickness) gives PLL thicknesses of 0.7±0.3 nm and 2.5±0.4 nm for the pH 7.0 PLL70−150k and pH 9.0 PLL300k systems, respectively. Force spectroscopy measurements (Figure 3C) using a sharp tip also show large differences in the thicknesses of these two systems. In this case, as the tip approaches a triple bilayer, it begins to deflect as force is applied to the sample. Rupture events then occur, creating a step in separation and a reduction in force as the tip punctures one bilayer. The example force curves in Figure 3C show the consecutive rupture of three bilayers creating three steps of similar separation. Removing the thickness of the bilayer (as measured by the height profile,
Figure 3D) from the total thickness determined by force spectroscopy (Figure 3C) gives PLL thicknesses of 1.2± 0.3 nm and 5.5±0.4 nm for the pH 7.0 PLL70−150k and pH 9.0 PLL300k systems, respectively.
In conclusion, all three measurement methods (QCM-D, height profiles, and force spectrscopy) indicate an increased membrane separation when PLL is added at pH 9.0, although this height is significantly higher when measured with force spectroscopy. Furthermore, the thicknesses reported inFigure 4C agree with those measured by AFM of individual PLL polymers in the random coil andα-helix confirmations (Figure 4A andFigure 4B).
Membrane Dipole and Surface Potential Measure-ments.To further understand the electrostatic nature of the lipid−PLL interactions and to examine any structural changes due to such interactions, thefluorescent membrane probes FPE (sensitive to electrostatic membrane potential21,50) and Di-8-ANEPPS (sensitive to membrane dipole potential51) were used in 1:1 POPC/POPG lipid vesicles. Binding experiments showed serial increases in FPE fluorescence intensity upon additions of PLL, indicative of large increases in positive charge at the membrane surface (Figure S3). As might be predicted due to the nature of electrostatic interactions, vesicle aggregation was observed at higher PLL concentrations. While such behavior is avoided when working with the supported bilayer system, the binding data (Figure S3(B)) shows that the working concentration of 10 μg/mL (used in lipid multilayer preparations) is close to binding saturation. Studies of PLL binding to vesicles containing Di-8-ANEPPS (Figure S4) showed small changes in the fluorescence excitation spectrum ratio for the longer chain PLL (300k and
Figure 4.(A) AFM image of random coil PLL (mol wt 70−150 kDa) at pH 7.0 bound to mica at low concentrations (z-scale = 1.2 nm). (B)
AFM image ofα-helix PLL (mol wt≥300 kDa) at pH 9.0 bound to a
POPC/POPG 1:1 supported lipid bilayer (z-scale = 7.6 nm). AFM
images have corresponding schematics of the two main regimes of PLL
lipid multilayer. (C) Comparison between bilayer−PLL composites
obtained via QCM-D, AFM force spectroscopy, and AFM height
profiles for PLL300k at pH 9.0, PLL 70−150k at pH 7.0, PLL1−5k at
pH 5.5, and the base bilayer only. QCM-D heights were converted from frequency shift to mass surface density via the Sauerbrey equation and then to heights using densities of 1 g/m3and 1.2 g/m3 for the lipid and PLL layers, respectively.
70−150k). Changes after the addition of the short chain PLL1−5k were negligible. These chain length-dependent changes in the membrane dipole potential are most likely due to slight reorganization of the membrane lipids into domains, a phenomenon previously observed in a number of studies.52,53 These fluorescence spectroscopy studies confirm that PLL reduces the membrane surface potential without insertion or damage to the membrane.
Lipid Diffusion Properties. For model membranes to be adequate mimics of biological membranes, lipids should be able to diffuse freely. Lipid mobility was determined using FRAP of lipid multilayers constructed under varying pH levels, for different PLL lengths. FRAP measurements of the base bilayer (POPC/POPG 1:1, 1% DOPE-CF) gave diffusion constant (D) values ranging from 0.5 to 0.8 μm2/s, in agreement with previous FRAP measurements of SLBs.54 Incubation of PLL300k at pH 9.0 with the base bilayer (Figure 5A, 5B), without the further addition of lipid, created patches of double membrane in agreement with AFM imaging (Figure 2B). Similarly, double membrane patches were observed after incubating the SLB with PLL1−5k at pH 5.5 (Figure 5C), although the patches are larger and sparser. The incubation of PLL on the base bilayer appears to cause no noticeable change (within error) on either the diffusion constant or the mobile fraction (Figure 5F).
To obtain diffusion constants of the second lipid bilayer in a double bilayer construct, fluorescently labeled lipid was excluded from the base bilayer and only included in the second bilayer. Similarly, to measureD of a third bilayer, no
fluorescent lipid was included in the first two lipid bilayers.
Figure 5D shows a series of images of the third bilayer (POPC/ POPG 3:1, 1% DOPE-CF) using PLL70−150k (in 5 mM MOPS, pH 7.0). After bleaching the central region (55 μm diameter), a large fraction was observed to recover within 15 min, with an almost complete recovery after 90 min (see
Supporting Figure S5 for normalized intensity over time).
Figure 5E shows the same experiment conducted after formation of an additional PLL70−150k layer on top of the third bilayer. While we observed the appearance of additional membrane patches, there was only a slight decrease inDand a small increase in mobile fraction. However, these changes were within experimental error.
Figure 5F compares the differences in diffusion coefficient and mobile fraction across all three systems tested (PLL1−5k pH 5.5, PLL70−150k pH 7.0, and PLL300k pH 9.0). For the PLL70−150k pH 7.0 system, Ddecreases at each layer of the multilayer build up. DOPE-CF has thefluorescent dye labeled to the lipid headgroup, and it is possible the decrease in diffusion is due to a “drag” effect by PLL. To test for this possibility, a lipid with dye in the hydrophobic region of the bilayer (NBD-C6) was used.Figure S6shows that addition of PLL to either the base bilayer or second bilayer also decreases the diffusion constant of NBD-C6. This suggest the decrease in diffusion constant is not due to a direct interaction between the label and PLL, but instead due to a general decrease in diffusion of the lipids, possibly because of the electrostatic interaction between the negatively charged lipids and the PLL.
For the short-chain PLL system (PLL1−5k) at pH 5.5, diffusion generally increased after PLL incubation for the base, second, and third bilayers (Figure 5F). As PLL1−5k is shorter, it is possibly more mobile and therefore less likely to reduce diffusion of the lipids. The unexpected slight increase inDafter PLL1−5k absorption could be due to the healing effect of PLL we observed by AFM (Figure 2) reducing the number defects which hinder diffusion (on the scale probed by FRAP).9
The PLL300k pH 9.0 showed relatively stable diffusion in all three bilayers. However, the mobile fraction showed a general decreasing trend with increasing layer build up, which could be due to theα-helical PLL caging diffusion in a similar fashion to the actin cytoskeleton, as previously reported.55
In spite of the trends just discussed, it is important to note that the variations between the PLL systems are relatively small.
Figure 5.Fluorescence data characterizing the lipid diffusion behavior in PLL-multilayer membranes. Fluorescence images of POPC/POPG 1:1 (1%
DOPE-CF) bilayers on glass before (A) and after incubation with PLL300k at pH 9.0 (B) and PLL1−5k at pH 5.5 (C). Image series (D,E) show the
recovery of a photobleached area of a triple bilayer created with PLL70−150k at pH 7.0 before and after an additional incubation with PLL70−150k, respectively (1% DOPE-CF was only included in the third lipid layer). (F) Combined bar chart of lipid diffusion coefficient and line plot of mobile
fraction for PLL70−150k at pH 7.0, PLL1−5k at pH 5.5 and PLL300k at pH 9.0 for each stage of formation of a triple bilayer. Allfluorescence
images are 150×150μm.
In general, the diffusion constants obtained across the different layers are in agreement with previous work on single lipid membranes bound to polyelectrolyte multilayers, which found values of≤0.35μm2/s.56
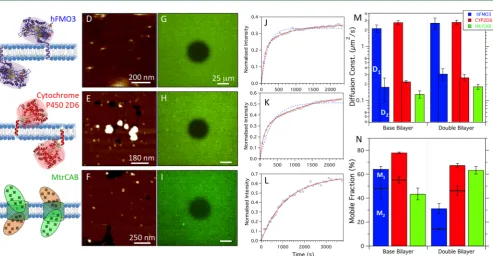
Transmembrane Protein Incorporation. To study fundamental biological interactions and for future potential technological applications in multiple membrane systems, the ability to incorporate membrane proteins is vital. Thus, we followed the same method used to form PLL70−150k pH 7.0 double membranes, but formed the second lipid bilayer with proteoliposomes (POPC/POPG 3:1) containing a trans-membrane protein. In total, three trans-membrane proteins were investigated: two different drug-metabolizing mono-oxygenases, human flavin-containing monooxygenase 3 (hFMO3),57 and cytochrome P450 2D6 (CYP2D6).58The third protein studied was the heterotrimeric outer membrane protein complex MtrCAB,59 which plays a central role in the metal reducing ability ofS. oneidensisMR-1. UV−vis spectroscopy was used to quantify the reconstitution yield of these proteins into 3:1 POPC/POPG vesicles and to confirm their integrity.27−29 As shown in Figures S7 and S8, we typically obtained a 1−2% protein to lipid ratio (w/w). Figure 6A−C shows model structures of each protein and the conformations they adapt in lipid membranes. For each protein, AFM images were obtained of the base bilayer (1:1 POPC/POPG) before incubation with PLL 70−150k and subsequent secondary bilayer formation with proteoliposomes. AFM images showed almost complete second bilayer coverage with many small protrusions corresponding to extra-membranous regions of the proteins (Figure 6D−F). The average heights of the protrusions in the
hFMO3 system were 2.5±0.3 nm, which is 1 nm less than the smallest expected dimension. The heights of CYP2D6 and MtrCAB were 3.7 ± 0.1 and 3.7 ± 0.2 nm respectively, in reasonable agreement with current structures of the proteins.
By labeling each protein with afluorescent dye, the diffusion properties were investigatedfirst in a single base bilayer alone and then in the second bilayer of a double membrane.Figure 6G−I shows double bilayers containing each labeled protein in the second bilayer immediately after bleaching a central region. After 30 min, the bleached area of the hFMO3 proteins recovered to almost its maximum at roughly a third of its initial intensity (Figure 6J), showing that less than half of the proteins appear to be mobile in a double bilayer. Over the same period of time, the recovery of CYP2D6 proteins was much greater, at over 50% (Figure 6K), while MtrCAB recovery was up to 60% (Figure 6L). The recovery data of the MtrCAB protein shows a very good fit to a single exponential from which a single diffusion constant and single mobile fraction can be derived. The hFMO3 and CYP2D6 proteins, however, do notfit so well to a single exponential and require a double exponential (eq 1).
= − − · + − − ·
I t( ) M1(1 exp( d t1 )) M2(1 exp( d t2 )) (1)
whereM1andM2are the component mobile fractions, andd1
and d2 are time constants from which the corresponding
[image:9.625.70.564.59.315.2]diffusion constants are calculated. This double exponential behavior has been previously observed in polymer supported membranes60,61 and supported membranes upon binding of proteins.62 Fitting to the double exponential to hFMO3 and CYP2D6 data gave two distinct components, suggesting the proteins have two separate diffusion constants. This behavior
Figure 6.Properties of single base bilayers and PLL 70−150k pH 7.0 double lipid bilayers containing three different transmembrane proteins. (A− C) Schematics showing the model structures and expected assemblies of human FMO3, Cytochrome P450 2D6, and MtrCAB, respectively. The three protein double-bilayer assemblies were investigated using AFM (D−F) andfluorescence microscopy (G−I) by labeling proteins with Texas red
(MtrCAB) andfluorescein (hFMO3 and CYP2D6) dyes. Plots (J−L) showfluorescence recovery after bleaching for the three proteins in double
bilayers withfits to single (blue dashed line) and double (red solid line) exponentials. Bar charts of protein diffusion constant (M) and mobile
fraction (N) for hFMO3, CYP2D6 and MtrCAB in a base bilayer only (3:1 POPC/POPG) and in the second bilayer of a double bilayer (1:1
POPC/POPG base, 3:1 POPC/POPG 2nd). Bars for hFMO3 and CYP2D6 were obtained via double exponential fits, the faster diffusion
component values D1in (M) correspond to the component mobile fractions M1(top stack bar) in (N). Bars for MtrCAB show values obtained via
single exponentialfits.
presumably arises due to the two possible orientations of the protein, i.e., with the extra-membranous region either at the top or the bottom of the bilayer. Figure 6M compares averaged diffusion constants of each protein in a single solid supported bilayer (base) and, separately, in the second bilayer of a double membrane system. The values obtained in Figure 6M were found by fitting to single exponential for MtrCAB or double exponentials (D1and D2) for hFMO3 and CYP2D6. Similarly, values for the mobile fractions were obtained from the samefits to single and double exponentials (M1and M2) (Figure 6N).
hFMO3 shows a very similar diffusion behavior in the SLB and in the second bilayer of our double bilayer. However, M2, which
represents the fraction of the slower component, is greatly reduced from 48±1% in the SLB to 14± 1% in the second bilayer. The diffusion behavior of the CYP2D6 protein was similar to that of hFMO3, although the reduction in M2is not
as great. Fitting the recovery data of MtrCAB diffusion to double exponentials produced component values that closely agreed with each other and with values obtained via single exponential fits. To minimize fitting errors, values for the diffusion constant and mobile fractions were taken from the single exponentialfits. In the base bilayer, 44±4% of MtrCAB had a diffusion constant of 0.13 ± 0.02 μm2/s; these values increased to 63± 3% having an average diffusion constant of 0.18±0.02μm2/s.
The large differences between the two diffusion components (D1 vs D2) for the hFMO3 and CYP2D6 suggest the single extra membranous region is either at the bottom of the lipid bilayer, interacting with the PLL-lipid bilayer/glass substrate (slow component), or at the top of the bilayer and free to diffuse (faster component). MtrCAB has similar extra membranous regions; however, they protrude out both sides of the membrane and thus its orientation appears to have little influence on its diffusion. Comparing the slower diffusion constant components of hFMO3 and CYP2D6 with that of MtrCAB shows close agreement between all three, suggesting all extra-membranous regions (which are of similar sizes) are affected by the supporting glass or PLL in similar manners. The large reduction in slower mobile fraction (M2) in the second
bilayer data for hFMO3, however, implies there may be a strong interaction between the hFMO3 protein and the underlying PLL layer causing an additional immobilization of
∼34% of the protein.
Diffusion of a transmembrane protein, syntaxin-1A, in streptavidin-suspended double membranes has been previously studied by Murray et al.10 The study showed much lower mobile fractions (∼10%) with diffusion constants of 0.03 and 0.25μm2/s. This low mobile fraction was thought to be caused
by syntaxin becoming confined between streptavidin molecules. Similarly, diffusion of Cytochrome b5 in polymer-supported single membranes has showed that approximately 25% of cytochromeb5diffused with ∼1μm2/s, and 50−60% diffused with a diffusion coefficient of∼0.02μm2/s.60
A model for the viscous drag of the polymer layer interacting with the proteins was shown to account for the reduction in diffusion. Here, we propose that PLL imposes a similar viscous drag effect on the diffusing protein and potentially may electrostatically trap some proteins such as the hFMO3. A recent study by Pace et al.63has further studied orientation-dependent diffusion properties of a transmembrane protein in polyethylene (PEG)-supported or glass-only SLBs. By only labeling either the ectoplasmic or cytoplasmic regions of a protein that has a similar structure to that of hFMO3 and CYP2D6, the study showed protein
diffusion (0.17μm2/s) was unaffected by the support (glass or
PEG) when the extra-membranous domain was at the top of the bilayer. However, when the extra-membranous domain was at the bottom of the bilayer, diffusion was greatly reduced to 0.04 μm2/s when diffusing within the PEG support and
immobile when in contact with the glass.63Although we show that PLL still hinders protein diffusion, the measured diffusion constants are in fact in good agreement with literature values reported for single α-helical transmembrane proteins in live cells of∼0.2μm2/s.64Our data therefore shows that the PLL-lipid multilayers membranes, which contain fractions of negatively charged lipid comparable to many living systems, provide a very good biomimetic environment for membrane proteins.
■
CONCLUSIONSHerein we have detailed a straightforward and reliable method for creating controllable lipid multilayers using PLL as an electrostatic linker between negatively charged lipids. In addition to linking the lipid bilayers, the PLL also serves as a thin polymer cushion, providing an attractive and biomimetic environment for transmembrane proteins. QCM-D results indicated that the bilayers form on the poly L-lysine layer via
lipid vesicle rupture after reaching a critical vesicle surface concentration, a pathway commonly observed for SLB formation on substrates such as glass or mica. AFM imaging confirmed the formation of multilayers, which at pH 7.0 and pH 5.5 is almost insensitive to PLL chain length. At pH 9.0, longer-chain PLLs form α-helixes, increasing the distance between the lipid bilayers and creating a support akin to a cytoskeleton network (Figure 4). While this study has shown that lipid multilayers can be formed using PLL, this proof of concept might easily be translated to any polyelectrolyte, for instance by extending the intermembrane separation using polyelectrolyte multilayers (PEMs). The formation of single bilayers on such PEMs has been previously demonstrated by Fischlechner et al.56 Additionally, our results provide further understanding for the formation of lipid polyelectrolyte-based biomimetic microcapsules for use in drug delivery, biosensors, and hybrid nanodevices.65
The inclusion of freely mobile functional transmembrane proteins and large transmembrane protein complexes showed that this system easily accommodates a range of proteins. This opens up possibilities for creating functional multilayered membrane systems with the aim of recreating and amplifying some of nature’s most useful machineries. This work is also a key component in the development of artificial Gram-negative bacterial double membranes with the intention of under-standing electron transport across multiple membranes via a number of metalloproteins. As such, it not only provides a system for future possible technologies but also for under-standing fundamental biological processes at membrane− membrane interfaces.
■
ASSOCIATED CONTENT*
S Supporting InformationThe Supporting Information is available free of charge on the
ACS Publications website at DOI: 10.1021/acs.bio-mac.5b01434.
QCM-D of six-layer multilayer formation, AFM of triple lipid bilayer, FPE surface charge measurements, Di-8-ANEPPS membrane dipole measurements, and FRAP of
a triple lipid bilayer, headgroup and fatty acid
fluorescently labeled lipid diffusion comparison, UV−vis of MtrCAB activity in proteoliposomes, and UV−vis of cytochrome P450 activity in proteoliposomes (PDF)
AFM time-lapse video (AVI)
■
AUTHOR INFORMATIONCorresponding Author
*E-mail:[email protected]. Phone: +44 0113 3433829. Notes
The authors declare no competingfinancial interest.
■
ACKNOWLEDGMENTSThe authors thank Simone Paine for purification of MtrCAB. This work was supported by the BBSRC, for work done at the University of Leeds through grant BB/L020130/1 and for work done at the University of East Anglia through Grants BB/ L022176/1 and BB/K009885/1. Work done at the University of Nottingham was supported by EPSRC, Grant EP/J017566/ 1. G.R.H. thanks the EPSRC Directed Assembly Network for a travel grant (TG 31-05-15) to visit the University of Nottingham. Work was also supported through funding by Progetto-ateneo/San Paolo 2012 (Italy).
■
REFERENCES(1) Standfuss, R.; Terwisscha van Scheltinga, A. C.; Lamborghini, M.; Kuhlbrandt, W. Mechanisms of photoprotection and nonphotochem-ical quenching in pea light-harvesting complex at 2.5A resolution.
EMBO J.2005,24(5), 919−928.
(2) Alberts, B., Johnson, A., Lewis, J., Morgan, D., Raff, M., Roberts, K., Walter, P., Eds. Energy Conversion: Mitochondria and Chloroplasts InMolecular Biology of the Cell, 6th ed.; Garland Science:
New York/Abingdon, UK, 2015; pp 753−812.
(3) Bechinger, B. Lipid Multilayers Domains Stack Up.Nat. Mater.
2012,11(12), 1005−1006.
(4) Tayebi, L.; Ma, Y. C.; Vashaee, D.; Chen, G.; Sinha, S. K.; Parikh, A. N. Long-range interlayer alignment of intralayer domains in stacked lipid bilayers.Nat. Mater.2012,11(12), 1074−1080.
(5) Kaizuka, Y.; Groves, J. T. Structure and dynamics of supported intermembrane junctions.Biophys. J.2004,86(2), 905−912.
(6) Chung, M.; Lowe, R. D.; Chan, Y. H. M.; Ganesan, P. V.; Boxer,
S. G. DNA-tethered membranes formed by giant vesicle rupture.J.
Struct. Biol.2009,168(1), 190−199.
(7) Tabaei, S. R.; Jonsson, P.; Branden, M.; Hook, F. Self-assembly formation of multiple DNA-tethered lipid bilayers.J. Struct. Biol.2009,
168(1), 200−206.
(8) Minner, D. E.; Herring, V. L.; Siegel, A. P.; Kimble-Hill, A.; Johnson, M. A.; Naumann, C. A. Iterative layer-by-layer assembly of polymer-tethered multi-bilayers using maleimide-thiol coupling chemistry.Soft Matter2013,9(40), 9643−9650.
(9) Han, X. J.; Achalkumar, A. S.; Cheetham, M. R.; Connell, S. D. A.; Johnson, B. R. G.; Bushby, R. J.; Evans, S. D. A Self-assembly Route
for Double Bilayer Lipid Membrane Formation.ChemPhysChem2010,
11(3), 569−574.
(10) Murray, D. H.; Tamm, L. K.; Kiessling, V. Supported double membranes.J. Struct. Biol.2009,168(1), 183−189.
(11) Gupta, G.; Iyer, S.; Leasure, K.; Virdone, N.; Dattelbaum, A. M.; Atanassov, P. B.; Lopez, G. P. Stable and Fluid Multilayer Phospholipid-Silica Thin Films: Mimicking Active Multi-lamellar
Biological Assemblies.ACS Nano2013,7(6), 5300−5307.
(12) Frost, R.; Jonsson, G. E.; Chakarov, D.; Svedhem, S.; Kasemo, B. Graphene Oxide and Lipid Membranes: Interactions and Nano-composite Structures.Nano Lett.2012,12(7), 3356−3362.
(13) Mazia, D.; Schatten, G.; Sale, W. Adhesion of Cells to Surfaces Coated with Polylysine - Applications to Electron-Microscopy.J. Cell Biol.1975,66(1), 198−200.
(14) Sasaki, H.; Karasawa, K.; Hironaka, K.; Tahara, K.; Tozuka, Y.; Takeuchi, H. Retinal drug delivery using eyedrop preparations of
poly-L-lysine-modified liposomes.Eur. J. Pharm. Biopharm. 2013,83(3),
364−369.
(15) Borden, M. A.; Caskey, C. F.; Little, E.; Gillies, R. J.; Ferrara, K. W. DNA and polylysine adsorption and multilayer construction onto
cationic lipid-coated microbubbles.Langmuir 2007,23 (18), 9401−
9408.
(16) Sakharov, D. V.; Jie, A. F. H.; Bekkers, M. E. A.; Emeis, J. J.; Rijken, D. C. Polylysine as a vehicle for extracellular matrix-targeted local drug delivery, providing high accumulation and long-term retention within the vascular wall. Arterioscler., Thromb., Vasc. Biol. 2001,21(6), 943−948.
(17) Abbasi, M.; Uludag, H.; Incani, V.; Olson, C.; Lin, X. Y.; Clements, B. A.; Rutkowski, D.; Ghahary, A.; Weinfeld, M. Palmitic acid-modified poly-L-lysine for non-viral delivery of plasmid DNA to skin fibroblasts.Biomacromolecules2007,8(4), 1059−1063.
(18) Drury, J. L.; Mooney, D. J. Hydrogels for tissue engineering: scaffold design variables and applications.Biomaterials2003,24(24), 4337−4351.
(19) Shimmen, T.; Yano, M. Active Sliding Movement of Latex Beads Coated with Skeletal-Muscle Myosin on Chara Actin Bundles.
Protoplasma1984,121(1−2), 132−137.
(20) Axelrod, D.; Koppel, D. E.; Schlessinger, J.; Elson, E.; Webb, W. W. Mobility Measurement by Analysis of Fluorescence Photobleaching Recovery Kinetics.Biophys. J.1976,16(9), 1055−1069.
(21) Wall, J.; Golding, C. A.; Van Veen, M.; O'Shea, P. The Use of Fluoresceinphosphatidylethanolamine (Fpe) as a Real-Time Probe for Peptide Membrane Interactions.Mol. Membr. Biol.1995,12(2), 183− 192.
(22) Asawakarn, T.; Cladera, J.; O'Shea, P. Effects of the membrane dipole potential on the interaction of saquinavir with phospholipid
membranes and plasma membrane receptors of Caco-2 cells.J. Biol.
Chem.2001,276(42), 38457−38463.
(23) Cladera, J.; Martin, I.; Ruysschaert, J. M.; O'Shea, P. Characterization of the sequence of interactions of the fusion domain of the simian immunodeficiency virus with membranes - Role of the
membrane dipole potential. J. Biol. Chem.1999,274 (42), 29951−
29959.
(24) Ross, D. E.; Ruebush, S. S.; Brantley, S. L.; Hartshorne, R. S.; Clarke, T. A.; Richardson, D. J.; Tien, M. Characterization of protein-protein interactions involved in iron reduction by Shewanella oneidensis MR-1.Appl. Environ. Microb.2007,73(18), 5797−5808.
(25) Catucci, G.; Occhipinti, A.; Maffei, M.; Gilardi, G.; Sadeghi, S. J. Effect of Human Flavin-Containing Monooxygenase 3 Polymorphism on the Metabolism of Aurora Kinase Inhibitors.Int. J. Mol. Sci.2013,
14(2), 2707−2716.
(26) Wester, M. R.; Yano, J. K.; Schoch, G. A.; Yang, C.; Griffin, K. J.; Stout, C. D.; Johnson, E. F. The structure of human cytochrome
P4502C9 complexed with flurbiprofen at 2.0-angstrom resolution.J.
Biol. Chem.2004,279(34), 35630−35637.
(27) Reed, J. R.; Brignac-Huber, L. M.; Backes, W. L. Physical incorporation of NADPH-cytochrome P450 reductase and cyto-chrome P450 into phospholipid vesicles using glycocholate and bio-beads.Drug Metab. Dispos.2008,36(3), 582−588.
(28) Hartshorne, R. S.; Reardon, C. L.; Ross, D.; Nuester, J.; Clarke, T. A.; Gates, A. J.; Mills, P. C.; Fredrickson, J. K.; Zachara, J. M.; Shi, L.; Beliaev, A. S.; Marshall, M. J.; Tien, M.; Brantley, S.; Butt, J. N.; Richardson, D. J. Characterization of an electron conduit between bacteria and the extracellular environment.Proc. Natl. Acad. Sci. U. S. A.2009,106(52), 22169−22174.
(29) Dodhia, V. R.; Fantuzzi, A.; Gilardi, G. Engineering human cytochrome P450 enzymes into catalytically self-sufficient chimeras using molecular Lego.JBIC, J. Biol. Inorg. Chem.2006,11(7), 903− 916.
(30) Richter, R. P.; Berat, R.; Brisson, A. R. Formation of solid-supported lipid bilayers: An integrated view.Langmuir2006,22(8), 3497−3505.
(31) Cho, N. J.; Frank, C. W.; Kasemo, B.; Hook, F. Quartz crystal microbalance with dissipation monitoring of supported lipid bilayers on various substrates.Nat. Protoc.2010,5(6), 1096−1106.
(32) Anderson, T. H.; Min, Y. J.; Weirich, K. L.; Zeng, H. B.; Fygenson, D.; Israelachvili, J. N. Formation of Supported Bilayers on Silica Substrates.Langmuir2009,25(12), 6997−7005.
(33) Kunze, A.; Zhao, F.; Marel, A. K.; Svedhem, S.; Kasemo, B. Ion-mediated changes of supported lipid bilayers and their coupling to the substrate. A case of bilayer slip?Soft Matter2011,7(18), 8582−8591. (34) Sauerbrey, G. Messung von Plattenschwingungen sehr kleiner Amplitude durch Lichtstrommodulation.Eur. Phys. J. A1964,178(5), 457−471.
(35) Zhang, W.; Nilsson, S. Helix-Coil Transition of a Titrating Polyelectrolyte Analyzed within the PoissonBoltzmann Cell Model
-Effects of Ph and Counterion Valency.Macromolecules1993,26(11),
2866−2870.
(36) Barrantes, A.; Santos, O.; Sotres, J.; Arnebrant, T. Influence of
pH on the build-up of poly-L-lysine/heparin multilayers. J. Colloid
Interface Sci.2012,388, 191−200.
(37) Janosi, L.; Gorfe, A. A. Simulating POPC and POPC/POPG
Bilayers: Conserved Packing and Altered Surface Reactivity.J. Chem.
Theory Comput.2010,6(10), 3267−3273.
(38) Brown, K. L.; Conboy, J. C. Electrostatic Induction of Lipid
Asymmetry.J. Am. Chem. Soc.2011,133(23), 8794−8797.
(39) Richter, R.; Mukhopadhyay, A.; Brisson, A. Pathways of lipid vesicle deposition on solid surfaces: A combined QCM-D and AFM study.Biophys. J.2003,85(5), 3035−3047.
(40) Reimhult, E.; Hook, F.; Kasemo, B. Intact vesicle adsorption and supported biomembrane formation from vesicles in solution: Influence of surface chemistry, vesicle size, temperature, and osmotic pressure.
Langmuir2003,19(5), 1681−1691.
(41) Cho, N. J.; Cho, S. J.; Cheong, K. H.; Glenn, J. S.; Frank, C. W. Employing an amphipathic viral peptide to create a lipid bilayer on Au
and TiO2.J. Am. Chem. Soc.2007,129(33), 10050.
(42) Jin, X. Y.; Leclercq, L.; Sisavath, N.; Cottet, H. Investigating the Influence of Phosphate Ions on Poly(L-lysine) Conformations by
Taylor Dispersion Analysis. Macromolecules 2014, 47 (15), 5320−
5327.
(43) Quillin, M. L.; Matthews, B. W. Accurate calculation of the density of proteins.Acta Crystallogr., Sect. D: Biol. Crystallogr.2000,56, 791−794.
(44) Lee, H. S.; Yee, M. Q.; Eckmann, Y. Y.; Hickok, N. J.; Eckmann, D. M.; Composto, R. J. Reversible swelling of chitosan and quaternary ammonium modified chitosan brush layers: effects of pH and counter anion size and functionality.J. Mater. Chem.2012,22(37), 19605− 19616.
(45) Noguchi, H. Studies of Helix-Coil Transition of Poly-L-Lysine in Film and Solution.Biopolymers1966,4(10), 1105.
(46) Yasui, S. C.; Keiderling, T. A. Vibrational Circular-Dichroism of Polypeptides 0.8. Poly(Lysine) Conformations as a Function of Ph in Aqueous-Solution.J. Am. Chem. Soc.1986,108(18), 5576−5581.
(47) Binazadeh, M.; Faghihnejad, A.; Unsworth, L. D.; Zeng, H. B. Understanding the Effect of Secondary Structure on Molecular Interactions of Poly-L-lysine with Different Substrates by SFA.
Biomacromolecules2013,14(10), 3498−3508.
(48) Heath, G. R.; Johnson, B. R. G.; Olmsted, P. D.; Connell, S. D.; Evans, S. D. Actin Assembly at Model-Supported Lipid Bilayers.
Biophys. J.2013,105(10), 2355−2365.
(49) Barfoot, R. J.; Sheikh, K. H.; Johnson, B. R. G.; Colyer, J.; Miles, R. E.; Jeuken, L. J. C.; Bushby, R. J.; Evans, S. D. Minimal F-actin cytoskeletal system for planar supported phospholipid bilayers.
Langmuir2008,24(13), 6827−6836.
(50) Richens, J. L.; Lane, J. S.; Mather, M. L.; O’Shea, P. The
interactions of squalene, alkanes and other mineral oils with model
membranes; effects on membrane heterogeneity and function. J.
Colloid Interface Sci.2015,457, 225−231.
(51) Cladera, J.; O'Shea, P. Intramembrane molecular dipoles affect the membrane insertion and folding of a model amphiphilic peptide.
Biophys. J.1998,74(5), 2434−2442.
(52) Carrier, D.; Pezolet, M. Investigation of Polylysine
Dipalmi-toylphosphatidylglycerol Interactions in Model Membranes.
Biochem-istry1986,25(14), 4167−4174.
(53) Spurlin, T. A.; Gewirth, A. A. Poly-L-lysine-induced morphology changes in mixed anionic/zwitterionic and neat zwitterionic-supported phospholipid bilayers.Biophys. J.2006,91(8), 2919−2927.
(54) Heath, G. R.; Roth, J.; Connell, S. D.; Evans, S. D. Diffusion in
Low-Dimensional Lipid Membranes.Nano Lett.2014,14(10), 5984−
5988.
(55) Heinemann, F.; Vogel, S. K.; Schwille, P. Lateral Membrane Diffusion Modulated by a Minimal Actin Cortex.Biophys. J.2013,104
(7), 1465−1475.
(56) Fischlechner, M.; Zaulig, M.; Meyer, S.; Estrela-Lopis, I.; Cuellar, L.; Irigoyen, J.; Pescador, P.; Brumen, M.; Messner, P.; Moya, S.; Donath, E. Lipid layers on polyelectrolyte multilayer supports.Soft Matter2008,4(11), 2245−2258.
(57) Sadeghi, S. J.; Meirinhos, R.; Catucci, G.; Dodhia, V. R.; Di Nardo, G.; Gilardi, G. Direct Electrochemistry of Drug Metabolizing Human Flavin-Containing Monooxygenase: Electrochemical Turnover
of Benzydamine and Tamoxifen.J. Am. Chem. Soc.2010,132(2), 458.
(58) Rowland, P.; Blaney, F. E.; Smyth, M. G.; Jones, J. J.; Leydon, V. R.; Oxbrow, A. K.; Lewis, C. J.; Tennant, M. G.; Modi, S.; Eggleston, D. S.; Chenery, R. J.; Bridges, A. M. Crystal structure of human
cytochrome P450 2D6.J. Biol. Chem.2006,281(11), 7614−7622.
(59) Clarke, T. A.; Edwards, M. J.; Gates, A. J.; Hall, A.; White, G. F.; Bradley, J.; Reardon, C. L.; Shi, L.; Beliaev, A. S.; Marshall, M. J.; Wang, Z. M.; Watmough, N. J.; Fredrickson, J. K.; Zachara, J. M.; Butt, J. N.; Richardson, D. J. Structure of a bacterial cell surface decaheme electron conduit.Proc. Natl. Acad. Sci. U. S. A.2011,108(23), 9384− 9389.
(60) Wagner, M. L.; Tamm, L. K. Tethered polymer-supported planar lipid bilayers for reconstitution of integral membrane proteins: Silane-polyethyleneglycol-lipid as a cushion and covalent linker.
Biophys. J.2000,79(3), 1400−1414.
(61) Smith, E. A.; Coym, J. W.; Cowell, S. M.; Tokimoto, T.; Hruby, V. J.; Yamamura, H. I.; Wirth, M. J. Lipid bilayers on polyacrylamide
brushes for inclusion of membrane proteins.Langmuir2005,21(21),
9644−9650.
(62) Gilmanshin, R.; Creutz, C. E.; Tamm, L. K. Annexin-Iv Reduces the Rate of Lateral Lipid Diffusion and Changes the Fluid-Phase Structure of the Lipid Bilayer When It Binds to Negatively Charged
Membranes in the Presence of Calcium.Biochemistry1994,33(27),
8225−8232.
(63) Pace, H.; Simonsson Nystrom, L. S.; Gunnarsson, A.; Eck, E.; Monson, C.; Geschwindner, S.; Snijder, A.; Hook, F. Preserved Transmembrane Protein Mobility in Polymer-Supported Lipid
Bilayers Derived from Cell Membranes.Anal. Chem. 2015,87(18),
9194−9203.
(64) Frick, M.; Schmidt, K.; Nichols, B. J. Modulation of lateral diffusion in the plasma membrane by protein density.Curr. Biol.2007,
17(5), 462−467.
(65) He, Q.; Cui, Y.; Li, J. B. Molecular assembly and application of biomimetic microcapsules.Chem. Soc. Rev.2009,38(8), 2292−2303.