Study of Biological Sequence Clustering
[Internal Report]
Saliya Ekanayake
School of Informatics and Computing,
Indiana University
[email protected]
ABSTRACT
Determination of biologically related clusters of sequences is important bioinformatics analyses. The similarity between sequences is generally assessed based on their alignments with one another. This could be used with a clustering algorithm to determine groups of sequences, yet it is not straightforward how to get reliable results. We present the factors affecting the quality of clusters and how visualization aids in the refinement of results. We also present a way to verify clusters in the presence of consensus sequences, and represent clusters.
Keywords
Sequence alignment, multi-dimensional scaling
1.
INTRODUCTION
The work on biological sequence clustering is to identify the similar biological sequences and to present them in a comprehensible manner to the biologists. This involves a series of steps starting from finding a measure of similarity between sequences to finally presenting a three dimensional view of the similar groups. It is important in this pipeline to capture and preserve the inherent similarity between sequences in order to yield reliable clusters at the end. This requires understanding the effect of different choices available at each step in order to minimize distortions and verifying clusters if possible with existing consensus sequences. Also, in an engineering aspect, implementing some of the steps requires adopting parallel solutions to meet with demanding computational power. In this paper we present our experience and findings over two separate, yet similar, sequence clustering projects involving around million sequences each.
2.
SIMPLE ARCHITECTURE
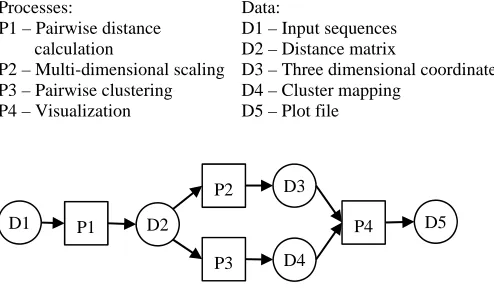
The series of steps involved in sequence clustering is put in a simple pipeline as shown in Figure 1 where numbered items are as follows.
Processes:
P1 – Pairwise distance calculation
P2 – Multi-dimensional scaling P3 – Pairwise clustering P4 – Visualization
Data:
D1 – Input sequences D2 – Distance matrix
D3 – Three dimensional coordinates D4 – Cluster mapping
D5 – Plot file
Figure 1. Simple pipeline of steps
Given a set of sequences, the first step is to perform pairwise alignment and determine the similarity between each pair of sequences. Similarity is presented as a distance such that high similarity means small distance and vice versa. The multidimensional scaling program operates on the computed distance matrix and produces a set of three dimensional coordinates to represent sequences while preserving the distance between them. The pairwise clustering program processes the same distance matrix and produces a mapping of sequences to similar groups. The set of coordinates and the cluster mapping is processed together by the visualization program to produce the three dimensional plot of sequences colored into groups found by clustering program.
3.
DETERMINATION OF CLUSTERS
The clusters we find are meant to capture the natural closeness of biological sequences, strictly speaking, but there is no definitive way to determine if one cluster mapping is biologically more accurate over the other. Thus, our options are to understand the different factors that influence cluster results and to tune them such that any biological similarity present in the input sequences may get preserved through the steps in the pipeline.
3.1
Visualization to Complement Clustering
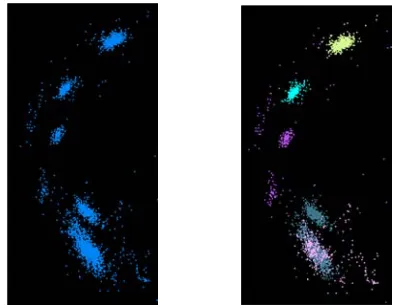
[image:1.612.55.302.545.689.2]Refinement of clusters would solely depend on a mathematically computed goodness measure if clustering were to be performed without visualization. The caveat is that even though the clustering algorithm is properly written and produces good clusters, it may still fail in discovering proper clusters.
Figure 2 shows a portion of the sequences visualized as points in three dimensions. Colors indicate clusters found by the clustering program. The left figure shows how the clustering program has grouped two seemingly distinct sequence groups into one cluster. Situations like this are common when clustering a large number of sequences as the program would converge satisfying a condition global to all the sequences yet suboptimal for sequences in some clusters. The figure on right shows the effect of clustering sequences only in these two groups. It has resulted two clusters as one would expect.
The reverse of the above scenario, i.e. unnecessary splitting of seemingly well-defined cluster, could also happen. Thus, it is clear how visualization aids to identify these mishaps and correct them by further clustering of selected sections or regrouping of splits as necessary.
3.2
Cluster Size
The number of points in a cluster is an important factor as too many will tend to group more than one structure as a cluster while too little may split actual clusters. There is no deterministic method to know this or the number of clusters in advance. Therefore, we use a hierarchical clustering approach with guidance from biologists on the estimated number of clusters. We also rely on the visual structure produced with multi-dimensional scaling.
D1 P1 D2
P2 D3
P3 D4
F id s d c F it te g th a d (a
[image:2.612.45.297.75.177.2]For example, w dentify the num see around 10-15 drive the initial c collection of sm Figure 5 for exa ts refinement o echnique enable geometrical struc hat determining agree with actu discussed in sect
Figure 5. Hiera
a)Multiple grou as one c
Figure 2. Clus
(a) Gap open
we look at the mber of coarse-gr
5 clusters in our clustering. If so aller clusters, w ample, shows a c on right (note c es us to get clu cture of sequen g if clustering r ual biological s
ion 4.
archical cluster
ups identified cluster
(b
ster refinement
n -10, gap exten
three-dimensio rained clusters. r datasets. We u me of the cluste we will further c coarse-grained c colors distinguis ustering result t nces. It is worth results and geom structure is a
ring with aid fro
b) Refined clust split
t with the aid fr
sion -4
Figure 4.
nal projection Usually we cou use this number ers appear to be cluster only thos cluster on left an sh clusters). Th to agree with th h mentioning he
metrical structu separate task
om visualization
ters to show pro t of groups
rom visualizatio
(b) Gap ope
Comparison of
to uld to e a se. nd his he ere ure as
n
3.3
E
Sequen pair co decisio extendi possibl in turn We stu (section penaltie (GE). W
Refere
little or
GO GE
A com against clusters differen Moreov as they true in per
on
Seque Seque
Globa
Local
en -16, gap exten
f results for diff
Effect of Ga
nce alignment m ould be found to on depends on th ing gaps, which le to get differen result different d udied the effect
n 6) dataset of es were -16 for We tested for th
ence source not
r no effect comp
Table 1. C
4 4 8 --2 -4 -4
mparison of the t the reference i s is the same nces in shapes ver, the actual p y maintain their
these tests. ence 1 ence 2
al alignment
[image:2.612.50.559.153.384.2]alignment
Figure 3. Glob
nsion -4
fferent gap pena
ap Penalties
may insert gaps yield a better s he penalties asso are generally k nt alignments ba distances betwee of gap penalties f 6822 sequence r gap open (GO he combinations
t found. and fo pared to the refer
Combinations o Ref.
-10 -16 -16 -16 -4 -4 -8 -16
results for com is given below i
in all three ca and positions position of cluste r relative distan
TTGAGTTTT AAGTTTCTT
[image:2.612.75.273.541.695.2]TTGAGTTTT |||||| ---AAGTTT
ttgagtttt
aa bal vs. local seq
(c) Gap ope
alties
s
when no non-ga core for the alig ociated with intro known as gap pe
ased on these p en sequences. s with a smaller es where the re O) and -4 for ga of gap penaltie ound the clusteri
rence case.
f gap penalties
-20 -20 -20 -24 -4 -8 -16 -4
mbinations -4/-4 in Figure 4. The ases and except the results seem ers is also irrelev
ces, which happ
TAACCTTGCGG TGCCGG
TAACCTTGCGG | ||| | T---CTT---G
taacCTTGCGG ||||||| agtttCTTGCGG
quence alignmen
en -4, gap exten
ap character gnment. The oducing and enalties. It is enalties and r 16S rRNA commended ap extension es in Error!
ing to show
4 -24 -24 -24 -8 -16 -20
4 and -10/-4 e number of t for minor m identical. vant as long pened to be
GCCGTA
GCCGTA ||| GCCG–G
Gccgta | G
nt
3
T W a w d W e p F o c le T u T e m d 2 s lo w e b T 1 d a w r r p
3.4
Global V
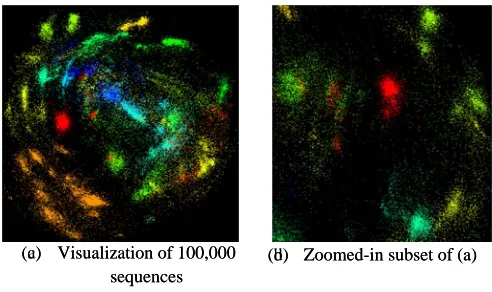
The two best kn Waterman [1] an and global align wise both these distinction, how Wunsch is const end whereas Sm producing an opt Figure 3shows t on two sample s characters of bo ength equal or The local alignm upper case (other The decision of experienced, dep measure. For exa distributions with 200 to 1000 in sequences had m onger sequence with many gaps effect was visibl being prominent The two images 100,000 sequen dimensional poin alignment. The which suggested elationship. We esult of an ano present in sequen
Fig
Figu
0 0.1 0.2 0.3 0.4 0.5 0.6
2
Distan
ce
Vs. Local S
nown sequence nd Needleman-W nment of sequen e perform a sim wever, comes f
rained to find an mith-Waterman
timal alignment. the results of glo sequences. The oth sequences p greater than the ment, in contrast, rs are shown for f which type o pends on the sequ
ample, the data h a range of 181 n the other. Al most of their char
es. This nature s with Needlem le both in cluste
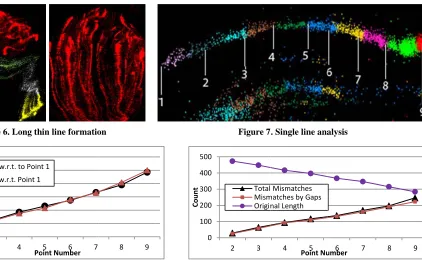
in the latter as lo in Figure 6 sho nces of 16s rR nts where dista
points have fo the Euclidean d carried two ana maly or the ver nces.
gure 6. Long th
ure 8. Computed
3 4
Po
CD w.r.t. to Point ED w.r.t. Point 1
equence Ali
alignment algor Wunsch [2], wh nces respectively
milar kind of c from the fact n optimal alignm
is relaxed to f
obal and local se global alignmen lus gaps giving e length of the , includes only th
clarity of the po of alignment to uence set and th we used had no 1 to 585 in one
so, the majorit racters as a subs resulted superf man-Wunsch glo
ring and visuali ong thin lines. ow the overall s RNA when ma ances computed ormed long thin distances along a
alyses to determ ry nature of bio
hin line formatio
d Vs. Euclidean
5 6 7
oint Number
t 1
ignment
rithms are Smit hich perform loc y. Implementatio computation. Th that Needlema ment from end-t find a subsectio
equence alignme nt contains all th g an alignment
longest sequenc hose characters osition). o perform, as w he type of distan
on uniform leng set and a range ty of the small set in one or mo fluous alignmen obal aligner. Th ization results, y
shape resulted f apped into thr based on glob n line structure a line have a line ine if this was th ological similari
on
n distance
8 9
th-cal
on he
an- to-on
ent he of ce. in
we ce gth of ler ore nts he yet
for ree bal es, ear he ity
[image:3.612.130.552.56.325.2]We iso distanc compar point 1 distanc The ov multi-d coordin distanc mismat 9. A mi a differ shows sequenc comput of mism decreas distanc virtuall Figure dearly distanc Smith-W alignme spheric
3.5
D
The dis on the betwee the sam type. In (PID) d we list ongoing
0 100 200 300 400 500
Co
unt
olated a line of p ces along its leng
red the compute 1 to all the othe ces (ED) as in Fi verlap of lines C dimensional scal
nates to represen ces between t
tches against the ismatch is when rent character in
a linear increa ce lengths decr ted over alignm matches. Thus F se of sequence ce due to the in
ly all mismatch 9. In conclusio
to leverage t ce values.
Waterman loc ents with reaso cal shaped cluste
Distance Ty
stance between eir alignment t en them. Differe me alignment dep
n our experimen distance type du t few other type
g research work
Figure 7
Figure 9. Effe
2 3 Total Mism Origin
points and select gth as shown in ed distance (CD) er points with th
gure 8. CD and ED in ling program ha nt sequences, w them. The se e sequence lengt n a character in o n the other sequ ase of the num
rease linearly. ments has a linea Figure 8 and Figu
length has cau ncrease number hes have been c on, global align the length diff
al aligner, in onable alignmen ers than linear on
ypes
two sequences that represents ent distance valu
pending on the p nts we used the w ue to the interest
es that we are k.
7. Single line ana
ect of gaps on th
4 5
Point Nu
Mismatches matches by Gaps
nal Length
ed nine points in Figure 7. The f ) based on align he correspondin
Figure 8indica as found an acc which preserves econd analysis th along the line one sequence is a uence or a gap mber mismatches
The distance m ar relationship w ure 9 suggest th used the linear
of mismatches caused by gaps nment has intro ference causing n contrast, fo nt lengths leadi nes as shown inF
is a computed the biologica ues may be com particular choice well-known Perc t of biologists. A currently evalua
alysis
he linear forma
6 7
umber
n near equal first analysis nments from g Euclidean
ates that the curate set of the original compared as in Figure aligned with . The graph s while the measure we with number hat the linear increase in . Moreover, as seen in oduced gaps g unreliable ound better
ng to more Figure 10.
value based al closeness mputed over e of distance cent Identity Additionally, ating in our
tion
F g th b m b
3
G m in c
3
B d m 2
[image:4.612.53.299.53.199.2]In a d c s c e c s p g F a p
[image:4.612.319.562.91.197.2]Figure 10. Mul
Figure 11 shows gaps (note a loca
he region exclu boxes with the s mismatches. Pair being aligned wit
3.5.1
Percen
Given the alignm matching pairs in n the aligned r computed accord
3.5.2
Normal
Both Needleman determine the maximizing a va 2.
n Eq. 2 is the any) and is the determined by characters in a s scoring matrix c characters. Thus equal to the sco characters is a g same sequence penalty. If the pr gap extension pe Figure 12 illust alignment using penalties.
(a) Visualiza se (c) Visualiza se
lti-dimensional local ali
s a general seque al alignment wi uding end gaps
same color indi rs with one box
[image:4.612.69.280.292.357.2]th a gap.
Figure 11. Sequ
t Identity (PID
ment between tw n aligned region region be . T ding to Eq. 1.
1.0
lized Score
n-Wunsch and S best alignmen alue called score
e length of the a e score for p
the scoring m sequence belong contains a score s, if pair co ore in scoring m gap and the char is not a gap th revious characte
nalty.
trates the score the scoring mat ation of 100,000 equences ation of 100,000 equences
scaling with Sm ignments
ence alignment ll not result end as the aligned cate a match an
and one dash in
uence alignmen
D) Distance
wo sequences, l n be and the t The PID distanc
Eq
Smith-Waterman nt between tw
e, , which is co
Eq alignment (inclu air of aligned ch matrix and gap g to a particular e for each possi ontains two cha matrix for that p
racter in the hen is the va er is also a gap t e computation f trix on the left (b) Zoome (d) Zoome
mith-Waterman
with possible en d gaps). We nam d region. Pairs
nd others indica ndicate a charact
nt
let the number total number pai ce, , is the
q. 1
n algorithms fin o sequences b omputed as in E
q. 2
uding end gaps, haracters, which p penalties. Th r alphabet and th ible pairs of suc aracters then pair. If one of th
1 pair of th alue of gap ope then is taken for a hypothetic and specified ga ed-in subset of (a ed-in subset of (a
n
nd me of ate ter
of irs en
nd by Eq.
if is he he ch is he he en as cal ap
The sc particul measur
A A T C G
-Howev distanc optimiz and we
Av
In Eq. .The p denoted
is
M
Eq. 4 i of aver
M
Here w as in Eq
M
In cont score o
M
This is scores i Note. alignme with su Eq. 6 a
We stu other an The a)
a)
core, though rep lar two sequenc re to compare a s
A T C G
5 -4 -4 -4 -4 5 -4 -4 -4 -4 5 -4 -4 -4 -4 5
Figure
ver, it is logical ce since the al
ze this value. As e present five nor
verage Local 1.0
3, is the sc portion of the seq
d as and similar to a Min Local
1.0
s similar to Eq. rage.
Max Local
1.0
we take the maxi q.3 and Eq. 4. Min Global
1.0
trast to equation of full sequences Max Global
1.0
similar to Eq. instead of minim
These equation ents, yet with g ubsequences a and Eq. 5 to Eq.
.
udied the differe nd for loca serves as a r
present a simila ces, may not be set of sequences
GO = -16 G
T C A A T T
5 4 16
-5 4
38
e 12. Score of an
to consider the lignment algorit s a solution one rmalizations in E
core for the alig quence that par is the score for and is the a
3 except r
imum of an
0
ns above, here w and as indica
0
5 except we us mum.
ns are valid fo global alignment and respectivel
. 7. Also,
ence of these dis al alignment of F reference since w
arity measure b used directly a s.
GE = -4
A C C A - - C T
-4 -4 5 -4 16
5
n alignment
e option of using thm finds align could use norm Eq. 3,4,5,6, and
E gnment of sequ rticipates in the a r alignment of
verage function.
E represents minim
E nd . The res
E we consider the
ated by and
E se maximum of
for both local t sequences an ly thereby reduc may then b
stances with resp Fungi [section 6] we could obtain
between the as a distance
- G
-16
4 4
4 16
g score as a nments that malized score
7.
Eq. 3 uences and
alignment is with itself. .
Eq. 4 mum instead
Eq. 5 st is as same
Eq. 6 self-aligned
.
Eq. 7 self-aligned
and global
nd coincide
cing Eq. 4 to be termed as
c a f b d s f [
3
B in B
In s p c s s
3
S is s a r d s
3
G s F d
clustering result , and . Figure
as a “heat followed similar based on global s did not correlate shows the corre followed the sam
3].
[image:5.612.56.293.165.298.2](a)
Figure 13. Co
3.5.3
Normal
Bit score, ′, is a n Eq. 2. It is use BLAST [4] and i
n Eq. 4, is the statically determ penalties [5]. T comparable amo same normalizat score distance.
3.6
Statistic
Statistical signifi s for such an ali sequences and a particular scor andomly shuffl distances compu statistical signific
3.7
Distanc
[image:5.612.56.281.569.655.2]… … … … … …
Figure 14.
Given a distance set of points tha Figure 14. How dimensions and
ts based on it. , and e 13 (a) shows tmap”. The r correlation dia
self-aligned scor well with each lation of me pattern. Detai
Vs.
rrelation of nor percent iden
lized Bit Scor
a log scaled vari ed mainly in the is computed acco
ln ln 2 e raw score comp mined for the The bit score v ong different alig
tion as in Eq. 3
cal Significa
icance of an alig ignment to happe this could be re, , or higher led and aligned uted previously cance.
ce Transform
…
. Three dimensi
e matrix, multi-d at preserves the wever, the dist reducing them
. The comparis correlate we the correlation
and agrams with
res, i.e. Eq. 6 an other or with
and ils of this analys
(b)
rmalized score d ntity distance
re
ant of the raw s popular protein ording to Eq. 4. Eq. puted in Eq 2. V given scoring value, unlike ra
gnments. Howev 3 to compute th
ance
gnment indicate en by chance [6 thought of as th would occur w d. We could, th y by weighting
mation
ional mapping o
dimensional sca e pairwise distan
tances often co to three dimens
son indicate th ell with each oth
of an
distanc . The distanc nd Eq. 7, howeve
. Figure 13( , and sis are available
Vs.
distance versus
core, , compute n sequence aligne
8
Values and a matrix and ga aw score, is th
ver, we apply th he normalized b
es how probable ]. For a given tw he probability th when and a hus, improve th g them with th
of distances
aling would find nces as shown ome from high sional points ma
hat her nd ces ces er, (b) at
ed er,
are ap us he bit
it wo hat are he he
d a in her ay
produce are con As a so would dimens monoto is the followi current
3.7.1
This m power powers
3.7.2
This m higher distanc may no dimens
3.7.3
This s mention dimens
4.
CL
Even a as eluc results verify t consen to repre Given pipeline for the dimens differen will see concen
Figu
The ye appeare near the
5.
CL
Once w find se
e “less reasonab ncentrated to the olution, we are e reduce the dime sional scaling onic and satisfy mapping funct ing presents bri tly evaluating.
Transformat
method perform called Transfo s 2, 4 and 6.
Transform M
mapping assume dimension, . T ces in dimension ot be random, sion higher than
Transform M
starts with tran ned in section sion by raising th
LUSTER V
after taking the c cidated in sectio
if possible. On the clusters agai sus sequence is esent a group of a consensus e with a
d e next steps. O sional scaling re
nt color to the e consensus poi ntration of points
ure 15. Cluster
ellow dots in F ed within cluste e dense region o
LUSTER R
we are satisfied equences to rep
ble” result where edge of the surf evaluating differ ensionality of th program. Thes
y ∀ , :
tion and , ief descriptions
tion Method 1
s the
ormation Param
Method 8
es a random dis Then it performs n 4. However, s this could end 4 as well.
Method 9
nsforming dista n 3.7.2 and th he 4 dimensiona
VERIFICAT
correct options on 3, we may w ne approach that inst a given set usually a biolog f similar sequenc sequences and sequence set. T distance matrix, Once we get b esults we will vi points. If we ints appearing w s in a cluster.
verification wi
Figure 15 show ers in one of ou of clusters verify
REPRESEN
with the cluster present each clu
e higher dimens face.
rent mapping fu he input distanc se mapping fu
:
are input dist of mappings t
10
, where meter. We are
stribution of dis s an analytical d since the origin up finding dis
ances to 4 dim hen increases al distances to po
TION
to produce relia want to verify th t we have been of consensus se gically determin ces.
d sequences w This results in c , which become both clustering isualize the resu find good clust within clusters a
ith consensus se
how consensus ur results. Thes ying the accuracy
NTATION
ring results we m uster. Similar to
sional points unctions that ces to multi-unctions are
, where tances. The that we are
is a given evaluating
stances in a derivation of nal distances stances in a
mensions as the formal ower 0.5.
able clusters he clustering n using is to equences. A ed sequence we start the computing a es the input and multi-ults giving a
ters then we and near the
equences
s sequences se points lie y of results.
s r p
5
G d p
5
S th H E a
5
T E n ta
5
T m s s
6
S s fu s T 6 r s h u
T s
sequences these egion of clusters present the metho
5.1
Sequenc
Given a cluster t distance to other points in a cluste
∑ / , wh
5.2
Euclide
Similar to seque hat has a minim However, distan Euclidean space alignments.
5.3
Centroi
This method fi Euclidean space nearest to the ce aken as the cente
5.4
Alterna
The mean distan maximum distan sequence that h sequences in a gi
6.
Descripti
Studies presented sets where one co fungi sequences. sets.
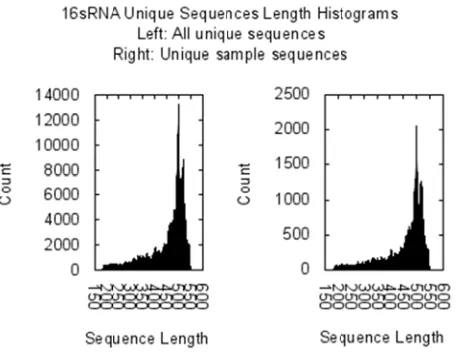
[image:6.612.321.547.136.307.2] 16S rRNA s This contains a 684769 unique andom selection sample points fo histogram of seq unique sample se
Figure 16.
The histograms s sample sequence Fungi seque
would need to s. We name thes ods of computin
ce Mean
this is the seque r points in the s er we will find th here ∈ and
ean Mean
ence mean, this mum mean dista nces are taken e rather than
id of Cluster
nds the centro e. Then, in the
ntroid. The sequ er for the particu
atives to 5.1
nce in both 5.1 a nce as an alter has the smalle iven cluster.
ion of Data
d in this paper w ontains 16S ribo . We denote the
sequences total of 11609 ones based on n of 100000 s for interpolation
quence lengths equences.
Length histogra
show similar sh es with respect to
ences
be within and se sequences as c ng them.
ence that has th ame cluster. So he sequence, ∈
is cardinality o
method also fi ance to other po n from the th from distances
r
oid point of th same space, i uence represente ular cluster.
and 5.2
and 5.2 may be rnative. Then th st maximum d
were based on t osomal RNA and ese as 16S rRNA
946 sequences, w n the actual se
equences of th purposes. Figu for unique sequ
am of 16S rRNA
hape indicating a o lengths.
near concentrate cluster centers an
he minimum mea if is the set
, that minimiz of .
inds the sequen oints in a cluste hree dimension computed fro
he cluster in th it finds the poi ed by this point
replaced with th hey will find th distance to oth
two sequence da d the other a set A and Fungi da
which reduces quence string. hem is chosen
ure 16 shows th uences and 100
A sequences
an unbiased set ed nd
an of zes
ce er. nal om
he int is
he he her
ata of ata
to A as he 0K
of
This co Indiana sequenc interest which c rRNA this as
7.
SU
In this clusteri We wo present reliable be used the cho distanc dimens measur of verif availab consen dimens we pre each clu
8.
RE
[1] Sm molecu 197. [2] Ne applica of two [3] Eka [4] Alt Lipman 3 (Oct [5] The
[6] Agr sequenc
Advanc
306.
ontains a set of f a University, B
[image:6.612.58.286.480.657.2]ces where 4821 ted in analyzing covered a total o sequences, we sample sequence
Figure 17. Len
UMMARY
s paper we pre ing and series o ould like to cap t within the inpu e clusters in the d to identify ill-d oice between glo ce measures, a sionality of inpu res of ensuring r fying clusters wh ble. Visualization sus sequences sional plot to ver esented how to f uster based on in
EFERENC
mith, T. F. and W ular subsequence eedleman, S. B able to the search
proteins. J Mol B
anayake, S. Heat
tschul, S. F., G n, D. J. Basic lo
5 1990), 403-41
e Statistics of Seq
rawal, A., Chou ce comparison
ces in experimen
fungi sequences Bloomington. I 58 of them are u g sequences wit of 446041 uniqu used a 100000 es.
ngth histogram
esented the ide of steps involved pture and preser
ut sequences thr end. We discuss defined clusters, obal and local a and distance t ut distances to m reliability. Next hen a known set n aids in this to
over the othe rify the quality o find sequences, ntra cluster poin
ES
Waterman, M. S es. J Mol Biol, 1
. and Wunsch, h for similarities
Biol, 48, 3 (Mar
tmaps of Differe
Gish, W., Mille ocal alignment se
0.
quence Similarit
udhary, A. and H n using pairwi
ntal medicine an
received from b t has a total unique. The bio th lengths greate ue sequences. Sim
random sequen
of Fungi sequen
ea of biologica d in the clusteri rve the intrinsic rough the pipelin sed how visualiz , the effect of ga alignment, differ transformations multi-dimensiona
we moved on to t of consensus se oo as one could er sequences in of clustering resu called centers, nt distances.
S. Identification 147, 1 (Mar 25 C. D. A gene s in the amino ac r 1970), 443-453
ent Distances. Ci er, W., Myers,
earch tool. J Mo ty Scores. City. Huang, X. Seque
se statistical s
nd biology, 696
biologists in of 957387 logists were er than 200, milar to 16S nce set from
nces
al sequence ing pipeline.
similarities ne to obtain zation could ap penalties, rent types of to reduce al scaling as
o the details equences are overlay the n the three ults. Finally,
to represent
of common 1981), 195-eral method cid sequence 3.
ity, 2012. E. W. and
ol Biol, 215,