International Journal of Innovative Technology and Exploring Engineering (IJITEE) ISSN: 2278-3075, Volume-8 Issue-7, May, 2019
Abstract- Big Data is generated in different formats with high velocity and volume, for those reasons conventional approaches cannot deal with this kind of data. Hence big data tools i.e. Hadoop came into the glare due to its high scalability, availability and cluster environment mechanism accelerate the work in distributed manner. One of the prominent components of Hadoop is MapReduce which can handle any format of data but to use this module highly programming skill is needed for these reason users move towards Apache pig, as we can analyze data only by executing queries. Due to the fault tolerant feature, Pig conceives value under Hadoop platform. In this paper, we analyze stock exchange data of various sectors with the help of Apache pig. Stock exchange data from 2013-2018 is taken and calculate 52 week low, average and high prices through PigLatin script and represented the result in a pictorial form. We also characterize the comparative study of diverse sectors named Banking, IT, Oil and Sugar in order to make the clear image to understand the data. The organized system facilitates the researchers or analysts to come across absolute decision toward spend their assets by means of yield within small instance.
Index Terms: Big data, Hadoop, Apache pig, stock exchange data, stock sectors
I. INTRODUCTION
The term “Big data” is used to label the data which is immense and versatile i.e. generated from different sources such as websites, social media, medical data and stock data on the daily basis. Although, some data is defined in the structured files form can be handled by traditional devices. Semi-structured data considered as CSV, XML, while another contains audio, pictures considered as un-structured data needs new emerging tools and techniques to analyze or deal with this kind of data. Over some instance, data of stock exchange increased gradually ensuing in an inconceivable quantity which is defined as “volume”. To handle this enormous volume of data with highly efficiency; here is mainly accepted tools of big data is Apache Hadoop [16]. In the terms of “big data” relationships are established on necessity and not stored in fixed rows and columns [18].
Apache Hadoop- Hadoop is a release structure written in java. Moreover, it is planned to handle vast amount of data in very proficient way over dispersed environment [8]. In the Hadoop framework, data is stored in the form of block of size 128MB or 256MB.
Revised Manuscript Received on May 10 ,2019
Yogesh Kumar Gupta, Faculty of Mathematics and Computing, Banasthali Vidyapith, Jaipur, India.
[image:1.595.310.547.184.258.2]Shruti Sharma, Faculty of Mathematics and Computing, Banasthali Vidyapith, Jaipur, India.
Fig 1. Data storage mechanism of Hadoop
From the above fig 1, we conclude that block size is defined as 128 MB by the default value over configuration. Then 5 blocks will be created with size of 128MB, 128MB, 128MB, 128MB, 4MB for first, second, third, fourth and fifth block respectively to store block size of 516MB. This property of Apache Hadoop will define the memory utilization or overcome the problem of memory devastate. Hadoop architecture elaborates nodes i.e. NameNode or master node is used to maintains, controls and manages the DataNodes. DataNodes or slave nodes send heartbeat to the NameNode on the regular basis for the surety of aliveness. NameNode store all the records of DataNodes in the HDFS. NameNode also provide the facility of data replication in case of node failure or data loss [11]. Hadoop is fairly illustrated as economical to utilize because as compared to other databases which uses expensive drivers like “Storage Area Network” Hadoop uses “Directed Attached Configuration” for disk drivers.
Apache Pig- Pig is the one of the core component of Hadoop which works on the Latin Scripts. It is a data flow language which fills the gap between the high level declarative language SQL and low level procedural language i.e. MapReduce. Although, parallel execution of pig on the cluster environment of Hadoop speedup the performance [17]. At this moment the query is raised why Pig is originated as we previously have MapReduce programming module.
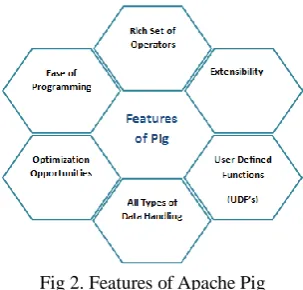
While using MapReduce programming to deal with Big Data, developers need to write several lines of code requiring spare time and effort. And also who have less skilled knowledge of java cannot handle the Big Data using MapReduce programming. That is why Apache Pig used in place of MapReduce programming. The fundamental of Pig Latin data flow provide an instinctive mode as users can write down composite diagnostic queries and that successively compiled towards MapReduce jobs [14]. Features of the Apache pig defined as follows-
Impact of Big Data to Analyze Stock Exchange
Data Using Apache Pig
Fig 2. Features of Apache Pig
Execution environment of Apache pig elaborated in different forms; Execution over distributed environment on a Hadoop cluster and another one is execution in local mode over single JVM.
Stock exchange data- There are large number of stock investors increased day by day from the establishment to the growth of the stock exchange. With frequently rising of stock researchers or investors will generate massive amount of data within short period need to be analyzed or processed within the particular time. To deal with this huge datasets of stock, highly effectual tool need to be used to generate meaningful insights form the data which will help to make decision and investors will fritter their assets at right place. Apache Pig is used to analyze large data sets of stock exchange in short extent. On the behalf of real time basis, noisy, redundant, non-relevant data cannot be dealing out using conventional approaches or algorithms i.e. new tools or algorithms is defined.
II. LITERATURE REVIEW
Since 2006, a lot of works have been done on pig. Few work are briefly represented as follows-
Zhang, Cherkasova et al. defines the performance valuation model with the pre-defined resources or certain deadline with the Apache Pig programming approach. This model also uses PigMix benchmark for evaluation. To overcome the problem of performing the work in particular deadline performance model is generated. This benchmark and cluster is used to evaluate the performance of model. This paper is used to help the apache pig to utilize the resources in efficient manner with particular time limit with the help of performance model [1]. Zdravevski, Lameski et al. defines the concept of parallel processing for the simplification and fast processing of algorithm. In this paper, components of Hadoop are used for implementation of algorithms such as HDFS, Hbase, and Apache Pig. In this scenario initially HDFS is worked for storing the data and Hbase is used and all the implementation for parallel plotting of algorithms is done by Pig script. Pig defines the functionality of SQL in efficient manner. Pig is used in this paper to fulfill the work gap between SQL and MR programming. Aim of the paper is to define the headway of both the algorithm such as sequential or parallel [2].
Ouaknine, Carey et al. illustrated the difference between the three ways of data analysis. First approach for data
processing is java MapReduce second is Apache pig and third is ECL (This language is used to execute query on to HPCC platform). Generally PigMix benchmark is used to define the difference between above three approaches. They also define the major difference of Hadoop and HPCC is that Hadoop can be fault tolerable but HPCC cannot hold a single failure [3]. Bhuyan, Zhang et al. states that Apache pig is used for high level programming over Hadoop and one another query language- OPQL is used for building an extensible or modular storage space. OPQLPig is generated to overcome the problem of Pig script .In the PigLatin there is no control statements such as loops or conditions i.e. OPQLPig is generated. OPQLPig is used to transfer OPQL program into Pig Latin scripts. This paper emphasize on the reliability, robustness of the language [4]. Elghandour, Aboulnaga et al. demonstrated re-using the work of MR programming with the help of Restore system (which is defined by pig) .MapReduce programming language for data analysis is so much complex as compared to high level language such as apache Pig. In the MapReduce programming, to enhance the speed or performance, use of Restore system is defined [5]. Preethi, Elavarasi et al.
defines big data analytics using core component Apache pig using (PigLatin-procedural language) and Apache hive using (HiveQL-declarative language) like languages and also explore the architecture of pig and hive. Apache hive defines as a data-warehousing system & used for ad-hoc query analysis. Apache pig defines as a data flow system. This paper concludes the performance of hive and pig over MapReduce programming. Reduce line of code in hive and pig than MapReduce by remove complexity of java programming [6]. Gates, Dai et al. defines the optimization of result which is generated by the execution of scripts (written in PigLatin) with some system constraints and opportunities. Also defines the optimization of performance while using pig techniques. Issues: number of MapReduce jobs, key skew (can be handled by GROUP BY, ORDER BY, JOIN), shuffling [7].
After goes during the comprehensive revision of research papers on pig, we wind up that nearly each one of the authors illustrates PigLatin to remove the complication of MapReduce programming and as well defines the proficiency of PigLatin over MapReduce. Like Preethi, Elavarasi et al. illustrates that Apache pig and hive boost up the performance over MR programming. Bhuyan, Zhang et al. states that OPQLPig is used to exemplify reliability, robustness for the PigLatin script. Hence PigLatin is a high level data flow language for efficient data analyzing and processing.
III. RESEARCH METHODOLOGY
International Journal of Innovative Technology and Exploring Engineering (IJITEE) ISSN: 2278-3075, Volume-8 Issue-7, May, 2019
Oil, Banking, Sugar and IT sector in the form of excel sheets that contain fields name such as symbol, open price, high price, low price, average price, close price etc. Dataset of the IT, Sugar, Banking and Oil sectors consists of records from the year 2013-2018. Each sector contain 4 different companies such as IT sector has named HCL, INFY, TCS and WIPRO, Banking sector has named AXIS, HDFC, ICICI and SBI. Oil and Sugar sectors have named BPCL, GAIL, IOC, ONGC and BALRAM, DHAMPUR, RAJSREE, UTTAM respectively.
Experimental Setup
Software Requirements-Hadoop is installed on Cloudera with CentOS version 6.7. We have elected Virtual Box as graphical user interface with defined version is 5.2.16r123759 (Qt5.6.2) to run the Hadoop (2.6.0-cdh 5.13.0) on cloudera. To execute the queries of pig we have used Pig genre 0.12.0-cdh5.13.0.
Hardware Requirements- RAM required for VM [virtual machine] is 8.00GB. HDD around 1TB, Processor used to run the Cloudera is Intel® core ™ i5. Type specification of the system to run the application is 64 bit operating system along with 64-bit based processor.
Proposed Model to Analyze Stock Exchange Data using Apache PIG:-
In this paper, we have contrivance the model to process the stock exchange data of various sectors named banking, IT, oil and sugar sector. In the following Figure 3 we elaborate the functioning of the Pig, describe how for a specified query data is analyzed and classify variations on stock prices. In a definite fashion queries of the pig carried out gradually. To provide well understanding of data we design the graph for more suitability to the users. By this model we come across the result, by which investors or research analyst will figure out the data to use their funds accordingly.
Fig 3. Model to Analyze Stock Exchange Datasets
PAPER ORGANIZATION
We segregate our paper into different sections. The Section 1 illuminates the perception of big data and emphasizes on the analysis of stock exchange data with the help of one of the famous big data tools “Apache pig”. The section 2 defines the literature survey related to apache pig. Section 3 introduces requirements for the proposed algorithm to analyze the stock data. The section 4 makes us understand how data are analyzed in efficient manner. Last section, concludes the impact of big data to analyze stock data using tools and techniques.
IV. RESULTS AND DISCUSSION
At this time we put in stock exchange dataset of diverse sectors named Banking, IT, Oil and Sugar that is loaded into pig storage. Afterward make processing on stored data and related output is generated as 52 week low, average and high prices from 2013-2018. Some parameters are measured i.e. stock prices, low prices, average prices, high prices of yearly data for the different sectors. Following result is defined corresponding to each sector i.e. big data analyzed using pig.
[image:3.595.306.544.351.465.2]Analyzing Banking sector data
Fig 4. Total number of records of Banks as loading in pig
[image:3.595.57.272.482.750.2]Pig loaded all the records in the Pig storage, in Fig 4 we shows the total number of records of the yearly data.
Fig 5. Comparative analysis of banking sector companies against low, avg and high prices
[image:3.595.309.545.528.658.2]In 2014, HDFC, SBI had lower and higher prices respectively. In 2015, variations on prices are defined, here SBI had lower prices and HDFC had higher prices. In 2016, SBI had lower prices while HDFC had higher prices. In 2017, ICICI had lower prices and HDFC had higher prices. In 2018, SBI had lower prices and HDFC had higher prices. The section of average price defines the variation on prices of different years. Regarding AXIS bank, we can see that the average price become stable after 2014. While average price of HDFC bank is increases every year. In case of ICICI and SBI bank, price grew up in 2014 but again it goes down and became stable. We can conclude that stock prices for HDFC bank growing up gradually.
Analyzing IT sector data
Fig 6. Total number of IT sector records while loading in pig
[image:4.595.306.550.50.171.2]Pig loaded all the records in the Pig storage, in Fig 6 we shows the total number of records of the yearly data of the IT sector.
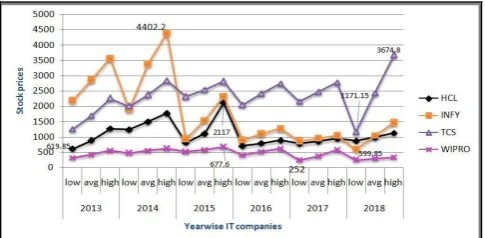
[image:4.595.48.274.216.337.2]Fig 7. Comparative analysis of IT sector companies against low, avg and high prices
Fig 7 describes the variations on the stock prices appear on the basis of lowest, average, highest prices of the whole year. The section of average price defines the variation on prices of different years. Regarding HCL, we can see that the average price become stable after 2016. While average price of INFY and WIPRO, is grew up in 2014 but again it goes down and became stable. In case of TCS, price grew up in 2015 and became stable. When we discussed high and low prices of companies i.e. in 2013 and 2014 stock prices of WIPRO was lower while INFY had higher prices. From 2015-2018, WIPRO, TCS had lower and higher prices respectively. Above outline help the stock researcher to find the stock prices of IT companies in a short period of time to understand the stock exchange very efficiently. Above outline help the stock researcher to find the stock prices of IT companies and makes us understand that we can preferred INFY to invest.
Analyzing Oil sector data
Fig 8. Total number of oil companies records while loading in pig
[image:4.595.304.554.258.397.2]All the records of oil companies are loaded into pig storage. Here the figure 8 defines the total number of records of BPCL, GAIL, IOC and ONGC oil companies.
Fig 9. Comparative analysis of oil sector companies against low, avg and high prices
Above fig 9 describe the variation on the stock prices appear on the basis of lowest, average, highest prices of the whole year. In 2013 and 2014 stock prices of IOC was lower while ONGC had lower prices in 2015, 2016 and 2017. In 2018 IOC again had lower prices. The section of average price defines the variation on prices of different years. Regarding BPCL, we can see that the average price grew up to 2016 and goes down in 2017 and 2018. From this graph we can wind up that BPCL is most efficient to invest.
Analyzing sugar sector data
Fig 10. Total number of sugar companies records while loading in pig
In the Fig 10, we have seen, Pig loaded all the records of
[image:4.595.47.290.412.531.2] [image:4.595.312.541.556.686.2]International Journal of Innovative Technology and Exploring Engineering (IJITEE) ISSN: 2278-3075, Volume-8 Issue-7, May, 2019
Fig 11. Comparative analysis of sugar sector companies against low, avg and high prices
Consequences of figures 11 describes the variation on the stock prices appear on the basis of lowest, average, highest prices of the whole year. In all the fiscal years stock prices of sugar companies named BALRAM, RAJSREE, DHAMPUR, UTTAM was lower. As we seen in 2013, BALRAM, DHAMPUR, RAJSREE had higher prices. IN 2014 and 2015 BALRAM had higher prices. BALRAM and DHAMPUR had higher prices in 2016. Stock price of DHAMPUR was consecutively high in 2017 and 2018.The section of average price defines the variation on prices of different years. Regarding BALRAM and BALRAM, we can see that the average prices grew up to 2017 but again it goes down. AS we have seen for RAJSREE, the stock price is fluctuating in every year i.e. for 2013 it was high, again in 2014 and 2015 it goes down ,in 2016 and 2017 it goes high, but in 2018 prices goes down. Prices of UTTAM became moderate up to 2015 than goes up and down in 2017 and 2018 respectively. From this graph anyone can easily depict within a short period of time that DHAMPUR is right choice to invest.
Comparative analysis of various sectors
Fig 12. Comparative Analysis of various sectors against average price
By the Fig 12 we have calculated average price for each company of all the sectors named Sugar, IT, Oil and Banking sector and then computed the average price for individual sector. Subsequently, adding up the average prices and then calculate the percentage which are intended for each sector that assist the stock analyst to ensure which sector is good for investment corresponding to less amount of money. According to the percent of stock prices of individual sector we can simply
observe that stock prices of sugar sector were lower from 2013-2018 and had higher stock prices for IT sector is 52%. From this graph anyone can easily depict within a short period of time that IT sector is precise preference to spend.
V. CONCLUSION
The massive formation of big data creates difficulties for users to extract the meaningful insights i.e. highly efficient tools needed to analyze data in limited time. Foremost purpose to have a preference of Hadoop platform is to speed up the task since the facility of distributed cluster environment to perform the work or to reduce the load of single machine by performing the works on multiple nodes alongside. Currently many tools of Hadoop are being used to analyze big data and we used apache pig. The key point of this paper is to analyze the stock exchange data of various sectors using pig and represent the result in graphical format and we also have gone through the comparative study of sectors named Oil, IT, Banking and Sugar. The motive of this paper is for the regular investors so that they can take initiation towards their financial future. Unstructured or immense data of stock exchange not at all supposed to be understandable to the investors until meaningful features are not defined in an appropriate form. By means of the above figures we demonstrate that hasty variation lying on stock prices will helps who have small budget. By this pictographic illustration, people who are new to this field can effortlessly sense the state of the stock exchange.
REFERENCES
1. Z. Zhuoyao, C. Ludmila, V. Abhishek and L. T. Boon "Meeting service level objectives of Pig programs." Proceedings of the 2nd International Workshop on Cloud Computing Platforms.ACM, 2012.
2. Z. Eftim, L. Petre, K. Andrea, F. Sonja and T. Dimitar, "Simplifying parallel implementation of algorithms on Hadoop with Pig Latin." Proceedings of the 12th Conference for Informatics and Information Technology (CIIT). Computer Society of Macedonia. 2015.
3. O. Keren, C. Michael, and K. Scott "The PigMix Benchmark on Pig, MapReduce, and HPCC Systems."Big Data (BigData congress), IEEE International Congress on. IEEE, 2015.
4. Bhuyan, Fahima Amin, et al. "Scalable Provenance Storage and Querying
Using Pig Latin for Big Data Workflows."Services Computing (SCC), 2017 IEEE International Conference on.IEEE, 2017.
5. E. Iman and A. Ashraf "ReStore: reusing results of MapReduce
jobs." Proceedings of the VLDB Endowment, Vol. 5, pp.586-597, 2012. 6. R. A. Preethi and J. Elavarasi. "Big data analytics using Hadoop
tools—Apache Hive vs Apache Pig." Int. J. Emerg. Technol. Comput. Sci. Electron, Vol. 24, 2017.
7. F. G. Alan, D. Jianyong and N. Thejas "Apache Pig's Optimizer." IEEE Data Eng. Bull. pp. 34-45, 2013
8. Bhosale, Harshawardhan S., and Devendra P. Gadekar. "A review paper on big data and hadoop." International Journal of Scientific and Research Publications,Vol-4, pp.1-7, 2014.
9. P. P. Rabi, “ Big Data Processing with Hadoop-MapReduce in Cloud Systems”, International Journal of Cloud Computing and Services Science (IJ-CLOSER), Vol.2, pp. 16~27, 2013.
10. E. Nada and E. Ahmed "Big data analytics: a literature review paper." Industrial Conference on Data Mining. Springer, Cham, pp. 214-227, 2014.
[image:5.595.47.308.511.672.2]12.B. Krati, C. Priyanka, and K. Pratik. "Analyzing Performance of Apache Pig and Apache Hive with Hadoop."Engineering Vibration, Communication and Information Processing.Springer, Singapore, pp.41-51, 2019.
13.C. Anshu, and C. S. Satsangi. "Query Execution Performance Analysis of
Big Data Using Hive and Pig of Hadoop." vol. Su-9 no 3, pp. 91-93, 2015.
14.G. F. Alan, N. Olga, C. Shubham, K. Pradeep,M. N. Shravan, O Christopher, R. Benjamin, S. Santhosh and S. Utkarsh "Building a high-level dataflow system on top of Map-Reduce: the Pig experience." Proceedings of the VLDB Endowment ,ACM, (2009): pp.1414-1425.
15.Z. Eftim, L. Petre, K. Andrea, F. Sonja and T. Dimitar "Simplifying parallel implementation of algorithms on Hadoop with Pig Latin." Proceedings of the 12th Conference for Informatics and Information Technology (CIIT 2015).
16.G. Yogesh and C. K. Jha. "A Review on the Study of Big Data with Comparison of Various Storage and Computing Tools and their Relative Capabilities."
17.O. Christopher, R. Benjamin, S. Utkarsh, K. Ravi, T. Andrew "Pig latin: a not-so-foreign language for data processing." Proceedings of the SIGMOD international conference on Management of data.ACM, pp.1099-1110, 2008.
18.Margulis, Chloé, "The Application of Big Data Analytics to Patent Litigation" (2016). Undergraduate Honors College Theses. 5.
AUTHORS PROFILE
Yogesh Kumar Gupta is an Assistant Professor at Banasthali Vidyapith, India. He primarily works in Big data, data Analytics, Medical Image Processing, and Cloud Computing. He has over 12 years of teaching experience.