Optimization of power plants management structure based
on the generalized criteria of the efficiency
Aleksey Salov1,*, Anna Gavrilova1, and Yulia Chirkova1
1
Samara State Technical University, Samara, Russia
Abstract. In the article, the analysis of the operation of power plants in the conditions of economic restructuring to ensure successful entry into the market is carried out. The analysis of the five management structures, including current, typical structure and re-designed by the authors is presented. There are developed the partial efficiency criteria of the management structures that characterize the most important properties - the balance, integrity, controllability and stability. Local criteria of the analyzed structures do not allow to make a definite conclusion about the effectiveness of one of the structures analyzed, formulated global efficiency criterion. There is developed the global criterion of the comparative effectiveness of the management systems based on the DEA method (Data envelopment analysis), taking into account the complex of the proposed local criteria. The considered management structures are ranked based on the generalized criterion of efficiency.
1 Introduction
In [1-3] on the basis of system analysis methods there are studied several management structures of enterprises to determine their efficiency in the conditions of market relations development in Russian Federation.
Transition to the market economy and the constantly changing conditions of functioning of domestic enterprises in a changing economic environment imply a periodical restructure of these companies management organization aimed at their effective independent functioning in the reformation conditions, ensuring the competitiveness of the company as a whole [4-6].
These changes should be based on new patterns of behavior of enterprises in the changed circumstances, and include new units, solving the existing problems, restructure in the hierarchy of subordination and nomenclature of decision makers.
In the previous research works [6,7] the analysis of several hierarchical management structures of local and partial criteria of quality of functioning of the management structures was formulated, but it turned out that these criteria sufficiently fully describing the local properties of the system, do not permit to make an unequivocal choice of the optimal management system. Because of the fact that for each of the systems there is a part of the local criteria that testify to its preference and the other part speaks about the optimality of other structures.
To form one optimal generalized criterion of efficiency of the management structures in this paper we propose to use the graph theory. Based on the graph method it is possible to analyze the structures of management in numerical values of the partial criteria
that convolute to the generalized criterion. The obtained values of the generalized criterion of efficiency allows to rank the analyzed structures.
2
Description of the research object
The objects of this research work are 5 management structures of the power plant with co-generation (heat and power plant). It means the use of power station to generate electricity and useful heat at the same time for the needs of the industry of the region.
The enterprise operates as a part of the energy company, which unites several similar power plants in the industrial region. The director (CEO) heads the power plant. He controls deputies, heads of various departments: heads of divisions, services and workshops.
3
The solution of the problem
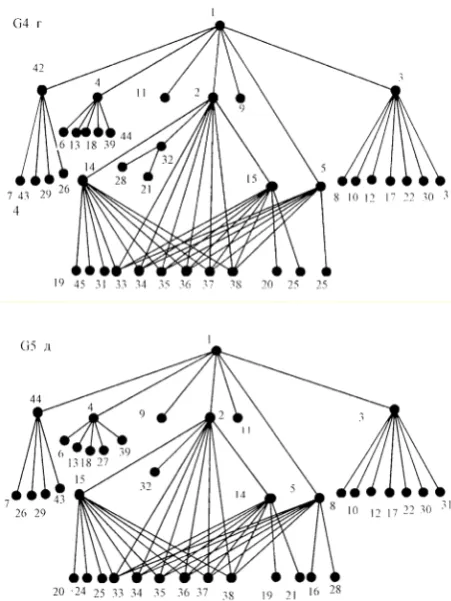
System analysis of the structural management schemes is conducted using the methodology of graph theory [8-10]. This method allows us to consider each position and department in the management structure (director, deputy directors, heads of departments and etc.) as a vertex of the graph, links (management and information channels) as edges of the graph connecting distinct vertices of the management structure.
Analyzed structures as graphs are shown in Figure 1.
Fig. 1. – – standard management – modified management structers.
1 - Director (CEO), 2 - Chief Engineer,
3 - Deputy Director for General Affairs (COO), 4 - Deputy Director of Economics (CFO), 5 - Deputy Director,
6 - Accounting Department, 7 - Human Resources Department, 8 - Office Department,
9 - Legal Adviser,
10 - Inspector of orders execution control, 11 - Emergencies and Civil Defense Department, 12 - Department of Logistics,
13 - Planning and economic Department, 14 - Deputy Chief Engineer (Maintenance), 15 - Deputy Chief Egineer (Repairs), 16 - Department of capital construction, 17 - Maintenance department,
18 - Finance Department, 19 - Shift supervisors, 20 - Repairs Department, 21 - Metals Laboratory, 22 - Garage,
23 - Department of real estate registration, 24 - Mechanical repair shop,
25 - Repair and construction shop, 26 - Dining room,
27 - Tenders Department,
28 - Labor protection Department, 29 - Medical Center,
[image:2.595.310.536.74.375.2]31 - Security Department,
32 - Technical Engineering Department, 33 - Boiler Department,
34 - Turbine Department, 35 - Electric Department,
36 Department of thermal automatics and measurements, 37 - Fuel-transport Department,
38 - Chemical Department, 39 - Chief of administration, 40 - Hostel,
41 - Fuel station, 42 - Boiler room,
43 - Maintenance of buildings Department,
44 - Deputy Director for Personnel and Social Affairs, 45 - Shift manager.
Graphs are tree structures containing loops. Features of the built graphs are assessed by the following criteria: - the balance of the structure;
- the integrity of the structure; - controllability of the structure; - the structure stability.
These indicators are local criteria of effectiveness of the analyzed management structures. A group of the partial criteria that are formulated assesses each of the local criteria.
1. The balance of management structures is estimated by the following local criteria:
1.1. Information load at the highest level of the hierarchy - from the first head (director).
[image:3.595.309.544.246.292.2]In practice, it is widely used that a rational amount of information links from leaders at all levels of management activities is 7. When decision-makers have a larger number of connections, there is an overload of information and the effectiveness of management decisions falls. Let us take 7 for the optimal value of the number of administrative connections. Then for count "a" this feature will be equal to 1.43. The values of the local criterion for the other graphs are shown in Table 1.
Table 1. Local criterion – information load of the top management positions
Graph «a»
Graph «b» Graph «c» Graph «d»
Graph «e» 1.43 1 1 0.86 1
The criterion of optimization - minimum
Consequently, in the implementation of a standard management structure the Director will have administrative overload of 43%.
1.2. As the next local criterion we will take the value of the balance of the information traffic load among decision makers. These are the deputy directors and chief engineer. The results of the calculation of this index for the structures are shown in Table 2.
Table 2. Local criterion – the value of the balance of the information traffic.
Graph «a»
Graph «b» Graph «c» Graph «d»
Graph «e» 1.71 1.71 1.29 1.57 1.29
The criterion of optimization - minimum
According to this particular criterion, the best management structures of the others are Graphs - "c" and "e".
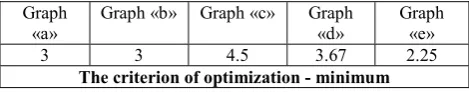
1.3. To improve the efficiency of the system it is necessary to seek to ensure that the information load is distributed evenly among all decision makers. Therefore, as the next local criterion we will take the index characterizing the degree of heterogeneity of the information load in the management structure that expresses the ratio of the maximum and minimum degrees of heterogeneity. The value of this local criterion is shown in Table 3.
Table 3. Local criterion – the degree of heterogenity of the information load.
Graph «a»
Graph «b» Graph «c» Graph «d»
Graph «e»
3 3 4.5 3.67 2.25
The criterion of optimization - minimum
The above analysis shows, that the perfect management structure for the degree of heterogeneity of the information load criterion must have minimum values of partial criteria - close to 1.
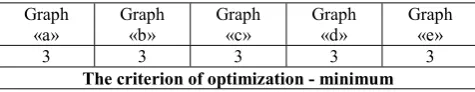
2. The integrity of the management structures will be evaluated by the following local criteria:
2.1. Number of graph centers.
Graph center - is the most important top, it is expedient to form the managerial decisions. Center of the graph minimizes the distance to the most remote peaks. The less centers the graph has, the more effective is the management structure.
Table 4 shows the number of the graph centers of the analyzed management structures.
Table 4. Local criterion – number of centers of the graphs.
Graph «a»
Graph «b»
Graph «c»
Graph «d»
Graph «e»
3 3 2 1 3 The criterion of optimization - minimum
Thus, in this particular criterion Graph «d» has the optimal management structure.
2.2. Diameter of the graph.
Graph diameter is the maximum distance between its two randomly selected vertices. It characterizes the compactness of the management structure - the shortest path connecting the two vertices. The preferred structure should have the smallest graph diameter.
Graph diameters of the analyzed structures are shown in Table 5.
Table 5. Local criterion – diameter of the graphs.
Graph «a»
Graph «b»
Graph «c»
Graph «d»
Graph «e»
5 5 5 6 5 The criterion of optimization - minimum
According to this criterion, the best structures are Graphs "a", "b", "c" and "d ".
[image:3.595.57.291.543.590.2]Graph radius is the minimum distance from any fixed vertex to all vertices of the graph. It describes the minimum length of administrative communications to the most distant elements of the organizational structure. The smaller radius the graph has, the higher is the compactness of the management structure. Table 6 shows the values of the radius for graphs of the considered management structures.
Table 6. Local criterion – radius of the graphs.
Graph «a»
Graph «b»
Graph «c»
Graph «d»
Graph «e»
3 3 3 3 3 The criterion of optimization - minimum
According to this criterion, the considered structures are equivalent.
3. Controllability of the structures is evaluated with the use of the following partial criteria:
3.1. The number of information channels through which management decisions are passed.
That structure has more control, when it has more links. The number of communication channels is the number of edges of the graph connecting distinct vertices of the management structure. Table 7 shows the calculated value of the number of information channels for analyzed management structures.
Table 7. Partial criterion – the number of information channels.
Graph «a»
Graph «b»
Graph «c»
Graph «d»
Graph «e»
61 64 58 42 57 The criterion of optimization - maximum
Based on the criterion of the number of information channels, the preferred structure is the one with graph «b».
3.2. The number of different closed control loops. The larger the number of the circular, closed information transmission control loops in the structure, the better is the controllability. The number of closed loops of the graph equals the cyclomatic number, which is determined by Euler's formula using the number of vertices and the number of edges by the formula:
Q Nn2 (1)
where: Q - the number of cycles, N - the number of edges, n - the number of vertices.
Table 8 presents data about the number of closed information transfer cycles for the analyzed management structures.
Table 8. Partial criterion – the number of closed information transfer cycles.
Graph «a»
Graph «b»
Graph «c»
Graph «d»
Graph «e»
24 25 19 11 19 The criterion of optimization - maximum
The perfect management structure for the above criterion should have maximum values – graph «b».
4. The criterion of the sustainability of management is estimated on the following partial criteria:
4.1. The value of the external sustainability. External stability is determined by the number of decision management solutions and a direct impact on all participants in the organizational structure. This criterion is determined by the amount of the key decision makers directly involved in the management of the enterprise. The higher the value of this criterion, the better are the reliability and stability parameters of the considered management system.
When the value of the sustainability is small, the system is controlled by a small number of decision-makers the leaving of one or two decision-decision-makers leads to loss of the controllability of the system.
Table 9. Partial criterion – the values of external stability.
Graph «a»
Graph «b»
Graph «c»
Graph «d»
Graph «e»
7 8 9 7 8 The criterion of optimization - maximum
4.2. The value of the internal stability of the system.
It is determined by the maximum amount of members that are not directly linked in the organizational structure. The more decision-makers are not interconnected, independent decision-making, the more stable the system would in the case of the loss of one or more persons who make decisions and do not have the opportunity to participate in management. A Bunches of graph vertices that are not adjacent to each other or independent determine the internal stability of the system.
Table 10 shows the values of the internal stability of the considered management systems.
Table 10. Partial criterion – the values of internal stability.
Graph «a»
Graph «b»
Graph «c»
Graph «d»
Graph «e»
32 33 32 27 32 The criterion of optimization - maximum
Analysis of the particular criteria of the internal stability shows that the best internal stability has the management structure graph «b».
Analysis of the partial criteria of efficiency of the created systems show that they (the partial criteria) give contradictory, unrelated assess of the effectiveness of a structure under study. This result is inherent to the multicriteria evaluation of the functioning of complex systems. Each of the local criteria evaluates certain aspects of the control system, without revealing its general law. Therefore, according to one local criteria system is the best, and for other worse. It is not possible to make a clear conclusion based only on partial criteria.
using the local criteria clotting, which is based on the analytic hierarchy process.
Applying Data Envelope Analysis (DEA) methodology [11-18] we construct the generalized functional of the following form:
mn mn n n n n kn kn n n n n U v u n X v X v X v Y u Y u Y u
f in jn
... ... max 2 2 1 1 2 2 1 1
, (2)
where n - number of management structure, ui )
... 2 , 1
(i k and vj (j 1,2...m) – positive weights that
characterize the relative contribution of each of the minimized and maximized local criteria of structures quality, Yi - maximized local quality criteria, Xj -
minimized local quality criteria.
The weights coefficient for the various structures are arbitrary and unclear.
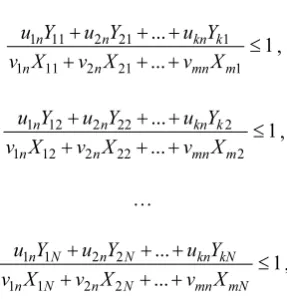
To find the particular value of the generalized criteria of the efficiency of the management structure we find the maximum of the functional (2) on the set of values of weights uin,vjnU for each of the structures under
constraints that determine the V - domain of values of weights ui and vj. Restrictions are formulated as
follows: 1 ... ... 1 21 2 11 1 1 21 2 11 1 d m mn n n k kn n n X v X v X v Y u Y u Y u , 1 ... ... 2 22 2 12 1 2 22 2 12 1 d m mn n n k kn n n X v X v X v Y u Y u Y u , … 1 ... ... 2 2 1 1 2 2 1 1 d mN mn N n N n kN kn N n N n X v X v X v Y u Y u Y u ,
where N = 5 - number of the structures;
5) … (1,2
i - the number of criteria that must strive to its maximum value, i (1,2…5) - the number of criteria that must strive to their minimum values.
A system of equations provides a solution in the form of a specific value - generalized criterion of the effectiveness of each of the management structures on the interval [0,1] and weighting values.
[image:5.595.107.251.384.534.2]Table 11 shows the calculated values of the generalized criterion of efficiency for each of the structures.
Table 11. Generalized criterion of efficiency.
Graph «a» Graph «b» Graph «c» Graph «d» Graph «e»
0.9868 0.8529 1 0.9049 0.9321
The above analysis of the generalized efficiency criteria shows that the least effective is the existing energy enterprises management structure, and the
structure "c" has the best performance of all of the analyzed management structures.
4
Conclusions
1. In the article there is given the technique of estimating the effectiveness of the management structures of industrial complexes, including industrial enterprises.
2. There are developed the local efficiency criteria of the management structures that characterize the most important properties - the balance, integrity, controllability and stability.
3. On the basis of the developed algorithm, using the methodology of the DEA, the analysis of 5 structures of the power plant management systems is made. As a result, the generalized criterion of efficiency that allowed to rank the considered management systems is obtained.
4. The generalized criterion of the comparative effectiveness is obtained. It allowes to rank the examined management structures by effectiveness and to identify the optimal one.
References
1. A.G. Salov, Proceedings of the higher educational institutions of the North-Caucasian region. Technical science, 1(143), 32-37 (2008)
2. N.V. Diligensky, A.G. Salov, Bulletin of the Samara State Technical University. Tehnischeskie science, (24), 17-25 (2009)
3. M.V. Posashkov, A.G. Salov, V.I. Nemchenko,
Problems of Economics and Management of oil and gas complex, 1, 27-32 (2014)
4. A.A. Gavrilova, A.G. Salov, Russia, as a
transforming society: economics, culture and management, 24-29 (2011)
5. E.A. Matveeva, A.R. Diyazitdinova, O.N. Chernyh, A.A. Gavrilova, Design of complex business objects based on the system analysis: Monograph (PGUTI, Samara, 2016)
6. N.V. Diligensky, A.A. Gavrilova, A.G. Salov, V.K. Gavrilov, Proceedings of the higher educational institutions of the North-Caucasian region. Technical science, 5(147), 37-40 (2008)
7. A.A. Gavrilova, Bulletin of the Volga University. Tatischev, 1(23), 11-16 (2015)
8. F.Harari, Graph Theory (KomKniga, Moscow 2006) 9. I.V. Prangishvili, A systematic approach and system
law (SINEG, Moscow 2000)
10. Th. Post, J. Spronk, European Journal of
Operational Research, 115, 472-487 (1999)
11. A.D. Athanassopoulos, N. Lambroukos, L. Seiford, European Journal of Operational Research, 115, 413-428 (1999)
13. A. Charnes, W.W. Cooper, E. Rhodes, European Journal of Operational Research, 2, 429-444 (1978)
14. A. Charnes, W.W. Cooper, A.Y. Lewin, L.M.
Seiford, The DEA Process, Usages and
Interpretations Data Envelopment Analysis: Theory, methodology and applications (Kluwer Academic Publishers, Boston, 1994)
15. A.T. Sik, A. Charnes, W.W. Cooper, Managerial and Decision Economics, 9(3), 251-253 (1988)
16. M. Lothgren, M. Tambour, European Journal of Operational Research, 115, 449-458 (1999)
17. Al–Faraj, Taqi N., Abdulaziz S. Alidi, Khalid A. Bu–Bshait, International Journal of Operations and Production Management, 13(9), 45-52 (1993) 18. A.O. Bafail, R.A. Aal, S.A. Karuvat, International