Solid-State Hydrogen Storage within a Proton
Battery and Its Performance Analysis with
Different Catalyst Loadings
Himanshu Jindal, Amandeep Singh Oberoi, Inderjeet Singh Sandhu, Mansi Chitkara
Abstract: Hydrogen has already been identified as a potential candidate capable of replacing fossil fuels because of its immense energy content compared to conventional fuels. However, finding the safe, efficient generation and storage of hydrogen is a challenge. The present paper reports on hydrogen generation and its subsequent adsorption-desorption process in a proton battery with varied catalyst loading. The method of porous carbon electrode fabrication and experimentation is disclosed. The scanning electron microscopy (SEM) is employed to determine morphology characteristics of the fabricated electrodes that are integrated in a proton battery to study the process of hydrogen adsorption and desorption under the influence of varied catalytic loading. The comparison between catalytic loading of 1 mg/cm2 and 2 mg/cm2 is analysed and reported. The hydrogen storage capacity of activated carbon electrode employed in a proton battery is obtained to be in the range of 0.4 to 0.5 wt. %. The obtained result proves the technical feasibility of a hydrogen generation and its subsequent adsorption in an ionic form within a proton battery. The obtained results contribute towards finding a sustainable alternative solution to fossil-based fuels for the global energy demand.
Keywords:Hydrogen Storage, Proton battery, Activated carbon, Prosopis Juliflora, Membrane electrode assembly
I. INTRODUCTION
The augmentation in energy demand in today’s world is due to the ever-growing technologies, population boom and largely developed societies [1]. Although fossil fuels are produced repeatedly in nature, they are non-renewable energy resources because the viable reserves can run out of fuel due to high demand of population [2]. Fossil fuel with high carbon content causes a lot of pollution in the environment [3, 4]. Therefore, the need of hour is research for alternate energy resource. As a step forward, the renewable energy resources catch the eye of numerous researchers to develop ecosystem friendly or cleaning devices. Intensive research and development strategies are being continuously made to enhance the quality of life without causing any harm to the nature.
The hydrogen is potential candidate as energy source and produced from a primary energy source such as solar energy, biomass that are renewable energy sources [5]. Hydrogen is an emission free fuel when oxygen is burned [6, 7].
Revised Manuscript Received on July 05, 2019
Himanshu Jindal, Chitkara University Institute of Engineering and Technology, Chitkara University, Punjab, India.
Amandeep Singh Oberoi, Mechanical Engineering Department, Thapar Institute of Engineering and Technology, Patiala, Punjab-147004, India.
Inderjeet Singh Sandhu, Chitkara University Institute of Engineering and Technology, Chitkara University, Punjab, India.
Mansi Chitkara, Chitkara University Institute of Engineering and Technology, Chitkara University, Punjab, India.
It can be used for powering vehicles or electrical devices in electrochemical cells or internal combustion engines. It has already been used in wide applications like powering fuel cell-based vehicles[7]. Hydrogen can be stored in the form of a liquid, gas or in the form of a chemical compound, known as electrochemical storage or solid-state storage [8]. However, gravimetric energy density (energy stored per unit mass of storage medium) and volumetric energy density (energy stored per unit volume of storage medium) differs in all these storage systems. In the liquid storage, one needs to maintain temperature below 21K [9]. In gaseous state, compressed hydrogen gas is stored in a pressurized vessel. A compressed hydrogen gas system has low volumetric energy density as compared to liquid hydrogen storage system [10].
Numerous nanomaterials have been tested for
electrochemical hydrogen storage which is considered to be the safest form of storage. Materials like metal hydrides [11], complex metal hydrides [12], Tetra hydro borate [13], palladium nanoparticles and decorated carbon nanotube; have reportedly shown some promising results in terms of hydrogen storage but, failed to meet the US Departments of Energy (DOE) target of 5.5 wt. % [14]. Activated carbon (aC) as a medium for electrochemical hydrogen storage offers to overcome the limitations of all other used materials for hydrogen adsorption because it comes with less atomic weight, ease of availability, higher internal surface area and low cost [15]. Most of the reported literature on hydrogen storage in materials like activated carbon and carbon nanotubes focuses on gaseous or liquid storage. However, the presented research work is a novel concept of hydrogen storage in ionic form (solid-state storage) within activated carbon. Few reported literatures throw light on theoretical study of hydrogen storage in activated carbon but, none of the published papers validates the theoretical results with experimental data in the form of solid-state hydrogen storage. The highest reported gravimetric energy density of electrochemical hydrogen storage is in the range of 1.0 - 1.28wt. % in ambient condition, which is well below the target [16].
On the other hand, a wild shrub namely Prosopis Juliflora tree is commonly found in Indian sub-continent which rather have turned out as problematic for the society. This tree grows at extremely high pace and its roots could travel as deep as 100 m in the ground to suck water. Hence, it is a threat to already
The amount of oxygen produced by this shrub is very meagre so, it is of no ecological importance and it has no medicinal use. The only useful product is wood which is rich in carbon and is suitable for energy storage.Carbon reportedly discouraged the formation of hydrogen gas and that is why it is suitable for electrochemical hydrogen storage. Unlike carbon, other materials with high BET surface area might favour hydrogen gas generation which is not desired in the present work. Hence, the presented work focuses on utilising prosopisjuliflora as a precursor for aC electrode which later is employed in a proton battery to measure its hydrogen adsorption capacity under varied catalytic loading.
II. EXPERIMENTAL
A. Material and physical measurements
The SEM images of carbon and aC are taken from central research facility at Indian Institute of Engineering and Technology,Ropar. The N2 adsorption/desorption analysis (BET) was used at 100 ℃ using an automated gas adsorption analyser (Quanta chrome AsiQuin). Pore size of the synthesised samples were calculated by using desorption branch of the isotherm of the Barrett, Joyner and Halenda (BJH) method. The synthesis of the material, fabrication of solid electrode and thereafter electrochemical charging discharging has been done at the Nano Materials Research Laboratory, Chitkara University, Punjab, India.
B. Synthesis of charcoal
Prosopis juliflora is easily and locally available in India. A fairly straight piece of wood from the mentioned shrub was cut into pieces as shown in the Figure 1a below. One of the obtained pieces was burnt down into charcoal in a controlled atmosphere using a laboratory hot air oven. The temperature of the oven was raised to 400 °C and maintained until smoke stops coming out indicating that charcoal is prepared. The sample was removed from the oven allowed to cool down at room temperature.
Fig.1(a): Prosopis juliflora wood Pieces
The charcoal sample was crushed into powder using a mortar and pestle shown in Figure1b and then charcoal powder was separated in to different microns by using mechanical sieve shaker. The aC 106 has particle size of 106
while fabrication of a solid electrode. Also, the electrode made from course particles of carbon is brittle. Whereas, carbon sample with lower particle size requires more binder that would have covered the pores of the carbon material. Therefore, aC 106 was chosen to fabricate a self-standing porous electrode.
Fig. 1(b): Charcoal powder of prosopisjuliflora
C. Charcoal activation
The activation is well known method to generating pore networks in carbons, the activation mechanism was not well understood due to complexity due to the large number of variables used in both the experimental parameters and reactivity of various precursors. The fine charcoal powder was then activated by adding potassium hydroxide (KOH) in the weight ratio of 1:1 and after mixing properly, material is placed in oven at 110° C for 4 h to obtain aC[19]. After that,
a weighted quantity of aC powder is mixed
withpolytetrafluoroethylene (PTFE) binder to obtained slurry mixture [20].
Fig.2(a): Hydraulic press used to press the mould
[image:2.595.308.547.126.296.2] [image:2.595.316.537.479.642.2] [image:2.595.59.281.506.679.2]Fig. 2(b): Mould with cavity filled with slurry mixture to obtain desired shape
D. Fabrication of a Proton Battery
The fabrication of proton battery consists of numerous components similar to a normal unitized regenerative fuel cell (URFC). The few modified components were: end plates, storage electrode, gas diffusion layer (GDL), and membrane electrode assemblies (MEA’s) (1 mg/cm2 and 2 mg/cm2). End plates were generally made from stainless steel. Hence, here we used SS316 stainless steel [21]. The characteristics of the end plates material are high
[image:3.595.55.284.50.199.2]mechanical strength, high thermal conductivity, low gas permeability and low mass. Flow channels were built to perform a very important role in fuel cell. In certain cases of operation of the reported proton battery, while working in the electrolyser mode gas diffusion layer (GDL) gets oxidised thereby, breaking the strands of the woven carbon fabric on the anode. In this scenario 1% catalyst perform better than 2%. However, to avoid the case in the presented work carbon cloth was replaced by titanium felt as GDL on anode side of the cell. It is worth mentioning that further increase in catalyst loading density would result in increased hydrogen gas generation rate which is not desired. The optimum 2% catalyst loading discourages the formation of hydrogen gas and hence provides a window to adsorb hydrogen physically as well as chemically. Iridium oxide (IrOx) and Ruthenium (Rux) catalyst are reported well suited for the water disassociation reaction and similarly, on the other hand, Platinum is best known for hydrogen reduction reaction. Trying any other catalyst was not in the scope of the presented research work. However, our future work would focus on alternate catalyst loadings. The novelty of the work is the storage of hydrogen in ionic form within a carbon-based electrode. Table 1 shows that the properties of characteristics of materials used for proton battery.
Table 1: Characteristics of proton battery used in the experiment
Oxygen side Membrane Hydrogen side Active area
Gas diffusion Catalyst Gas diffusion Catalyst
Sintered titanium form frit
Iridium oxide, 1.0 mg/cm2
MEA-1
ELAT-hydrophilic plain cloth
Platinum black, 1.0 mg/cm2
2.5×2.5 cm2
Sintered titanium form frit
Iridium oxide, 2.0 mg/cm2
MEA-2
ELAT-hydrophilic plain cloth
Platinum black, 2.0 mg/cm2
2.5×2.5 cm2
E. Electrochemical measurements
The single cell proton battery was used in Electrolyser (E-mode) and Fuel Cell (FC-(E-mode) mode with two different membrane-electrode assembly (MEA) named MEA-1 and MEA-2. Both the MEAs contained catalyst loading of different loading densities viz. 1 mg/cm2 and 2 mg/cm2, respectively. The cell was supplied with distilled water and electric potential was applied across the cell that splits water in oxygen and hydrogen. In the present work, E-mode is also referred to as charging and FC-mode as discharging.Electrochemical characterization was done with proton battery using activated carbon as working electrode. During E-mode the variable power supply was connected to the cell and voltage was increased stepwise. The resulted corresponding variations in current were recorded. The oxygen and hydrogen gas were produced and collected in separate cylinders for measurements. Whereas, in FC-mode the cell was connected to variable resistance load and load was varied as independent variable likewise voltage during E-mode.The corresponding voltage and current variation were recorded. Table 2 shows the parameters obtained
during charging of proton battery. The cell charged in E-mode was discharged in FC-E-mode for the two cycles using same electrode with different MEA’s. Table 4 shows the parameter obtained during discharging. Galvano static charge/discharge electrochemical measurements were used to evaluate the activated electrode hydrogen storage capacity with different catalytic loads.
Where,
‘I’ is charge/discharge current (mA) ‘t’ is the charge/discharge time (h) ‘F’ is Faraday’s constant (96485)
‘R’ is universal gas constant (8314 J/kg K) ‘P’ is absolute pressure of the gas (Pa) ‘V’ is the volume of gas (cm3), ‘m’ is the mass in kg and
‘T’ is absolute temperature (Kelvin).
[image:3.595.66.532.370.469.2]Table 2: Parameters during charging of proton battery
S.no Parameters during charging Value obtained during charging
MEA-1 MEA-2
1. Volume of hydrogen gas generated (V) 4.5 cm3 5 cm3
2. Current during charging (I) 270 mA 370 mA
3. Time of charging (h) 3.16 h 3.16 h
4. Mass of activated carbon (mc) 0.8 gm 0.8 gm
5. Total mass of electrode 1 gm 1 gm
Table 3: Mass of hydrogen produced in different stages
S.no Parameters Formula
used/Equation
Value obtained
MEA-1 MEA-2
1. Mass of total hydrogen generated (mth)
0.03183 gm 0.04362 gm
2. Mass of hydrogen gas produced (mhg)
0.00037 gm 0.00041 gm
3. Mass of hydrogen stored electrochemically (mhe)
0.03146 gm 0.04320 gm
4. Total mass of hydrogen produced 3.98 wt.% 5.45 wt.%
5. Mass of hydrogen entering to the electrode 3.93 wt.% 5.4 wt.%
Table 4: Parameters during discharging of proton battery
S.no Parameters during discharging Value obtained during discharging
MEA-1 MEA-2
1. Current during discharging (I) 45 mA 55 mA
3. Time of charging (h) 3.16 h 3.16 h
4. Mass of activated carbon (mc) 0.8 gm 0.8 gm
5. Total mass of electrode (me) 1 gm 1 gm
Table 5: Mass of hydrogen released during discharging
S.no Parameters Formula
used/Equation
Value obtained
MEA-1 MEA-2
1. Mass of hydrogen stored electrochemically and release during discharging (ms)
0.003358 gm 0.004104 gm
2. Mass of hydrogen released in electrode
0.33 wt.% 0.41 wt.%
3. Mass of hydrogen released in activated carbon
0.41 wt.% 0.51 wt.%
III. RESULTS AND DISCUSSIONS
A. Scanning electron microscopy (SEM) analysis
In Figure 3(a) SEM images of carbon and activated carbon were shown. Activated carbon, as shows, is not continuous and uniform throughout the sheet that can be related to its non-uniformity in the surface porosity. The activated carbon distribution cluster is shown in X3000 magnification in Figure 3(b). It can be claimed the particle size was 5µm that the holes in these clusters can be active sites for hydrogen dispersion as well as high interaction of activated carbon.
Fig.3(a):SEM images of carbon
Fig.3(b): SEM image after activation
B. Brunauer–Emmett–Teller (BET) analysis
The surface area as measured by the BET method (N2 gas adsorption/desorption on the surface of nanoparticles of C-106 is much lower than that of aC-C-106. The specific surface area of carbon is 161.219 m2/g after the activation of carbon, the BET surface area of aC-106 is increased to 205.886 m2/g. Due to high surface area of aC-106 it has lower mass than C-106 within a sheet in a particular area. Moreover, the pore diameter of C-106 and aC-106 are 3.698 and 3.337 nm respectively.
C. Charging results
The following results were obtained when the fabricated proton battery, was charged by applying the electrical potential across the cell in the voltage range between from 0-3.9 V. The cut-in voltage, where the water disassociation was observed to be started, was found to be 1.5 V. The produced oxygen during charging were allowed to move out of the cell through a provided flow channel in the end-plates and collected in a cylinder. The hydrogen further got split into ions viz. H+ and e- under the influence of the catalyst loading on the membrane-electrode-assembly (MEA). The proton battery was charged for 3.16 hours, until a rapid production of hydrogen gas was observed in the gas collection cylinder.
Fig.4:Comparative graph of proton battery with MEA-1 and MEA-2 showing the cell voltage vs current behaviour during
charging
The cell was initially at a low voltage to increase the probability of hydrogen entering the activated carbon electrode and discourage the formation of hydrogen. Figure 4 shows the voltage vs current graph of the proton battery in E-mode or during charging. It could be seen from the figure that the V-I curve showed a fairly linear behavior.It is to be noted that the plateau formed in the curve indicates the adsorption of hydrogen in the storage electrode either chemically or physically. In chemical adsorption process, hydrogen ions (H+) emerge at electrolyte membrane, float over the acid (liquid proton conductor), enter into the pores of carbon and form weak chemical bonds on the internal surfaces of the pores. In physical adsorption process, H+ ions are withheld physically in ultra-micro pores (diameter less than 0.7 nm) of carbon under the influence of Vander Waals Forces. The operation was ceased when the rapid generation of gas bubbles were observed in the gas collection cylinders indicating that the storage is full and all the produced H ions are combining with electrons to form hydrogen gas instead of electrochemical adsorption. In the case of MEA-2, as shown in Figure 4, it shows comparison to be comparatively higher catalytic loading of 2 mg/cm2 of iridium oxide and 2 mg/cm2 platinum black an earlier cut in voltage of 1.5 V.
Fig.5:Comparative graph of water consumption with time when proton battery was run in E-mode with MEA-1 and
Due to higher platinum catalyst, an early water disassociation reaction was observed thereby, liberating oxygen gas. In E-mode, the water was continuously supplied to the cell and hydrogen protons (H-protons) emerged on the membrane. Both the MEA’s are under clear observation here and it shows that for MEA-1 the water level is decreasing slightly from its source. But the MEA-2 graph represents sharper and much earlier fall in the readings due to higher catalytic loading of 2 mg/cm2 of iridium oxide and 2 mg/cm2 platinum black as shows in Figure 5. The water level decreases due to dissociation. This sharp downfall is in correspondence with the sudden increase in the hydrogen gas formation. This is due to the fact that MEA-1 carries 1 mg/cm2 which means the catalytic activity is normal in this case. But the MEA-2 graph represents sharper fall, platinum here being 2 mg/cm2.Therefore, the catalytic activity is more due to larger amount of platinum in the second case. Here, in this graph the result demonstrates that both the MEA’s have similarity in trend. The content of hydrogen release in the system is much earlier for the MEA-2 as shown in Figure 6. The reason to this is the higher catalytic loading in the MEA-2 that increases the reaction rate and hence, the release of hydrogen.
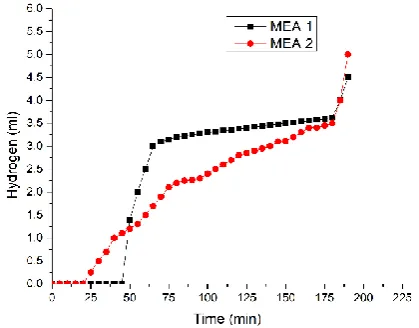
[image:6.595.321.526.524.674.2]Fig.6:Comparative graph of hydrogen gas production in E-mode of the proton battery equipped with MEA-1 and MEA-2
Fig.7:Comparative graph of oxygen gas evolution in E-mode of the proton battery equipped with MEA-1 and MEA-2 The content of hydrogen gives a sharp increase after some time, this is due to the saturation with hydrogen ions in the
MEA-1. Oxygen is released earlier in the case of MEA-2 than MEA-1 and this is due to the higher catalytic loading of the MEA-2, as shown in Figure 7. Although both the cases are overlapping in trend but MEA-2 has more liberation of oxygen in its case due to higher amount of platinum enhancing the water dissociation reaction. This is the main reason why the cumulative volume of the gas generated is higher in case of MEA-2. In the case of MEA-1 voltage increased gradually for 3.16 hours before getting stable and dropping down thereafter. There is a desirable stagnancy in the graph at 30 minutes from the start due to the hydrogen ions getting trapped in the electrodes. The bend signifies a slowdown in the reading of voltage. This is because the proton battery is getting charged by storing hydrogen in the storage electrode by the process of adsorption. The dip in the reading comes until the storage electrode is filled with the gas and adsorption is to the maximum limit. The MEA-2 receiving voltage for 3.16 hours and is very similar to the MEA-1 case. The gradual increase of voltage starts at 0.1 V to the maximum of 3.9 V. The aC electrode contains porous surface where the hydrogen H+ ions are stored to be used in the future for fuel cell mode. Now as it is clearly visible the MEA-2 started showing results earlier than MEA-1. This is because of the higher catalytic loading in MEA-2 that enhances the process of the dissociation.
D. Discharging results
In the FC-mode or during discharging process, the cell was connected to an electric load. The discharge time was recorded and the collection cylinder oxygen gas consumption was observed. Figure 8 shows the comparative current analyses over time of both the MEA’s. The weak chemical bonds of hydrogen atom with carbon break-up and hydrogen atom emerge from storage under the influence of the electrical load. The catalyst loading splits the hydrogen atom back into H+ and e-. Hydrogen ions (H+) returns back to cathode through polymer electrolyte membrane and e -travels through wires giving out electricity. At cathode, oxygen produced during charging is supplied back that reacts with H+ and e- to reform water.
Fig.8:Comparative current vs time graph of the proton battery
with MEA-1 and MEA-2 during discharging
[image:6.595.63.275.537.700.2]hydrogen ions from aC electrode after some time.
Fig.9: Graph showing O2 consumption over time during
discharging of the proton battery equipped MEA-1 and MEA-2, respectively
[image:7.595.51.248.62.230.2]Figure 9 clearly shown the MEA-1 and MEA-2 during discharging overtime that in the case of MEA-2 with higher density of catalyst loading the oxygen consumption was at higher rate during high reaction rate. Here, the decreasing graph is the consumption of the oxygen required in the fuel cell mode. Hence, the required oxygen consumption in MEA-2 is lower than MEA-1. This distortion signifies the consumption of the catalyst during the water disassociation reaction, oxygen reduction reaction (ORR) and hydrogen reduction reaction (HRR) in charging and discharging cycles of the proton battery.
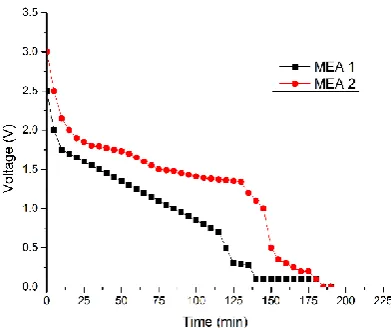
Fig.10: Voltage time graph for both the MEA’s
In the Figure 10 the voltage behavior over time during the discharge of the MEA-1 and MEA-2 equipped proton battery. The graph represents the discharging time voltage in progress. The MEA-2 is observed to start from a higher voltage reading than MEA-1. Voltage output in the case of MEA-2 is higher than the MEA-1. It was observed that MEA-2 was able to meet the load demand for longer duration than MEA-1 and exhibit high voltage than the latter. One probable reason for such behavior is high hydrogen reducing reaction (HRR) rate due to higher catalyst loading density compared to MEA.
IV. CONCLUSION
It is shown experimentally that prosopisjuliflora could serve as a precursor for activated carbon with a potential
application of electrochemical hydrogen storage. The hydrogen generation and subsequent adsorption-desorption processes in an experimental proton battery with an integrated hydrogen storage electrode was observed. The obtained results have shown the hydrogen storage capability of aC electrodes tested through adsorption-desorption processes. The two separate MEA’s with different catalyst loading were compared and the one with higher catalyst loading performed better in terms of water dissociation, hydrogen generation process, oxygen reduction and hydrogen reduction reactions. It is to be noted that the hydrogen adsorption shown in the present experimental study is an electrochemical adsorption i.e. hydrogen in ionic form is stored in the electrode which is the safest form of storage compared to conventional gaseous and liquid-based storages. Although the two MEA’s were containing varied catalyst loading of iridium oxide and platinum black that yielded feasible results but alternate catalysts are yet to be tested in the proton battery. Similarly, proton conducting mediums like protic ionic liquids and proton conducting gels may fetch better results.
REFERENCES
1. A. S. Oberoi, “Reversible electrochemical storage of hydrogen in activated carbons from victorian brown coal and other precursors,” 2015.
2. H. Minowa, Y. Yui, Y. Ono, M. Hayashi, K. Hayashi, R. Kobayashi and K. L. Takahashi, “Characterization of Prussian blue as positive electrode materials for sodium-ion batteries,” Solid State Ionics, vol. 262, pp. 216-219, 2013.
3. D. Bartlett, E. Gomez-Martin, S. Milliken and D. Parmer, “Introducing landscape character assessment and the ecosystem service approach to India: A case study,” Landscape and Urban Planning, vol. 167, pp. 257-266, 2017.
4. J. Wang and S. Kaskel, “KOH activation of carbon-based materials for energy storage,” Journal of Materials Chemistry, vol. 22, no. 45, pp. 23710-23725, 2012.
5. J. Bhandari and P. N. Dave, “Prosopis julifera: A review,” International Journal of Chemical Studies, vol. 1, no. 3, pp. 181-196, 2013.
6. A. S. Oberoi, “Hydrogen storage capacity of selected activated carbon electrodes made from brown coal,” International Journal of Hydrogen Energy, vol. 41, no. 48, pp. 23099-23108, 2016.
7. A. Celzard, V. Fierro, J. F. Mareche and G. Furdin, “Advanced preparative strategies for activated carbons designed for the adsorptive storage of hydrogen,” Adsorption Science & Technology, vol. 25, no. 3-4, pp. 129-142, 2007.
8. H. Shahin, S. S. Mohammadi, A. S. Oberoi and J. Andrews, “Technical feasibility of a proton battery with an activated carbon electrode,” International Journal of Hydrogen Energy, vol. 43, no. 12, pp. 6197-6209, 2018.
9. J. Puszkiel, G. Sebastiano, M. Chiara, G. Fabiana, K. Thomas, D. Martin and P. Claudio, “Tetrahydroborates: development and potential as hydrogen storage medium,” Inorganics, vol. 5, no. 4, pp. 1-24, 2017.
10. S. S. Mohammadi, “Investigation of a reversible PEM fuel cell with integrated metal-hydride hydrogen storage,” RMIT University, Melbourne, 2012.
11. K.-h. Young and N. Jean, “The current status of hydrogen storage alloy development for electrochemical applications,” Materials, vol. 6, no. 10, pp. 4574-4608, 2013.
12. D. J. Durbin and M.-J. Cecile, “Review of hydrogen storage techniques for on board vehicle applications,” International journal of hydrogen energy, vol. 38, no. 34, pp. 14595-14617, 2013.
[image:7.595.70.266.414.578.2]14. A. Mendez, . J. L. Teresa and A. H. Miguel , “Current state of technology of fuel cell power systems for autonomous underwater vehicles,” Energies, vol. 7, no. 7, pp. 4676-4693, 2014.
15. V. K. Kumar, A. Salih, L. Lu, M. A. Erich and F. Rodríguez-Reinoso, “Molecular simulation of hydrogen physisorption and chemisorption in nanoporous carbon structures,” Adsorption Science & Technology, vol. 29, no. 8, pp. 799-817, 2011.
16. T. K. Mandal and D. H. Gregory, “Hydrogen: a future energy vector for sustainable development,” Proceedings of the institution of mechanical engineers, part C: journal of mechanical engineering science, vol. 224, no. 3, pp. 539-558, 2010.
17. S. Sharma and S. K. Ghoshal, “Hydrogen the future transportation fuel: From production to applications,” Renewable and Sustainable Energy Reviews, vol. 43, pp. 1151-1158, 2015.
18. K. Mazloomi and C. Gomes, “Hydrogen as an energy carrier: Prospects and challenges,” Renewable and Sustainable Energy Reviews, vol. 16, no. 5, pp. 3024-3033, 2012.
19. M. Ni, “An Overview of Hydrogen Storage Technologies,” Energy exploration & exploitation, vol. 24, no. 3, pp. 197-209, 2006. 20. C.-H. Liao, H. Chao-Wei and C. W. Jeffrey, “Hydrogen Production
from Semiconductor-based Photocatalysis via Water Splitting,” Catalysts, vol. 2, no. 4, pp. 490-516, 2012.
21. S. Shafiee and E. Topal, “When will fossil fuel reserves be diminished?,” Energy Policy, vol. 37, no. 1, pp. 181-189, 2009. 22. N. A. Rusman and D. M, “A review on the current progress of metal