International Journal of Innovative Technology and Exploring Engineering (IJITEE) ISSN: 2278-3075, Volume-8 Issue-8, June 2019
Abstract: With the recent development in the cellular biology, the importance of RNA structure prediction has been tremendously increased. RNA has many important functions in cellular reaction. It plays an important role in protein as well as metabolic reactions. Also RNA structure prediction are useful to innovate newer methodologies for the treatment of many diseases like Tumour, HIV, Ebola etc. As a result many researchers are working in this area to invent RNA structure prediction algorithms. Almost in past three decades scientists have proposed RNA structure prediction algorithms. In this paper we are presenting a brief review of available RNA structure prediction algorithms. Also, we are presenting our newly developed algorithm for RNA tertiary structure prediction which uses parallel computing to speed up the computational processing. This newly developed algorithm is capable of predicting tertiary structure for very long sequences, where other existing methods face a problem of memory crash.
Index Terms: RNA tertiary structure, OpenMP, kissing pairs, base pairs, loop similarity.
I. INTRODUCTION
RNA is a very important type of nucleic acid present in every living organism. It consists of long chain of nucleotides. It comprises of a set of four common ribonucleotides which are the basic building blocks of RNA molecules. They are purines: adenine (A) and cytosine (C), and pyrimidines: guanine (G) and uracil (U). Based on the functionality RNAs can be categorised as Messenger RNA(mRNA),transfer RNA(tRNA), ribosomal RNA, Small
interface RNA(RNis), transfer messenger
RNA(tmRNA),non coding RNA(nsRNA),micro
RNA(miRNA) etc. These RNA has very important applications e.g. micro RNA(miRNA) are the short RNA sequences and are generally useful to standardize the genes in post transcription actions. They are having the ability to suppress the tumour and hence used as an oncogene (1-7). Interference RNA (RNAi) supports gene slicing mechanism, hence can be used in gene probing and drugs design (8,9), ribozymes has catalytic property and hence can be used against seditious disorder(10,11), Small RNA(sRNA) are useful to provoke or suppress virulence genes(12).
Revised Manuscript Received on June 07, 2019
Ujjwala H. Mandekar, Research Scholar, Deptt.of Computer Science & Engg. , Priyadarshini Institute of Engg & Tech.,Nagpur , India
Sunanda P. Khandait,Professor & Head of Information Technology Deptt.,, KDK Engineering College,Nagpur, India
Leena H Patil,Associate Professor,Deptt.of Computer Science & Engg.,Priyadarshini Institute of Engg & Tech,Nagpur , India
[image:1.595.311.545.317.480.2]Initially all nucleotides are in primary sequence and known as primary structure. These primary structures participate in base pairing formation using Watson –Crick pairing (A-U and G-C) and wobble pairing (G-U). The structure formed is termed as secondary structure. The secondary structure consists of loops like hairpin, bulge, internal loop and junction, some free bases at start and end as well as within the sequence and stems. Some of the free bases of secondary structure try to form base pairing among different hoops (kissing pairs) to form tertiary structure.
Fig. 1. Examples of secondary and tertiary structure motifs. The backbone is represented by the black line and the nucleobases by the light-gray short lines. Two light-gray lines facing each other represent a base pair.(Taken from ”https://www.fossilhunters.xyz/astrobiology -3/rna-monomers.html”)
In this paper we present a brief review of recent innovations in RNA tertiary structure prediction as well as present newly developed method for RNA tertiary structure. A growing amount of RNA sequence information is now available. The graph, in figure 2, displays the number of searchable RNA structures per year. Note: searchable structures vary over time as some become obsolete and are removed from the database. There are many experimental methods viz. RNA crystallography, Normal Mode Analysis (NMA) and chemical modification. But prediction using these methods is very time consuming. Hence more emphasis is given on computational approaches.
Computational Optimization and Analysis of
Functional Bioinformatics using Parallel
Algorithm
1907
Published By:
Blue Eyes Intelligence Engineering & Sciences Publication
[image:2.595.64.281.60.252.2]Retrieval Number: F3418048619/19©BEIESP
Fig. 2. Yearly Growth of RNA Structures (Data taken from http://www.rcsb.org/pdb/statistics/contentGrowthChart)
II. ANALYSIS OF ALGORITHMS FOR PREDICTION OF RNA
TERTIARY STRUCTURE
Structure of protein (13) specifies its function. In RNA also, the functionality depends on its structure. But there are numerous algorithms for protein structure prediction but RNA structures are not explored much. The numbers of algorithms available, for prediction of RNA structure are just countable by fingers (14).
Most of the prediction algorithms of RNA structure use knowledge base algorithms. It is observed that modeling using comparison based on sequence similarity predict the result more accurately. But the main constraint is the availability of experimentally more clear, accurate structure that can form template to predict new structure (15).
There are other methods like physics based approaches, but these approaches are not useful for long sequences. The accuracy of the predicted model decreases if the length of the sequence is increased (16).
But the hybrid approaches which are the combination of knowledge base as well as physics base can be used, if the required structure is splitted into small modules where each module is predicted separately and finally assembled to form required tertiary structure (17).
There are some well known programs those are capable of predicting tertiary structure using different methods.
A. MC-fold|MC-Sym
MC-Sym is a tertiary structure prediction method. Input to the algorithm is a secondary structure, which is calculated using the algorithm MC-Fold. It uses maximum base pairing. The same algorithm strategy is used for secondary as well as tertiary structure prediction. It uses free energy minimization approach. It collects secondary structures from nucleotide cyclic motif. (18)
B. iFoldRNA
This is an automated prediction algorithm for RNA tertiary structure. This algorithm is evolved in two versions: in earlier version (19) prediction of small nucleotide sequence was possible. But with availability of newer sequences with increased number of nucleotides, the algorithm is modified so as to predict the structure of the sequences with length in hundreds. (20). The algorithm uses
coarse-grained 3-bead RNA model (phosphate, sugar, nucleobase), for the prediction of 3D RNA structures.
C. ModeRNA
This algorithm uses coordinate geometry of the templates (known RNA molecule). Program uses sequence alignment technique to create structure for small models using the templates. (21)
D. MacroMoleculeBuilder (MMB; Previously RNABuilder)
This algorithm uses base pairing, stacking and torsion angles, and internal distance of associated modules of the template structure. After that, algorithm uses Monte Carlo (MC) simulation. (22)
E. FARNA/FARFAR
This method is based on de novo model where structure is predicted using available sequences (23). Input to the algorithm is primary as well as secondary structure. It uses coarse-gained one-bead model. It uses fragment assembly and Monte Carlo. The algorithm again modified in 2010 as FARFAR with some modified refinement(24).
F. RNA2D3D
Input to the algorithm is secondary structure. It uses all atom models with interactive manipulation. It performs molecular mechanics and dynamics. It allows coaxial stacking and manipulation of helical elements (25).
G. Assemble
Input to the algorithm is from the database of known fragments and motif. It constructs 3D structure using insertion of tertiary motif and permits manipulation of torsion angles. It is an interactive manipulation (http://www.bioinformatics.org/assemble/).
H. Vfold Model
This algorithm (26) uses a multi scaling method for prediction of free energy. The 3D structures are predicted using a 3D coarse-grained structure.
I. RNAComposer
RNAComposer is a web based prediction method. It is capable of predicting RNA structure maximum up to 500 nucleotides (14, 27). Here the input dot sequence is splitted into subsequences. The subsequences are matched with the tertiary elements present in RNA FRABASE database (28, 29). Algorithm combines matched tertiary elements automatically to get final tertiary structure.
J. 3dRNA
This (30, 31) is an algorithm that provides preset program for larger RNA models. The tertiary structure is calculated from small elements.
K. SimRNA
International Journal of Innovative Technology and Exploring Engineering (IJITEE) ISSN: 2278-3075, Volume-8 Issue-8, June 2019
. . [ . ( ( ( . [ [ . . ) ) ) ] ] ]
6
8 9
10 11 0
1 2 3
4 5
dots belongs to same loop hence no loop
formation formation
Base paired found
[ [ [ [ ( ( ( . . . ] ] ) ) ) ] ] .
III. NEW RNATERTIARY STRUCTURE PREDICTION ALGORITHM
This algorithm is specifically designed for long sequences of RNA. The algorithm works as stated below (34)
1. Input to the algorithm is secondary structure in the form of dot sequence, which is obtained from GTFold (35) algorithm. The dot sequence consists of set of {‘.’,’ (‘, ’)’}. Using this sequence the secondary structure is spitted into different regions based on the loops present in it. For simplicity we will call these regions as loop similarity objects (LS).
2. These loop similarity objects consists of many free bases which are the target elements that are taking part in tertiary structure generation (i.e. kissing pair formation). Hence all the dots (‘.’) i.e. free bases present in all loop similarity objects are exacted and grouped together to form a vector. Let ‘n’ be the count of number of free bases available in secondary structure.
3. Using the combined concept of divide and conquer (DAC) and Dynamic programming kissing pairs are formed as given below:
a. All free bases are converted into data objects
b. The complete data objects are divided into two halves using simple formula mid= (1+n)/2. (E.g. if there are 12 free bases present in a sequence, the mid is calculated as mid=6(=12/6)).
c. Hence loops are iterated from i. For I = mid down to 0(outer) ii. For j =(mid + 1) to (inner)
Check the possibility of paring as shown below:
d. Based on the paring formation, changes are made in dot sequence i.e. if dots are pair able replace ‘(‘ or ’)’by ‘[‘or ‘]’ respectively.
e. Next step is to find the similarity. The newly calculated sequence is stored back to original secondary dot sequence with modification made. The LS (loop similarity objects) are searched in PDB Meta file. There are more than 2753 Meta file present in PBD. The general format of PDB Meta file is as given below.
TABLE III. SAMPLE PDB META FILE
PDB ID:1Y86 STRANDS:A,B NUMBER OF MODELS:1 FUNCTIONAL CLASS:DNA
EXPERIMENTAL METHOD:X-RAY DIFRACTION
RESOLUTION:1.7
DEPOSITED IN PDB:2004-12-10
SEQUENCE &SECONDARY STRUCTURE IN DOT-BRACKET NOTATION
--- >STRAND_A
GCGUAUACGC
((((((((((
>STRAND_B
GCGUAUACGC
))))))))))
--- Every PDB Meta file contains PDB id, Strands, Number of models, Functional class, Experimental method, Date of deposition and Sequence - Secondary structure in dot-bracket notation. Associated with each PDB Meta file there is PDB file. Each LS is compared against all these Meta files to find 100% similar sequence. If similar sequence is found then their nucleotide sequences are matched. The unique PDB id of Meta file that gives 100% similarity in dot sequence and maximum similarity in nucleotide sequence is selected. In this way we get the PDB ids and similarity value of all the LS of the dot sequence. Average similarity value is calculated.
f. To get optimized similarity value the same procedure is repeated as shown below. This time the inner and outer loop are inverted
g. Step e is repeated to find average similarity value. If similarity is greater than previously calculated similarity, previous sequence is discarded and this new sequence is stored.
h. Mid is updated mid -1 and steps number c, d, f and g are repeated.
i. Final sequence will be the optimised result of predicted tertiary structure with maximum value of similarity.
IV. PARALLEL COMPUTING
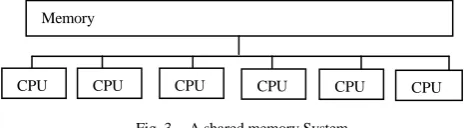
Nowadays OpenMP APIs are used for Parallel computing,
OpenMP APIs are designed for the system which works on the principle of shared memory as shown in figure 3(36). Using small efforts it is possible to parallelize control loops. In pparallel parallel computations either the jobs or the data can be divided among the available processor. In job fragmentation, job is divided in number of modules and each module is assigned to available processors; whereas in data fragmentation , same job is executed by all processor on available chunk of given data. In our algorithm, main emphasis is given on data
fragmentation.
dots belongs to same loop hence no loop
formation formation
No base pairing is found
Base paired found
6 8
9 10
11 0 1
1909
Published By:
Blue Eyes Intelligence Engineering & Sciences Publication
[image:4.595.46.281.54.118.2]Retrieval Number: F3418048619/19©BEIESP
Fig. 3. A shared memory System.
In the earlier version of algorithm (34) parallel techniques were applied for the whole process of calculation of tertiary structure. But, it was observed that in most of the samples the execution was increased as number of cores increases. The main reason is the extra overhead to splitting and collection of the data for every step in tertiary structure
1. To improve the time as well as space complexity parallel techniques are used. In tertiary structure development algorithm, to find loop similarity each LS is searched in all Meta files which is a time consuming procedure. Hence parallel techniques are applied for the search work using OpenMP API. Chunk of Meta files are given to each processor as shown in figure 4 :
Fig. 4. Parallel processing of algorith to find maximum loop similarity
2. While building tertiary structure i.e. PDB file more time is consumed in loading PDB files of corresponding PDB Meta file because of large sizes of PDB files (generally in MBs). Due to limitation on the size of RAM operating system has to perform multiple swapping to gather the required information from PDB data. This may lead to problem of “Memory Thrashing” (in which excessive paging operation takes place). To avoid thrashing, parallel technique is applied. Using tertiary structure generation algorithm, all kissing pair are calculated. Resultant sequence has the best average similarity value. As stated in algorithm, secondary structure is splitted into different regions depending on loops present. All the free bases present in different loops are extracted and tertiary structure is formed which is a set of elements = {‘.’, ‘(’, ‘)’, ‘[’, ‘]’}. For the creation of PDB file of said sequence, two lists are created i.e. list of LS and list of matched PDB ID.
Fig. 5. Mapping of loop similarity object with PDB vector.
For large value of ‘n’, swapping rate of PDB files from RAM to Hard disk with increase. Hence most of the tertiary structure prediction algorithm crashes for long sequence of primary structure. Solution to this problem is to use parallel technique.
[image:4.595.328.544.215.328.2]Many times it is experienced that one PDB Meta data file may map more than one Loop similarity object (LS). Hence instead of one to one mapping of LS and PDB id, a list of PDB ID is created, that stores the PDB ID and count of number of loop similarity object mapped in it. We call this list as ‘UniquePDBID’ vector as shown in figure 6:
Fig. 6.Mapping of loop similarity object with unique PDB vector.
[image:4.595.327.553.370.487.2]These PDBs are loaded on different core in multiprocessor system.
Fig. 7. Parallel processing of tertiary PDB file genration
Loops are iterated as below: for i: = 1 to count of PDBi for j:= 1 to Length of LSn
if (PDB ID of LSj == PDB ID of PDB file store in core Extract PDB data between required start and
end index.
In this way, we get the PBD data of each region of newly constructed tertiary structure.
Last step is to rearrange the PBD data to create PDB file. Each PDB file specifies the x, y and z coordinate of each atom of PDB elements. As we are gathering the PDB data from different PDB file it is necessary to normalize coordinated of each data block. For example if loop similarity object LS1 has coordinates from x1,y, z1 to x2,y2,z2 and LS2 has coordinates from x3,y3,z3 to x4,y4,z4, then in order to have continuity in building the tertiary structure the difference between x2,y2,z2 and x3,y3,z3 is calculated as dx, dy, dz respectively. This difference is added to all the respective coordinates of LS2. Same procedure is applied to all the loop similarity objects.
Memory
International Journal of Innovative Technology and Exploring Engineering (IJITEE) ISSN: 2278-3075, Volume-8 Issue-8, June 2019
V. RESULT
For example the PDB file of sequence “mobilio” is as shown in table II.
TABLE IV. SAMPLE TERTIARY HILE
--- ATOM 1 P A A 1 25.326 -2.536 4.871 1 0 P ATOM 2 OP1 A A 1 26.315 -3.137 3.956 1 0 O ATOM 3 OP2 A A 1 24.388 -1.501 4.384 1 0 O ATOM 4 O5' A A 1 24.421 -3.713 5.488 1 0 O ATOM 5 C5' A A 1 23.376 -4.256 4.705 1 0 C ATOM 6 C4' A A 1 22.293 -4.985 5.496 1 0 C ATOM 7 O4' A A 1 21.657 -4.199 6.5 1 0 O ATOM 8 C3' A A 1 21.225 -5.397 4.48 1 0 C ATOM 9 O3' A A 1 21.652 -6.602 3.851 1 0 O ATOM 10 C2' A A 1 19.958 -5.315 5.33 1 0 C ATOM 11 O2' A A 1 19.789 -6.456 6.161 1 0 O ATOM 12 C1' A A 1 20.266 -4.136 6.241 1 0 C ATOM 13 N9 A A 1 19.9 -2.756 5.912 1 0 N ATOM 14 C8 A A 1 20.692 -1.755 5.432 1 0 C ATOM 15 N7 A A 1 20.239 -0.549 5.596 1 0 N --
-- -- --
ATOM 4173 HO2' C A 133 21.581 29.37 1.169 1 0 H ATOM 4174 H1' C A 133 21.635 28.763 4.527 1 0 H ATOM 4175 H41 C A 133 16.383 26.168 6.783 1 0 H ATOM 4176 H42 C A 133 15.72 27.734 7.271 1 0 H ATOM 4177 H5 C A 133 16.838 29.826 6.721 1 0 H ATOM 4178 H6 C A 133 18.78 30.787 5.608 1 0 H ENDMDL
[image:5.595.318.546.50.157.2]The performance of algorithm is analysed on different core. It is observed that if the algorithm is executed on multiple core machines its performance enhances. The details regarding time taken by the multicore system is as given in table III. Graphical representation of result analysis is as shown in figure 8.
Fig. 8. Performance comparison of Algorithm using 1 core , 2 cores and 4 cores processor
From the table III, it is observed that almost half time is required if the algorithm is executed on 2 core as compared to single processor; whereas performance of algorithm is improved by 60 percent in some samples(e.g. in sample X00794.DOT). But it should be significantly noted that for the sample d.5.a.H.saccharovorum.dot time required for execution on single processor is 27.06 sec, for 2 cores it is reduced to 17.53 and for 4 cores it is 20.08 i.e execution time is increased when 4 cores are applied. The main reason is if the length of “UNIQUEPDBID”vectorislessthen less number of core gives better performance.
VI. TIME COMPLEXITY
It is very important to analyse the time required to compute tertiary structure. Let us revise the terms. For the formation of base pair conditions are:
i. If ith nucleotide forms a kissing pair with jth nucleotide then i and j should be from different loops.
ii. If (I,j) and (i’,j’) are pairable then i<I’<j<j’is prohibited i. e.
i i’ j j’
This pairing should be avoided. If you have more base pair, structure is more stable.
If OPT (i, j) represents the value of kissing pairs in tertiary structure that maximizes the number of pairs then the recurrence for OPT (1, n) can be given as
OPT (i, j) = 0 if i ≥ j and i, j belongs to same region Max {OPT (i, j-1),
1 + OPT (i, t-1) + OPT ((t+1), (j-1)) } where i<t<j
Hence procedure for compute OPT (i, j) will become For k= 2 to n-1
For i= 1 to (n-k) J=i+k
Compute OPT (i, j) Return OPT (1, n)
In worst case if ‘n’ operations are to be performed complexity of the algorithm will be O (n3).
File Name (dot) File Size (KB)
Seque nce Lengt h
Execution Time (sec) Simil arity (%)
2 Core Perfo rman ces (%)
4 Core Perfo rman ces (%) 1 Core 2 core 4 core
yeast_trna.dot 0.178 75 21.49 15.61 13.32 85.69 27.36 38.06 d.5.a.H.morrhuae
.2.dot
0.273 120 39.4 23.12 19.33 80.46 41.32 50.93
d.5.a.H.marismor tui.dot
0.281 122 31.24 21.81 20.97 97.28 30.18 32.87
d.5.a.H.saccharov orum.dot
0.285 123 27.06 17.53 20.08 93.75 35.22 25.79
d.5.a.H.morrhuae .1.dot
0.281 123 39.51 22.06 19.92 81.44 44.16 49.58
d.5.a.H.mediterra nei.1.dot
0.284 123 45.58 23.33 23.31 93.89 48.81 48.86
d.5.a.D.mobilis.d ot
0.297 133 28.05 17.79 15.83 89.31 36.57 43.56
X54252.dot 1.4 697 190.79 113.55 92.5 84.34 40.48 51.51 X54253.dot 1.4 701 133.75 84.43 70.29 85.63 36.87 47.44 Y00266.dot 2.5 1244 186.47 121.63 96.7 85.06 34.77 48.14 X98467.dot 2.6 1295 227.96 150.96 118.8
2
87.12 33.77 47.87
X65063.dot 2.8 1432 462.85 280.77 225.1 86.34 39.34 51.36 Z17210.dot 2.8 1435 242.387 155.01 127.7
1
90 36.05 47.31
X52949.dot 2.9 1452 203.95 122.56 98.3 89.89 39.90 51.80 K00421.dot 2.9 1474 220.99 145.47 115.4
3
87.59 34.17 47.76
Z17224.dot 3.1 1550 257.105 177.04 128.5 4
86.98 31.14 50.00
X59604.dot 3.3 1701 458.64 270.78 236.4 1
86.36 40.96 48.45
X00794.dot 3.9 1962 298.29 158.72 130.387.53 46.79 56.30 TABLE III. PERFORMANCE COMPARISON OF ALGORITHM USING
[image:5.595.46.289.107.364.2]1911
Published By:
Blue Eyes Intelligence Engineering & Sciences Publication
Retrieval Number: F3418048619/19©BEIESP VII. CONCLUSION
Recent research on RNA tertiary structure prediction algorithm using parallel techniques has provided a more complete understanding of the PDB files creation which is the key of tertiary structures. Current findings suggest that the parallel techniques improve the execution time for prediction of tertiary structure in most of the samples. However, the comparison on this newly created algorithm with existing algorithm is done based on average similarity calculated for the PDB file. Consequently, it is difficult for comparisons to be drawn between published algorithm and the proposed algorithm until a web-server based on the proposed model is developed. It is the future direction to establish user-friendly and publicly accessible web-servers. Thus, we will try our best to establish such web-server for maximizing the convenience of most experimental scientists. The algorithm is tested for different types of RNA. It was observed that it works for each type of RNA structures.
Acknowledgment
The authors thank Cao, S., and Chen, S. J for their work which motivated authors to develop new algorithm for RNA tertiary structure prediction.
REFERENCES
1. Calin G A et al 2002 Frequent deletions and down-regulation of micro-RNA genes miR15 and miR16 at 13q14 in chronic lymphocytic leukemia Proc. Natl Acad. Sci. USA 99 15524–9
2. Michael M Z et al 2003 Reduced accumulation of specific microRNAs in colorectal neoplasia Mol. Cancer Res.1 882–91
3. Takamizawa J et al 2004 Reduced expression of the let-7 microRNAs in human lung cancers in association withshortened postoperative survival Cancer Res. 64 3753–6
4. Hayashita Y et al 2005 A polycistronic microRNA cluster,miR-17-92, is overexpressed in human lung cancers and enhances cell proliferation Cancer Res. 65 9628–32
5. He L et al 2005 A microRNA polycistron as a potential human oncogene Nature 435 828–33
6. Metzler M et al 2004 High expression of precursor microRNA-155/BIC RNA in children with Burkitt lymphoma Genes Chromosom. Cancer 39 167–9
7. Tagawa H and Seto M 2005 A microRNA cluster as a target of genomic amplification in malignant lymphoma Leukemia 19 2013–6
8. Haasnoot J and Berkhout B 2006 RNA interference: its use as antiviral therapy Handb. Exp. Pharmacol. 173 117–50
9. Haasnoot J, Westerhout E M and Berkhout B 2007 RNA interference against viruses: strike and counterstrike Nat. Biotechnol. 25 1435–43 10.Breaker R R 2002 Engineered allosteric ribozymes as biosensor
components Curr. Opin. Biotechnol. 13 31–9
11.Sioud M 2006 Ribozymes and siRNAs: from structure to preclinical applications Handb. Exp. Pharmacol.173 223–42
12.Romby P, Vandenesch F andWagner E G 2006 The role of RNAs in the regulation of virulence-gene expression Curr. Opin. Microbiol. 9 229–36 13.Christian Laing And Tamar Schlick(2010), Computational approaches
To 3D Modeling of RNA, Journal Of Physics: Condensed Matter,Iop Publishing,Doi:10.1088/0953-8984/22/28/283101
14.Chojnowski, G., Walen, T., and Bujnicki, J. M. (2014). RNA bricks–a database of RNA 3D motifs and their interactions. Nucleic Acids Res. 42, D123–D131. doi: 10.1093/nar/gkt1084
15.Baker,D., and Sali, A. (2001). Protein structure prediction and structural genomics.Science 294, 93–96. doi: 10.1126/science.1065659 16.Magnus, M., Matelska, D., Lach, G., Chojnowski, G., Boniecki, M. J.,
Purta,E., et al. (2014). Computational modeling of RNA 3D structures, with the aid of experimental restraints. RNA Biol. 11, 522–536. doi: 10.4161/rna.28826
17.Bujnicki, J.M. (2006). Protein-structure prediction by recombination of fragments.ChemBioChem 7, 19–27. doi: 10.1002/cbic.200500235
18.Parisien,M., andMajor, F. (2008). TheMC-Fold andMC-Sympipeline infers RNA structure from sequence data. Nature 452, 51–55. doi: 10.1038/nature06684
19.Sharma, S., Ding, F., and Dokholyan, N. V. (2008). IFoldRNA: three-dimensional RNA structure prediction and folding. Bioinformatics 24, 1951–1952.doi: 10.1093/bioinformatics/btn328
20.Krokhotin, A., Houlihan, K., and Dokholyan, N. V. (2015). iFoldRNA v2: Folding RNA with constraints. Bioinformatics 31, 2891–2893. doi: 10.1093/bioinformatics/btv221
21.Rother, M., Rother, K., Puton, T., and Bujnicki, J. M. (2011). ModeRNA: a tool for comparative modeling of RNA 3D structure. Nucleic Acids Res. 39, 4007–4022. doi: 10.1093/nar/gkq1320
22.Biesiada, M., Purzycka, K. J., Szachniuk, M., Blazewicz, J., and Adamiak, R. W. (2016). Automated RNA 3D structure prediction with RNAComposerMethods Mol. Biol. 1490, 199–215. doi: 10.1007/978-1-4939-6433-8_13
23.Das, R., and Baker, D. (2007). Automated de novo prediction of native-like RNA tertiary structures. Proc. Natl. Acad. Sci. U.S.A. 104, 14664–14669. doi: 10.1073/pnas.0703836104
24.Das, R., Karanicolas, J., and Baker, D. (2010). Atomic accuracy in predicting and designing noncanonical RNA structure. Nat. Methods 7, 291–294. doi: 10.1038/nmeth.1433
25.Martinez H M, Maizel J V Jr and Shapiro B A 2008 RNA2D3D: a program for generating, viewing, and comparing 3-dimensional models of RNA J. Biomol.Struct. Dyn. 25 669–83
26.Cao, S., and Chen, S. J. (2011). Physics-based de novo prediction of RNA 3D structures. J. Phys. Chem. B 115, 4216–4226. doi: 10.1021/jp112059y
27.Popenda, M., Szachniuk, M., Antczak, M., Purzycka, K. J., Lukasiak, P., Bartol,N., et al. (2012). Automated 3D structure composition for large RNAs. Nucleic Acids Res. 40, 1–12. doi: 10.1093/nar/gks339 28.Popenda, M., Błazewicz, M., Szachniuk, M., and Adamiak, R. W.
(2008). RNA FRABASE version 1.0: an engine with a database to search for the three dimensional fragments within RNA structures. Nucleic Acids Res. 36, 386–391. doi: 10.1093/nar/gkm786
29.Popenda, M., Szachniuk, M., Blazewicz, M., Wasik, S., Burke, E. K., Blazewicz, J., et al. (2010). RNA FRABASE 2. 0 : an advanced web-accessible database with the capacity to search the three-dimensional fragments within RNA structures. BMC Bioinformatics. 6:231. doi: 10.1186/1471-2105-11-231
30.Wang, J., Zhao, Y., Zhu, C., and Xiao, Y. (2015). 3dRNAscore: a distance and torsion angle dependent evaluation function of 3D RNA structures. Nucleic Acids Res. 43:e63. doi: 10.1093/nar/gkv141 31.Zhao, Y., Huang, Y., Gong, Z.,Wang, Y., Man, J., and Xiao, Y. (2012).
Automated and fast building of three-dimensional RNA structures. Sci. Rep. 2:734. doi: 10.1038/srep00734
32.Boniecki, M. J., Lach, G., Dawson, W. K., Tomala, K., Lukasz, P., Soltysinski,T., et al. (2015). SimRNA: a coarse-grained method for RNA folding simulations and 3D structure prediction. Nucleic Acids Res. 44:e63.doi: 10.1093/nar/gkv1479
33.Magnus,M., Boniecki,M. J., Dawson,W., and Bujnicki, J.M. (2016). SimRNAweb:a web server for RNA 3D structure modeling with optional restraints. Nucleic Acids Res. 44,W315–W319. doi: 10.1093/nar/gkw279
34.Ujjwala H Mandekar, Leena Patil, Sunanda Khandait, Predicting RNA Tertiary Structure Using Parallel Algorithm, Helix ISSN 2319 – 5592, DOI 10.29042/2018-4088-4093
35.Amrita Mathuriya, David A. Bader, Christine E. Heitsch, Stephen C. Harvey(2009) GTfold: A Scalable Multicore Code for RNA Secondary Structure Prediction ACM 978-1-60558-166-8/09/03