Energ y StudiesReview Vol.14. No. :!. :!006 pp 189-:!06
Dating Breaks for Global Crude Oil
Prices and Their Volatility:
A Possible Price Band for Global Crude
Prices
HUEI
-CHU
LIAO and YU
-BO
SUEN
ABSTRACT
This paper applies thestructural changetestingmethod of Bai and Perron (1998, 2003 ) to the problemof locatingand ide ntifying significant changesin the global oil market. We use this method to investigate daily WTI spot prices from January 2, 1986 to December 30, 2004 as collected by the DOE. Our empirical results indicate that a significant structural change took place on Nove mber 12, 1999 . The averag e WTI price was U$19.02 per barrel before the structura l change and U$30.90 per barrel after the change . This highe r price may we ll reveal clues for revi sing the current price band as claimed by OPEC. Moreover, the issue of volatility is also examined by following the sam e method. We find two structural breaks for the price volatility, and price is rather stable in the middle period. This interesting result is valuable in evaluating the current argument regarding the more volatile world crudeoil prices.
.m:
classification: Q41Keywords: Crude oil price;WTI;Structural change; Vo latility
f-1l1ei-C/111 Liao andYu-Ba Suen are withtheEcono micsDep artm ent.TamkangUniversity. Tam su i.Taipe i.Taiwa n R.o.C.
190 EnergyStudiesReview Vol.14,No. 2.
1.INTRODUCTION
The WTI (West Texa s Interm edi ate) spot prices have hit record high s over and over agai n recentl y, evenjumping to U$73.73 perbarr el on April21, 2006.' Theserecord prices have hurt not onlythe econo mies of oil-importin g countries, but also the future benefit s of the major oil exporte rs . The oil exporters fu lly recogni ze that these peak s motivate and accelera te the development of oil-substituti ng techn ology,which may counte r the lon g-term dem and for their exports.
Although blam e for thesepricepea ks is eas ily placed on suc h traditional factor s as the rapi d demand growth from China and India, as well as tight production capac ity, political risks, and the depreciat ion of the US dollar, some expe rts have begun to doubt the ade quacy of these explana tions. Steve ns (200 I) conte nded that "mic ro-ma nag ing oil markets is becoming more difficult as the information deteriorates and the drivers of oil prices become unpredi ctabl e and at times, irrational (p2 12)." By analyzing the oil price figures in different period s from 1859 to 2002, Lynch (2002) pointed out that a decrea se in physical transparen cy has occurred in the global oil mark et due to the larger market share ofthird-world countries that are less acquainted with oil mar ketpracti ces. These critics both argue that thepath of oil pricesis cur rently very different from what it was in thepast,and thatthis may imply the existe nce ofsome structura lchang es. The empirica lwarrant for these argume nts can be established by usin g econome tric meth od s to exam ine the data to determ ine wheth er there were any structura l cha nges in theoil market.
There is an abundan ce of literature covering the topic of struc tura l change. The famou s Chow test(Ch ow, 1960 ) and Quandt's statistic (Quandt, 1960) have been used for many years althoug h objections to both of these meth od s havebeen rai seddueto thedifficultyin decid ingthepre-determined structur al turning point (Ch risti ano, 1992; Zivot and Andrews, 199 2; Ban erj ee,Lumsdaine,and Stoc k, 1992;Perron and Voge lsang, 1992). In the last decad e, Quandt's statistic has become more popular since Andrews (1993) and Andrews and Plob erger (1994 ) found a proper critica l value to repl ace the chi-squa re criti cal value,and, of course, there is also the P value calcu lated by Han sen (1997). However, all of these methods can find and also label only asing leturning point,and they are obviou sly not su itab le for cases involving multipleturningpoints.
l.iao&Suen /9/
Bai and Perron (1998) constr ucted a new meth od to find and test the significa nt structura l change for multiple turn ing points. This meth od has bee n applied to date structura l breaks in man y areas (Caporale and Grier, 2000; Hegwood and Pape ll, 2002; Rodrigu ez and Samy, 2003; Rap ac h and Wohar, 2005). Han sen (200I) claimed a significant rolefor thismethod , and Bai and Perron (2003 ) upgrad ed the required calcu lation skills whi le sho rte ning the calcu latio n time. We use the BP meth od to repr esent those contentsaddresse d byBai and Perron( 1998, 2003 ). Morerecent pap er sapply similar methods to find multip le break s in different time paths (Perron and Qu,2005;2006; Huang andChe ng, 2005 ).
In our empirica lwork, we use statistical meth od s developed by Bai and Per ron to estimate both thenumber and locat ion of struct ura l breaks ingloba l oil price series and their volatility. In the 1986-2004 WT I oil price sample, we findone sign ificantstructura l break inglobal oil prices, and two break s in relation to their volatility. After dat ing the breaks of the oil prices and their volatility,we draw from these interestin gpolicy implicationsinorde r tobuild aworldcrude price band that isaconce rn oftheoil mark et.
The rem ainder of thispaper is organ ized as follows. Section 2 present s the gen eral model developed by Bai and Perron. Section3describes specifi c datatyp es and their characteristics. InSection4,the breaks for oil prices and their vo latility are resp ecti velyfound. Section5 conc ludes.
2.METHODOLOGY
192 EnergyStud iesReview Vol. 14.No. 2.
the SSE will be minimized ifwe datethe exact structura l change break sfor a data series. This concept implies that the turning break s are selected by repeat edl y check ing all possibl e points according to the relevant significa nce level ofsome statistica l test. We illustratethis conce pt in Section 2. 1 and the corresponding threetestsinSection2.2.
2.1Model
The BP method (Bai and Perron, 1998; 2003 ) can be described by the equation below:
j
=
1,....nt+
1
,
T
o
= 0,7;
"
+
1=
T
,
where,
)'1: thedep endent variab leat timet,
Xl: a(pxl)vector,
"'"1' a(q XI) vector,
fJ
andrP
j arethe corres pondingvectors of coe fficie nts,[;1 isthedisturbance,
Tj could bethebeginnin g,the turning,or the end pointsofthewhole
observed period,
171 isthenumberof struc turalcha ng es,
j represent sregim ej;aregim e isasetof data between two turning
points,
T isthe samp le size.
Liao&SI/I'/I /93
The eleme nts invectorx, rep resent those factors unaffected by struct ural
change over time, while the eleme nts in vecto r ::, are those facto rs affected
by struc tura l change. Whe n p equa ls zero (i.e, no.v.), we obta in a pure
structura l change model where all the coeffic ients are subject to structura l chang e .
The method ofestima tion considered is that based on the least squares principle. For each 111 regimes(T1, .•.,~I/) ' the associated least squares estima tes of
13
and¢
j
are obtain ed by minimizin g the sum of squared residual s as below :111+1 T
I
t
[
y , -
.
<13
-
::;
¢
)
]
2
)=11=1', _1+1
(2)
~ ~
Let
.$
(
{T)})and¢
(
{Tj } ) represent the estima tes based on the given 111regim es (~,.. .,T,I/ ) den oted {Tj}. Substituting these in the objecti ve
function and the resu lting sum of squared residual s IS denot ed
~ ~
as
S
T(7;
,.
..,
~I/),we ca n estimate thebreak points (~,.. .,~I/) by followingthe sug ges tion by Bai and Perron (1998, 2003 ). The n the regression
paramet er estimates are the estimates associated with the 111 regim es{T)} ,
,.. "' ''' "" "' ''
i.e.
13
=
j3( {Tj} ) ,¢
=
¢UTj} ) .2.2 Teststatistics for multiple structural changes
194 EnergyStudiesReview Vol.14.No.2.
2.2.1 Sl/pF test
In a way sim ilar to the F test, Bai and Perron (1998, 2003) used the Supl:testto consid er theproblem of asymmetr y. The nu ll hypothesisof the Supl: test isdefined asno turningpoint (i.e.m=O,no structural change),and
thealternativehypothesis isdefin ed askturningpoints(i.e.m=k,mstructural
changes). Letting
(T;
,.
..,
T,II) represent the divid ed inter val s, and)cj =
T
j /T
,
j =1
,
2
,.
..
,111,thenT
;
=[T)cj](.J=1
, ...
,
k)
,
and thus we can define,F (1 1 ' . ,
-..!..
r -(k +l)q-p ;" R'( R I/(;' )R' -IR;' (3)'r / 'I ,A 2" " '/'k,q )- r ( 1 )y/ If' ) y/,
l,q
estima te of the variance
where R IS the conventional
(R¢)'= (¢I'-¢l " "" ¢k'- ¢H'). V(¢) IS an
matrix suc h that
A
cov ariance matrix of
¢
that is robust to hetero skeda sticity and serial correlation. Finally Bai and Perron defin ed the Supl:typ e test statistic asshow n belo w (p.12,Bai and Perron, 1998):
A A A
Supl:r(k; q )
=
Fr()"i' A1, ·.. ,Ak;q), (4)A A A
where (AI')c2,...,)ck ) minimizes the globa l sum ofsquared residua ls under the spec ifie d trimming.
2.2.2Doublemaximum test
Bai and Perron (1998,2003) propose two tests of the null hypothesisof no structur al break against an unknown number of break s given some upper bound M. They call these the double maximum tests. The
U
D
maxandWDmax are defined as
A A A
U
D max F
r
(M
,
q) =
maxF
r(
A
I, ) c2, ...,
A
k;
q
),
1';/11';'\/l.iao& S/I('1/ 195
(6)
The difference bet ween
UD
ma x andW
D
ma xis the weights, whereUD
ma x ' s weight is unity, andr
VD
max's weight settingc(q,
a,
111)denotes the asymptotic critical value of the test" " "
F
r ()." ).2" '"A
k;q) for a significanc e levela
.
The weight s are thendefin ed as (/1 = I and for m>I as (/11/ = c(q, a
,
1)
/
c(q, a,111). Inothe r words,when the obvious cand ida te is to set all weight s equa l to unity,we label this version of the test as the
UD
max test. Furthermore, if we consi de r a set ofweight s suc h that the margin al p-valu es are equa l across values of 111 , we
labelthistestthe
WD
max test.2.2.3 Sequential tests
The sequentia l test
Supli;
(
e
+
1
1()
is the third test, which is moreimportant than the previous two tests. Bai and Perron ( 1998, 2003) present a testfor Cversus C+
1
break s,labeledSupli
;
(e+
1
1
C).Basicall y, itamounts to the application ofe
+
1 tests ofthe null hypothesis of C structura l breaks against the alterna tive hyp oth esis of C+
1
brea ks. If theSllpF
r(e+1
1
C)statistica l test is significan t, then there are at least ( + 1 struc tura l turning
points. In our results, we presen t the estimates based on the seque ntial method, in orde r to determine the param eters of the model and the break
points.
Bai and Perron (2003) reco gni zed that all of the above test s have their
advantage s and disadvantage s,and they sug gested the best wayof combining
these three tests. First of all, an investigation of the existe nce of structura l
change requires that one first chec k whether the
Supl:
test and the Doublemaxtest are significant or not. Next, it is essentia l to use a seque nt ial test to
determ ine the numbers related to struc tura lcha nge. This suggestion help s us
date the right struc tura lbrea ks much more easily .
3. DATAANDDATACHARACTERISTICS
There are numerous indicatorsofcrude oil prices. We chose WTI (West
Texas Interm edi ate) crude oilspot pricesas oursample data since the WTI is
the most fam ou s and wide ly used benchmark price and forms the basis of
196 EnergyStudiesReview Vol,14.No.:!,
in compa rison with many other prices, WTI data can be easily acq u ire d from the web sites of the U.S. DOE (Departme nt of Energy) without cha rge. Finally ,the closel yasso ci at ed derivati veproducts(i.e. the WTIfuture sprices )
are also a likel y target of research on related issues that we antic ipate looking
intoin the nearfuture.
With these adv antag es in mind,we proceed ed to collect 4,799 WTI spot price data sam ples from the EIA (En er gy Information Ad ministratio n) ofthe
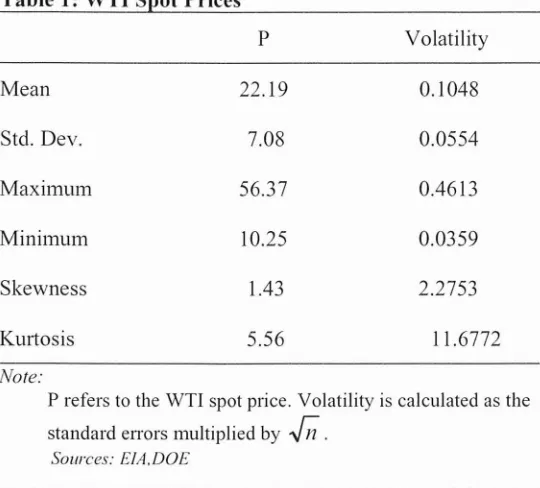
DOE,beginning on Janu ary 2, 1986and end ing on Dec ember 30,20 04. The sample cha racte ristics are su m ma rize d in Table I. Over this 19- year period,
the mean of the WTI spot prices is U$22.1 9 per barrel with a maximum of
U$56.37 per barrel and a minimum ofU$I0.25 per barrel. The mean of the volatility of WTI spot prices is 0.1048, with a maximum of 0.4613 and a
minimum of 0.0359. The other statistics also help usto env isio n an accurate picture of the cha nges in globa l crude oil price sduring thisperiod. It should be noted that vo latility is ca lc u latedas the monthly sta ndard erro rs multiplied
by
,J;;
(11 isthe sam plesize for a month),which isillustrat ed in Section 4.2.Thus,we acquire d only 228 sam ples of datafor vo latility.
Table 1:WTI Spot Prices
p Volatility
Mean 22.19 0.104 8
Std. Dev. 7.08 0.0 554
Maximum 56.37 0.461 3
Minimum 10.25 0.0359
Skewne ss 1.43 2.2753
Kurtosi s 5.56 11.6772
Note:
P refersto the WTI spot price. Volatility iscalculatedasthe
standa rderrors multipliedby
,J;;
.
Lillo&SI/CI/ /97
4. DATI NG STRU CTU RA L BREAK S FOR THEGLOBAL OIL PRICE
AND ITS VO LA TI LITY
We applied the meth od illustr at ed in Section 2 and used the 4,799 daily
WTI data samp les and 228 standa rd erro r samp les to date the breaks for the
WT I price and its volatility,respecti vely.
4.1 Dating the breaks for WTI prices
To implem ent the above regression ana lysis for oil prices, we need to chec k the relati on ships amo ng the variab les in more detail. In a way similar
to the paper by Rap ach and Wohar (200 5), we are unabl e to find sui table
breaks afterwe mix ourprice variable with mor e ofthe othe r variab les dueto
the inconsiste nt trend . Whe n cons ide ring the world oil mark et, the
indep end en t varia b les (e.g., world dem and and world supply ) apparently
move very incon sisten tly in relation tothe world oil price. Ther efor e,Eq.(7)
below is more suitable whe n it comes to analyzing the issue of oil price
struct ura lchanges.
(7)
for j
=
1,...,171+
1, where P, is the spot price of West Texa s Inte rm edi atecrude oil in period
r
,
II, is the erro r termand coeffi cient¢
can be regarded .Ias the average spo t price, i.e.
¢
j
(j=
1, ...,171+
1) is the mean spot price inthe j th regime. The 171
+
1 reg imes will be found for our observed oilpriceifthereare 171 turningpoin ts.
By app lyi ng the least squa res meth od of our model setti ng based on Eq. (7), the globa l sum of squa red resid ua ls is calcu lated by partitio ning the oil
price series into 171 regimes (
T..
,
...
,
T,
I/
)
as below :I/I~I T,
SSE
T(T..
,
oo .
,T"J
=
L L(p
,
_
¢)
2
.
j=1r=TH -1
198 EnergyStudiesRevi ew Vol. 14. No, 2.
The regression coefficients are estimated after we find the best model
since global SSE will be minimized in case of a correct structur a l change.
The complete description of this model isarticulated in Baiand Perron (1998, 2003 ).
It sho uld be noted that the model in Eq. (7) is different from the
traditional ANOYA analy sis or t test, although it is sim plified to a simple
location sca le model. This is because we focus on dating the breaks of a
series of data,since we need to find a minimal SSE va lue by cons ide ring all possible combinations ofevery kind ofpartition for a data series. Therefore
we use the
Supl:
test instead of the F test used in the traditional ANOYAanalysis, which emphasize s the test for the significant differences betw een
two groups or among more than two groups. Therefore,our testing method will be much more complicated than the traditional AN OYA analysi s as
illustrated in Section 2.
Table 2: Test for Structural Breaks
5llpF test 511pFr(C
+
1
1
C)test511pF(1) 10.68**
C
=
1 5.215llpF (2) 9.30**
C
=2
2.765llpF (3) 7.75**
C
=3
0.295llpF (4) 9.17***
C
=4
0.06511pF(5) 7.54***
UDmaxtest 10.68***
WDmax test 18.88***
Note :
I. The maximum number of breaks. M, is set to be 5 and the
trimmingpercentageischosento be 15%of the sample size.
Lillo&Suen J99
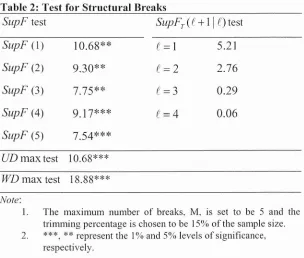
The results reported in Table 2 are estimated using three tests that are addressed by Bai and Perron (1998, 2003) to find significant structural
changes for WTI prices. Toimplement the
S
upl:
test, the investigator needsto pre-specify a part icular number of breaks in order to make a statistical inference. Thuswefollow the quantitativerecipe sugges ted in theBP method and assume there are at most five turning points in our first testing regime.
This means
5
11p F
(111), 111=I, 2,3, 4, and5. Theoutcomes inTable 2 showthat all of the
S
upl:
and Double maxtests are highly significant,andwe canthusdefinitely find at least onesignificant structural breakin our data series. In orderto grasp the number ofstructural breaks,we needto implement sequential tests. The right-hand side of Table 2 shows that
5upF
r
(211)=5.21, which is much smaller than the 5% criticalvalue 10.13 and the 10% critical value 8.5 1. This insigni ficant result fails to supplyevidence to support a claim regardin g the existence of a second struct ural break. We can thus conclude that there is only one significant structural
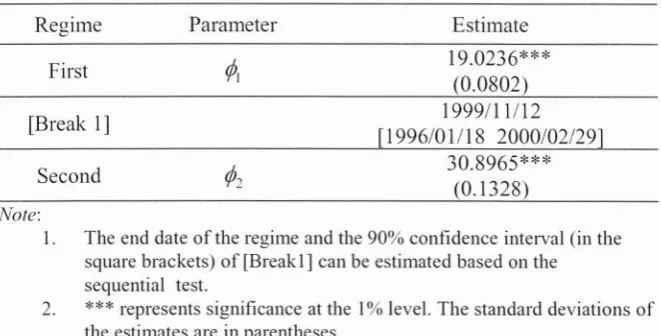
change in the period from January 1986 to December 2004. Based on these results, we locate the date ofthe break as November 12, 1999, as shown in
Table 3. The 90% confidence interva l ranges from January 18, 1996 to February29, 2000.
Table 3: Esti ma tion ResultsoftheSt r uct ur alCha ngeModel Regime
First
[Break I]
Second
Parameter Estimate
19.0236***
(0.0802)
1999/11/12
[ 1996/0I/18 2000/02/29] 30.8965***
(0.1328)
Note:
1.
2.
Theenddateofthe regimeandthe90%confide nce interval (in the square brackets) of[Break 1]canbe estimatedbasedon the sequential test.
***represents significanceat the I%level. The standard deviation s of theestimatesare in parentheses.
Table 3 also provides the average pricesinbothoftheperiods separated
200 EnergvStudiesReview Vol./4. No.2.
the structuralchange and U$30.90 afterwards. This result can be verified by an examination of the price trend in Figure I and also supports the recent
contentioninreportsfromArgus that state:"Crude priceshavenearlydoubl ed
since the nineties. In the 10years before the Asian financial crash of 1998,
WTIaveragedjust under $20/bl. But the average roseto over $28/bl in 2
000-03 and it reached $35/bl in the first quarte r of this year.t" Lynch (200 1) argued that U.S.wellheadoil prices have undergone a structuralchange . He
found this price was about U$15.50/barrel in the period 1900-70, in
significant contrast to that of U$23/barrel in the subsequent period of 1 970-2000.
60 . , . - - - -- - - ,
50 - ---
-::D 40
---€A
~ 30
-u
';3. 20 p~"ft"'''''IfI!J,~~~~...,,.VA!IlL,,,I!M\:'''*'''''.,p_
10
0N...- - - -...
o o
-o
00
o-'T 'T <n 'T 0 ("'1 0 r- r- 0
("'1 0 0 r<) N N M
N N 0 0 0 0 0 N
r- e- M <n r- c- M 'T
00 00 e- c- c- e- c- o 0 0
c- c- c- c- c- c- e- o 0 ~ date
N N
Figure 1:WTI spot pricesand means in different period s,
4.2 Dating the break sfor WTI price volatility
This section uses the same method to investigate the problem of price volatility. The most popular way of measuring price volatility is to examine the variance fordifferent data series. Here, we measure volatility following the suggestionof Schwert (1990). Itis calculated bymultiplyingthemonthly
price standarderr orsby
J;;
(where 11 is thesamplesizefor amonth). Thuswederiveonly 228 sample data (standarderrors) toimplement ouranalysis of
price volatility. Based on Bai and Perron'smodel,Eq,(7) can berewritten as
Eg.(9)below:
PV = 8I .I.+eI t
=
T
i_1+
1
,
...
,
T
i,
l.iao&Suen ]0/
(9)
where
0.50
0.45
0.40
--:0.35
Z
~O"O
.J~0.25
~0.20
0.15
0.10
0.05 0.00
P
VI :volatility forWTl spot prices,8
;
:
averagevolatilityof WTI,.i
=
1,...,I1l+
I,el : error terms.
Figure 2: The volatilityof WTI spot prices,
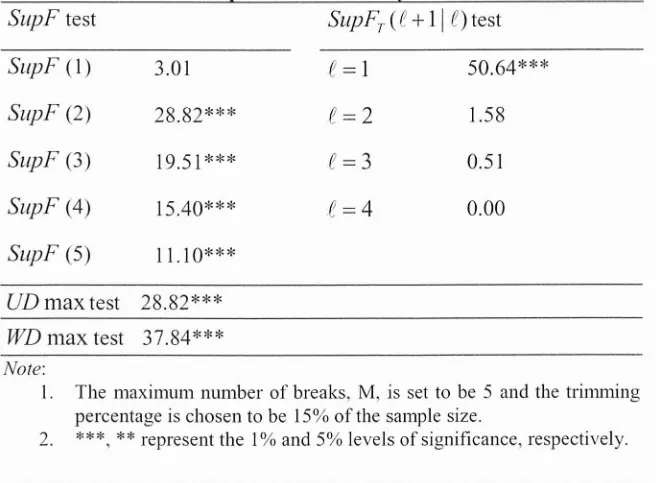
The empirica lresu lts show n in Table4 indicate that both the
S
upF
test and Double max test are significa nt, whic h imp lies that ther e is at least onesignifica ntstruc tura lcha nge for pric e volatility .' In add ition,the ins ignificant
SupF
r
(312) and 1% sig n ificantSup
F]'
(2I
I) strong ly suggest areading in3Itispossible to find an insignificant Sup F(I) but significa ntSup F(2).Sup F(3).Sup F(4 ).
202 Energy StudiesReview Vol. /4.No,2.
which there are two sig nificant structural breaks for oil price volatility. Figur e 2 reveal s this phenomenon, and Table 5 provid es us with more information. We can date the two breaksas March 1991 and December 1995, and the 90% confidence inter val is found to range from January 1991 to Decemb er 1992 for the first break, and from Novemb er 1994 to March 1996 for the second break. Dividing by these two break s, the vo latility measurements in the three regimes are 0.124 8,0.06 7,and 0.113 , resp ecti vely .
These three digitsindicatethat priceswere more vo latile in the first and third regimes, but more stable in the second regime. Suc h an outcome may well have some bearing on the merit and scope of the rec ent arguments regarding
the relative stee pness of the path of oil prices.The consistenc y of our result s
depends upon the accuracy of our dating of the structuralbreak s.Obviously, no significant price vo lati lity would be found ifwedid not dateour break for our obser ved period.
Table 4: Testsof WT! Spot Price Volatility forStructural Breaks
SlIpFtest SlIpFT(C
+
II
C)testSlIpF (I) 3.01
C
=
1 50.64***SlIpF(2) 28.82***
C
=
2
1.58SlIpF (3) 19.51***
C
=
3
0.51SlIpF (4) 15.40***
C
=4
0.00SlIpF (5) 11.10***
UDmaxtest 28.82*** WDmax test 37.84 *** Note:
I. The maximum number of break s, M. is set to be 5 and the trimming
percenta geis chos en to be 15%of the sample size.
l.iao&.'II/I'I/ ]03
Table5: Estimation Resultsof the St r uct u r a lCha nge Mode l
Reg ime Parameter Estimate
First
[Break I]
Second
[Brea k2]
Third
Note:
(),
.'
0.1248***
(0.0064)
1991/03
[1991/011992/1 2]
0.0670***
(0.0067)
1995/12
[1994/11 199 6/03]
0.1130***
(0.0049)
1. Theend datesoftheregim es andtheconfide nce intervals
(in the squa rebracke ts) of [Break 1] and [Break 2]can be estimated based on the seque ntial test.
2.
*
**
representssignifica nce at the I%level. The standarddeviation s ofthe estimates are in parenth eses.
4.3 Policy implications
The empirical results in the precedin g section not only indicate the
existence of a significa nt structural cha nge ingloba loil prices,butalso shed
some light in understanding the globa l price level in recent years . There are
man y argument s regarding the price band ran gin g from U$22 to U$28 per
barr el announced at the March 2000 OPEC meeting. In orde r to contro l
mark et prices, OPEC wou ld increase production if prices were to rise above
U$28 for more than 20 days and wou ld decrease production if they were to
fall below U$22 for more than 10 days. However, OPEC only applied this
mechanism once in October200 I and neverused itagain."
There is some consensus that the range U$22- $28 involves a price
premium of between U$3 and U$9 (as U$22 equa ls U$19+U$3 and US28
equa lsU$19+U$9) dueto OPEC'smono po lypower.' Onth isassumpt ion it is
not unreason abl e,based on our calculation,tosee the contex t in which OPEC
4Moredetailedinformationcanbe foundfromthewebsiteofthe EIA.DOE.
s522-528 isthe price ofthe OPEC packa ge. wh ich is alway sbelow WTIduetothe inferior quality. Thusweusetheexpected OPECpackage as arep lacem entfortheOPECpack age
204 EnergyStudiesReview /'01./4.No.2.
can set its new price band rang ing from U$34 (equals U$3I+U$3 )to U$40
(equ als U$3 1+U$9 ), nor is it unrea son abl e to infer that , because March 2000
was very close to our calculat ed break for the structura l chan ge in oil prices
(No vember 12, 1999), the current price band was most likely dete rmined by
theaverageoilpricebeforethe structur alchange took place. If we accept this
generaliza tion regarding the earlier price band, then a new price band based
on the average price afterthestructura l change shouldalso beapplicable.
Moreover, the well-known fact that globa l oil prices became more
volatileafter 1995 migh t suggest to some researcher sthat we should expand
the width of our tolerable price range. For example, the price band in the
above subs ection may be exte nded from U$34-U$40 per barrel to a larger
band suc h asU$32-U$42per barrel. Although ourca lculated volatility in the
third regime(December 1995to December2004) is almost twicethe volatility
in the second regime (March 199I to December 1995), it is hard for us to
conclude that theprice band sho u ld beso exte nde d (nearl ydoubled ), since we
are not able to find a reasonable relationship between our calcu latio ns of
volatilityand the range of thepriceband.
5.CONCLUSION SAND FURTHER RESEARCH AREAS
Globa l oil prices remain one of the most visible of all historical
commodity records, yet while more and more people beli eve wehave entered
a new era with much higher pricelevels,no one has been ableto tell preci sely
and withmuch confidenc e the exac tstructur al break in the glo bal oil market.
Our paper has applied the multip le structural change method of Bai and
Perron to the problem. and has succes sfully located and dated the breaks for
both theprice of oilaswell asits volati lity. We havefoundthat thebreak for
thestructuralchange inoilprices occurredon November 12, 1999,where the
average oilprice was U$19.02 per barrelpreviously and U$30.90afterwards.
Wehavealso found two breaks for oilpricevolati lity,onein March 199I and
one in December 1995. Bydividing bythesetwo break s,the volatility can be
measur ed in the three regimes as 0.1248,0.067,and 0.113, resp ectivel y . Our reading of this set of mutuall y-connect ed research findings isthat they offer a
rich univer se of clues to calculat e a more realisticand thus more usefulprice
band . We sug ges t that a prob abl e price band could be U$34-U$40 or
U$32-U$42,compa red tothecurrentU$22-U$28.
Althoug h our resu lts cons titute a valua ble contribu tio n to the argumen t
regardin g the oil price band , an insu fficient amountofdata in the more recent
peri od means that othe r factors may not yet be visib le, which cou ld lead to
less satisfa ctory results. Since oil prices increa sed more rapidly during the second halfof2004and 2005,it ispossibl ethat another structura l breakcou ld
l.iao&SIIC'/! ]05 verifie d as more evidence becomesavailable (samp le data). At present. it is
hard for usto findanothersignificant breakdueto the shortage ofdatadur ing
the period charac terize d by a rap id price upswing . In view of this, we are
making everyeffort to collec t moredata.
ACKNOW LEDGMENTS
An earlier ver sion of this paper was present ed at the 28th IAEE confere nce. The autho rs would like to thank parti cipants fo r the comme nts ra ised therein, and two ano nymo us referees for helpful com me nts. Fina nc ial
SUpp0l1 from the Energy Bureau, MOEA , Taiwan, is gratefu lly
ac know ledged.
REFERENCES
Andrews. D.W.K.(1993 ) "Tests forParam eterInstabilityandStructura lCha nge with
UnknownChangePoin t." Econo metrica61:4:821-856.
Andrews.D.W.K.,W.Ploberger (1994 )"OptimalTests When aNuisan ceParameter
isPresent OnlyUnder theAlternative."Econometrica 62:6:1383-1 41 4.
Bai. 1.. P. Perron (1998) "Estimating and Testing Linear Mode ls with Mult iple
Structural Cha nges ."Econo metrica 66: I:47-78.
Bai. 1.. P. Perron (2003) "Computat ion and Ana lysis ofMultiple Cha nge Models."
JournalofAppliedEconometrics 18:1-22.
Banerjee, A., R.L. Lumsdai ne andlH.Stock(1992) "RecursiveandSeque ntial Tests
of the Unit- Root and Trend-B rea k Hypotheses: Theo ry and Intern ation al Evide nce,"Journ alofBusinessandEconomicStatistics 10:3:271- 287.
Caporale. T.. K.B . Grier (2000) "Political Regime Change and the Real Interest
Rate,"Jou rnal ofMoney. Credit.andBanking 32:3:320-334.
Chow. G.c. (1960) "Tests of Equali ty Between Sets of Coefficients in Two Linear
Regressions." Econometrica28:3:59 1-605.
Christiano, L.J. (1992) "Searching fo r a Break in GNP," Journ al
of
Business and Econo micStat istics 10:3:237-250.Hansen. B.E. (199 7) "Approximate Asymptotic P-values for Struc tural Change
Tests," JournalofBusinessandEconomicStatistics 15: 1:60-67.
Hansen,B.E.(200 1)"TheNew Econometricsof Struc turalCha nge:Datin gBreak s in
206 EnergyStudiesReview Vol.14.No.2.
Hegwood , N.D., D.H. Papell (2002) "Purchasing Power Par ity under the Gold
Standa rd,"SouthernEconomicJourn al 69:1:72-91.
Huang,R.H.e.,W.H.Cheng (2005) "T ests of the CAPM under Struc tura lCha nges,"
International EconomicJournal 19 : 535-553.
Liao, H., T. Yu (2000) "The Exami na tio n of Curre nt Crude Oil Price Formulas,"
Journal ofEnergyandDevelopment26:I:109-1 26.
Lynch,M.e. (200 1)"O il Prices Ente ra New Era,"Oil andGas Journal99:7:20-3 0.
Lynch, M.e. (2002) "Causes of Oil Price Volatility," The Journ al of Energy and
Development28:1: 107-141.
Perron, P., Z. Qu (2005) "Estimating and Testing Multiple Struc tura l Cha nges 111
Multivar iateRegr ession s," Workin gpaper.
Perron, P., Z. Qu (2006) "Estima ting Rest ricted Structura l Cha nge Mode ls,"
Forthco ming in theJournal ofEconometrics.
Perron, P., TJ. Vogelsa ng (1992) "N onstationarity and Level Shifts with an
Application to Purchasing Powe r Parity," Journal ofBusiness and Economic Statistics 10:3:301-320.
Qua ndt, R. (1960) "Tests of the Hyp othesi s that a Linea r Regr ession Obeys Two Sepa rate Regimes,"JournaloftheAmericanStatisticalAssociation55:324-330.
Rap ach , D.E.,M. E. Woha r(2005) "Regime Cha nges in International Real Inter est
Rates: Are They a Mon eta ry Phenomenon?" Journal of Money. Credit. and Banking37:5 :887-9 06.
Rodri gu ez, G., Y. Sarny, (2003) "Analysing the Effects of Labo r Sta ndards on US EXp0l1 Performance:ATime Series Appro ac h with Structural Cha nge,"App lied Economics35:104 3-1051.
Schwe rt, G.W. (1990 ) "Stock Mark et Vola tility," Financial Analys ts Journal
46:3:23-34.
Stevens, P. (200 I) "Micro-Managing Global Oil Markets: Is It Getting More Difficult?" The Journal ofEnergy and Developm ent26:2:197-2I2.