Abstract: In the current day scenario, a huge amount of data is been generated from various heterogeneous sources like social networks, business apps, government sector, marketing, health care system, sensors, machine log data which is created at such a high speed and other sources. Big Data is chosen as one among the upcoming area of research by several industries. In this paper, the author presents wide collection of literature that has been reviewed and analyzed. This paper emphasizes on Big Data Technologies, Application & Challenges, a comparative study on architectures, methodologies, tools, and survey results proposed by various researchers are presented.
Index Terms:. Big Data; Big Data Technologies
I. INTRODUCTION
This paper is organized to have several sections, in Section I, an introduction to Big Data is presented, Section II discusses about Big Data Application & Challenges. In section III Big Data technologies are discussed. In Section IV, a comparative study and surveys conducted by various researchers are presented. Section V deals with the Methodology and Section VI deals with the comparisons of various architectures. Finally, conclusions are drawn in Section VII.
The Traditional technologies or the systems had limited storage capacity, could not manage the huge datasets efficiently, and were not able to store all the files for significant period of time therefore many companies were lacking to provide with the functionalities like performance, scalability and flexibility needed in the big data. This in turn, made the companies and industries to invent new methods of cleaning, processing, analyzing significant resources, and securing the massively evolving data sets.
The voluminous data has been flowing through different data sources because of many technological innovations, which includes Internet of Things, the expansion of cloud computing (Botta et al., 2016) and the distribution of various smart devices. Behind the scene, distributed applications like automated banking system , smart grid services like GPS (Chen et al., 2014a), Medical systems (Kankanhalli et al., 2016), retailing systems like Wal-Mart (Schmarzo, 2013), etc., are also causing information explosion.
Revised Manuscript Received on August 05, 2019.
Niteesha Sharma, IT Department, Anurag Group of Institutions, Hyderabad, India.
A.Sriram, IT Department, Anurag Group of Institutions, Hyderabad, India. Dr. K. S. Reddy, IT Department, Anurag Group of Institutions, Hyderabad, India.
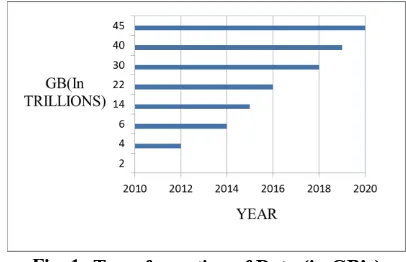
[image:1.595.323.526.263.394.2]The information explosion also called as data deluge (the amount of information being generated is overwhelming the capacity of the institutions or professionals or researchers using it) allows us to use new units of measurement of data from Terabyte to Petabyte to exabyte to zetabyte to Yottabytes.
Fig. 1. Transformation of Data (in GB’s)
As a result of it, various projects, prototypes, architectures and new advancements in Big Data were evolved to provide real time analysis, more space for storage, increased processing speed, of various heterogeneous insights of data. Also various algorithms were developed to guarantee data protection and security (Purcell, 2013).
Data & Analytics has been one of the recent Technological inventions identified by Gartner in the Top 10 Strategic Technology Trends for 2018. For the meaning of the term Big Data, there are different clarifications of V’s i.e., from 3Vs to 4Vs to 5Vs to 10Vs to 42Vs. [1]
Big Data can be disclosed by three V's: Velocity, Variety and Volume. In a research report, distributed in 2001 by META Group (now Gartner) characterized enormous information as being three-dimensional, for example expanding volume (Amount of data), velocity (Speed of Data), and Variety (range of information types and sources). Later in 2012, Gartner updated the meaning of enormous information as high volume, high speed, and high variety. The fourth V falls into the Big Data class along with the sensor information from the web of things, log records, and internet based streams. The capacity to understand and deal with these sources, and then incorporate them into the larger Business Intelligence system can give past knowledge from data. This understanding leads the "fourth V" of Big Data – Value. The fifth V Veracity discusses the variation of data.
Big Data Analytics With Reference To Wide
Variety of Domains
Big Data is a Common problem faced by many of the industries and it brings grand challenges for data digitization, storage and informationization. Data on its own is unusable until we can derive meaningful insights from it. Therefore, Analytics plays a major role which can be defined as a scientific process for deriving meaningful insights from market analyzing, better decision making, able to offer wide variety of competitive advantage.
There are three types of data analytics:
1.Prescriptive Analytics: Enables smart decisions based on the type of data.
2.Predictive Analytics: Predicts the future based on the historical patterns.
3.Descriptive Analytics: Mines past data insights.[2] Business Analytics make use of the past experience and fact based management systems in order to predict and develop the new insights and also to further develop the upcoming business in almost all the fields. The decision making in business performance is done through various statistical models, data visualization techniques and many more. According to the “McKinsey Global Institute”, the values of big data are generated by creating transparency, expose variability, improving performance, innovating new business models, and to achieve this various applications of the Big Data problems in Finance, Health & Life sciences, scientific research, E-commerce, Retail and telecommunications fields need to be addressed.
II. BIG DATA APPLICATIONS AND CHALLENGES
With the huge amount of data emanating day-to-day the big data with its applications is taking the world by storm. Applications of big data are:
1.
Big Data in E-health:E-health is one among the major applications of big data where many hospitals are applying analytics to big data to personalize the health care services. The data generated from health care is of the form heterogeneous (Laboratory reports, Patient records, disease Symptoms) datasets. And thus big data is of great help to the physicians as they are able to view and monitor the patient records online. Making proper use of data analytics in health care system can lead to a major improvement in faster disease identification; adapt public health plans, significant cost savings.
2.
Big Data in Learning:Big data has a greater impact in the field of education. Now-a-days almost every course is online and apart from e-learning big data is used in many ways in education industry like advanced academic digital libraries, academic search engines, adaptive learning, and bubble score.
3.
Big Data in Manufacturing:Big data is in an extended use of E-Commerce applications where market basket analysis, supply chain management analytics, output forecasting, customer loyalty programs, product quality and defects training, market and consumer segmentations are providing better results with the implementation of Big Data Analytics.
4.
Big Data in IoT:IoT (Internet of Things) is the idea of extension of the internet being connected to physical devices. Thus, the data which is extracted from various devices provides information mapping. These devices interact and communicate with others and also they are remotely monitored and controlled. The companies using IoT are able to provide tracking information to customers using which they can track there order with the help of sensors. Also smart city, smart doorbells, Amazon echo are some of the major applications of IoT.
Mining or extracting of useful information or data insights from huge data sets or data streams is usually referred to as Big data mining. This process of retrieving useful insights or information from large datasets is facing many problems which have a need to be addressed.
Some of the problems faced by the researchers are:
1.Storage of Exponentially growing huge datasets – As 90% of worlds data generated in the last 2 years was more than the previous total history. By the year 2020 more than 44 terabytes of digital data will be produced and about 1.7 MB of new info will be created every second per person. 2.Analyzing and processing of data using complex
structures—As data is of form Structured, semi structured, unstructured
3.Processing the data faster—Bringing huge amount of data to the computational units is a bottle neck issue.
4.Data Aggregation – Synchronizing outside data sources.
III. BIG DATA TECHNOLOGIES
Many number of Database technologies have raised that are specifically designed and are employed for big data. In 1970s, RDBMS (the relational database management approach) came into existence. Later in 1980’s managing of data became more efficient, effective and reliable using this approach. But with the increase of data day by day the amount of data being stored in the database increased due to which “very large datasets” emerged. In 1990-92 the large amount of data considered was of one terabyte. Later in 2000’s very large datasets were in the range exa bytes which required a larger storage area because of various reasons like storage overhead in relational databases and the different retrieval mechanisms used due to huge demand.
Keeping in view of this, the systems developed later have less focused on the relational databases deviating to memory management, key vs column structures, documents, graphs and many more techniques.
One among them is Hadoop- an open source framework which is used to handle the unstructured data using Map Reduce technique- a parallel processing framework which was developed by GOOGLE. Further developments include MONGODB, New SQL, NoSQL, VoltDB etc.,
MPP (Massively Parallel Processing) databases have been used around the decades. MPP is most mature, widely used and proven mechanism for storing as well as analyzing huge amounts of data. The MPP relational database spreads the data over independent transparent servers instead of a single overhead server. In Big Data environment the analytic MPP system is called as shared-nothing databases.
Fig. 2. Azure Data warehouse – Massively Parallel Processing.
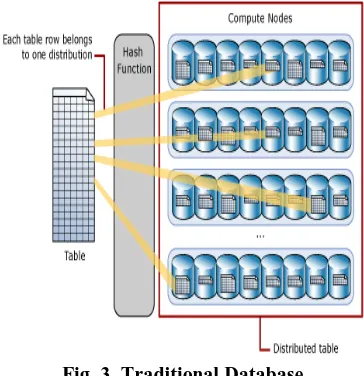
For example a traditional database processes 1 TB (one terabyte) data one row at a time. If an MPP database is used with 20 processing units then the data is broken into 20 uniquely independent chunks with 100GB data.
Fig. 3. Traditional Database
MPP Systems so built are redundant in nature so that data is stored in multiple locations to make recovery possible in case of equipment failure. Also, by distributing data across nodes in parallel the MPP databases are able to provide faster performance. The collection of the independent systems that make up an MPP system is known as a cluster.
2.Hadoop:
Hadoop an open source framework was created by Dough Cutting, managed by Apache software Foundation. It is used for running applications in parallel by supporting the data
oriented clusters of generic hardware. In April, 2008 Hadoop was world recorded as fastest system to sort one terabyte of data in 209 seconds.
For effective scheduling of work, when large datasets outgrows the storage capacity of a server it becomes essential to partition it across a number of different servers. This partitioning of file systems across a network is called as Distributed file System. Hadoop uses HDFS- Hadoop Distributed File System that stores the data on commodity machines which is scalable, distributed, portable and more efficient in reducing the network traffic.
3.Map Reduce:
Map Reduce is a framework which is used in distributed computing where huge amount of data is stored on large clusters.
The Map Reduce algorithm is written in Java and it contains two important steps:
i)Map Step: The map step takes a set of data as input and convert the data into set of tuples generally in the form of key/value pairs<key, value>.Then in the next step the results of map step are passed to reduce step.
ii)Reduce Step: The reduce step takes the output from map step and combines the data tuples into smaller set of tuples. iii) The map and reduce step can be chained together for
[image:3.595.309.545.413.595.2]computations.
Fig. 4. Map Reduce Framework- Azure.
IV. RELATED WORK
A much of research work has been progressed in the field of Big Data and is still being done for the analyzing of data for large enterprises. Various researchers have worked on Big Data:
[image:3.595.77.259.453.641.2]data intensive computing is emerging in the world to handle the Big Data Problems. Their research claims that by increasing productivity and competitiveness of the Public enterprises big data can make a prominent development in the realm of economy. Later they discussed about various challenges of Big Data like Data Capture and storage, curation, analysis and visualization.
Xindong Wu, et.al [4] has presented Big Data Characteristics using HACE Theorem – Big Data has Heterogeneous, Autonomous data sources with the ability of distributed control which can explore Complex and Evolving relationships between the data. [HACE].
Longbing CAO [5] in his paper titled Data Science: A Comprehensive review stated that “Data science is an evolution from statistics” where descriptive analysis plays a major role. This analysis is used for analytical and reporting formats and the major tools used in the business intelligence tasks.
M. Mazhar Rathore, et.al [3] has proposed the use of IOT with Big Data Analytics which is used in processing huge amount of real time city data(big Data) efficiently.
The-Hien Dang-Ha, et.al introduces GOVA –“Big data analytics architecture” for IOT applications which solves the noninvariant issues, also scales horizontally in data computation, storage. [9]
Alberto M. C. Souza , et.al [7] using Hadoop framework and Mahout K-means algorithm has implemented an outlier detection algorithm integrated with Internet of Things architecture which is implemented using LinkSmart middleware.
Priyan Malarvizhi Kumar, et.al [8] has proposed an IOT based Health Monitoring system in which a three tier architecture is used for processing sensor data and finding out the clinical parameters responsible for getting heart disease.
V. METHODOLOGY
Xindong Wu, et.al [4] has developed a Big Data Processing framework where Big Data Mining Platform in Tier I focused on data accessing, data privacy formed Tier II and various Big data mining algorithms formed the Tier III. M. Mazhar Rathore, et.al [3] has proposed the architecture and implementation using spark over Hadoop eco system model. They installed different wireless and wired sensors, cameras, emergency buttons in street. The main agenda is to link the smart city data so that to get all the data at central place. The architecture used in this system shows step by step procedure from data generation to decision making and its applications. The classification server arranges the incoming data and is converted into organized form using Hadoop eco System.
The processing of offline data collected is done using Map reduce technique in HDFS while the real time data is processed using SPARK. The decision-making approach
uses approaches of machine learning, soft computing ,pattern recognition, and decision models.
The-Hien Dang-Ha, et.al [9] introduces the path from the laboratory to practice and have generalized that –“most of the lab- practice gaps in smart grid are caused by taking data out of context issues “i.e. (“noninvariants”). This architecture includes virtual entity, the micro services, and the graph database.
Alberto M. C. Souza ,et.al [7] using Hadoop framework and Mahout K-means algorithm has implemented an outlier detection algorithm integrated with Internet of Things architecture which is implemented using LinkSmart middleware This was integrated with Internet of Things architecture. The architecture has been built using a middleware layer called LinkSmart IOTwhich implements pattern recognition using classification and estimation. Ivan Kholod, et.al [6] presented the architecture of IOT for data mining systems.
The architecture has following layers:
Perception Layer (bottom Layer used for collection of data)
Network Layer(middle Layer used for transmission of data)
Application Layer (integrates the data from the above two layers)
Gateway Layer( used for message routing)
Middleware Layer (responsible for device management and information management)
The above architecture has deployed on cloud for efficient data storage. Various systems like Microsoft Azure Machine Learning, Apache Spark Machine Learning Library, and Apache Mahout work well in big computing clusters. Whereas these systems cannot be used for fog nodes and to solve this problem actor model is used. For parallel and distributed computing actor model is used.
VI. COMPARISON OF VARIOUS BIG DATA ARCHITECTURES
Architecture Name
Layers Idea Merits Demerits
Rathore, Ahamad and paul Architecture
Data preprocessing, Data processing and Data analysis
Using Big Data
Analytics Proposed and developed a smart city system based on IoT.
Scalable (throughput and processing time)
More Efficient
Testing is not done.
GOVA (Graph of Virtual
Actors)[9] Service and Data Stream Layer
Proposed Invariant Big data analytics architecture for
smart grid
Horizontal scalability Graph database
Performance
improvement is
dependent on Data Compatibility.
Souza Architecture
Network layer Service layer Pattern layer
Linksmart IOT
Middleware
Big Data and Internet of Things for outlier identification.
Flexibility
Application towards larger dataset is not possible.
IOT for Data mining Systems
Perception Layer Network Layer Application Layer Gateway layer Middleware Layer
Distributed data Mining algorithm is used.
Use cloud and fog
Efficiency related to IoT systems is improved.
AML, MLLib systems cannot be used for Fog nodes hence Actor model was used for parallel and distributed computing.
IOT based Health
Monitoring system Three Tier Layers
Use of Apache HBase to store IOT Data on Cloud & ML algorithms for prediction model
More sustainable and efficient using ROC Analysis
Continuous Health monitoring system
VII. CONCLUSION
In this paper, various domains of Big Data has been presented. This paper outline the Big Data Technologies, Application & Challenges, a comparative study on architectures, methodologies, tools, and survey results proposed by various researchers are presented.
REFERENCES
1. C. L. Philip Chen, C. Y. Zhang, Data Intensive applications, challenges, techniques and technologies: A survey on Big Data”, SCI (2014). 2. Data science: A comprehensive overview. ACM Comput. Surv. 50, 3,
Article 43 (June 2017), DOI: http://dx.doi.org/10.1145/3076253 3. M. M. Rathore, A. Ahmad, A. Paul and S. Rho, "Urban planning and
building smart cities based on the Internet of Things using Big Data analytics", Computer Networks, 2016.
4. Xindong Wu, Xingquan Zhu, Gong-Qing Wu and Wei Ding, “Data Mining with Big Data”, IEEE transactions on Knowledge and data engineering, Vol.26, January 2014.
5. Longbing CAO, “Data Science: A Comprehensive Review”, ACM Computer Survey 50, 3, Article 43, June 2017.
6. Ivan Kholod, Mikhail Kuprianov, Ilya Petukhov, “Distributed Data Mining Based on Actors for Internet of Things”, MECO 2016. 7. Albert M. C. Souza and J. R. A. Amazonas, "An Outlier Detect
Algorithm using Big Data Processing and Internet of Things Architecture," Procedia Computer Science, vol. 25, 2015.
8. P.M. Kumar, U. Devi Gandhi, A novel three-tier Internet of Things architecture with machine learning algorithm for early detection of heart diseases, Computers and Electrical Engineering (2017), http://dx.doi.org/10.1016/j.compeleceng.2017.09.001
9. The-Hien Dang-Ha, Davide Roverso, Roland Olsson, Graph of Virtual Actors (GOVA): a Big Data Analytics Architecture for IoT, International Conference on Big Data and Smart Computing, IEEE, 2017
AUTHOR’S PROFILE:
Mrs. Niteesha Sharma working as an Asst. Professor, IT Department, Anurag Group of Institutions is pursuing her Ph. D from Osmania University. She is having 10 years of experience in teaching. Her area of interest is Big Data. She published Five papers in International and National Journals/ Conferences of which 2 are Scopus indexed. Scopus Author ID: 57208779011.
Mr. A. Sriram, Asst. Professor, IT Department, Anurag Group of Institutions; having 10 years of experience in teaching. His area of interest is Networking and Information Security. He has published 10 papers in International and national Journals/ Conferences.