Raymond John Roberts
A thesis submitted for the degree of
Doctor of Philosophy at
The Australian National University
Typeset in Times by TEX and LATEX 2ε.
Paper makes money
Money makes banks
Banks make loans
Loans make beggars
Beggars make rags
I acknowledge the initial overall supervision of this research while studying part time by Dr Phillip Evans, then Reader in Forestry ANU who encouraged me to undertake the project and helped set up its original scope. When Phil left ANU to take up the position of Professor and Director at the Centre for Advanced Wood Processing Department of Wood Science University of British Columbia the role of overall supervision went to Dr Mark Knackstedt Associate Professor, Department of Applied Mathematics, Research School of Physical Sciences and Engineering, ANU. I acknowledge Mark’s intellectual leadership, superb editing skills and friendship.
I also acknowledge the intellectual support, supervision, assistance with experimentation and friendship of Dr Tim Senden, Senior Research Fellow, Department of Applied Mathemat-ics, Research School of Physical Sciences and Engineering, ANU. The friendship and support of Mark and Tim especially in the last year of the project where other issues could have cre-ated difficulties with the successful completion of the project is especially acknowledged and greatly appreciated.
I also acknowledge the support of Dr Roger Heady of the Electron Microscope Unit, ANU who provided so much assistance with the Cambridge Scanning Electron Microscope espe-cially on weekends while studying part time. I espeespe-cially appreciate the way in which Roger always managed to find a slot on the SEM for me for those last minute jobs that seemed to be unending.
I also acknowledge the support of:
Mr Anthony Hyde Senior Technical Officer Department of Applied Mathematics, Research School of Physical Sciences and Engineering, ANU who gave me great assistance in the design and in liaising with the workshop in the construction of the two cryo-cell units for the CLSM. Dr M. Bruce Lyne President of the YKI Institute in Stockholm for organising various lab-oratory papers used in this thesis.
Mr Ross Cunningham of the Statistical Consulting Unit, The Graduate School ANU for advice and assistance in the design of experiments and analysis of data.
Mrs Christine Donnelly of the Statistical Consulting Unit, The Graduate School ANU for advice on the use of the statistical programme Genstat.
Dr Jeff Wood of the Statistical Consulting Unit, The Graduate School ANU for statistical advice.
while I was employed part time at CHH.
Dr Vincent Otieno-Alego for access and assistance in the use of the Raman Microscope at the University of Canberra.
Mr John Barnard, Deparment of Chemical Engineering, Monash University for his assis-tance with mercury intrusion porosimety.
I am indebted to my parents Ruth and Bill who provided a place for me to stay in Canberra while I studied part time.
I am also indebted to my dear sons Will and Simon who missed out on a lot of time with dad and who understood the need for their dad to undertake this project at the expense of time with them on the farm. Their love and support meant so much and is impossible for me to put into words.
I acknowledge the financial support of the Cooperative Research Centre for Functional Communication Surfaces and also BASF AG Ludwigsafen for their financial support for the project and access to their 2-photo confocal laser scanning microscope at the Central Research Laboratories. I particularly acknowledge the assistance of Dr Wolfgang Schrof Group Leader Polymer Physics BASF Ludwigshafen who enabled me to use the CLSM exclusively while in Ludwigshafen and who supplied technical assistants while there.
I acknowledge the financial help of CSR who provided a research grant to enable me to purchase a high speed video camera and who supported my part time study while I was still employed as Technical Manager at the Tumut plant.
I acknowledge the support of Carter Holt Harvey Panels when I became a full time student in employing me part time as a treater specialist.
Finally I wish to acknowledge the leadership and support of Mr Mike Alston who was my manager at Tumut. Mike was the one who started this process by telling me to ”go and do some science” to solve a problem that no-one in the world was able to shed any light on. However I mainly acknowledge and deeply appreciate the friendship he gave me all the way through and his ability to fight off the corporate diversions from above and his efforts to gain corporate support for me after the takeover of CSR Panels by CHH when I became a full time student.
The origin of this thesis lay in the production of defects associated with manufacturing LPM impregnated panels. The causes of these defects were unknown as was their exact nature. In identifying the actual nature and cause of these defects, it is necessary to research the fun-damental mechanisms of fluid flow into paper as well as identifying how certain structural characteristics of paper, as well as characteristics of the penetrating liquids, affected fluid flow within paper.
To understand the affect of different liquids on impregnation into porous media, simple isotropic micromodels are used to quantify the effects of surface tension and contact angle on the rate of fluid flow. The use of the Lucas-Washburn equation is questioned.
Using cryo-SEM and a newly developed technique of cryo 2-photon confocal laser scan-ning microscopy, the actual mechanisms of fluid flow in unsized paper are identified. These are due primarily to the advance of the wetting fluid in the form of bulk liquid films along channels formed by fibre overlaps. This is in contrast to the common description of fluid penetration, where the primary flow mechanism is based on the bulk filling of pores. These channels, formed by fibre overlaps are shown to form a highly interconnected dense network of flow paths which efficiently transport the wetting fluid. The flow rates associated with penetration along a number of potential flow paths within the fibre web are calculated. The experimentally observed penetration rate is consistent with a film flow process through inter-fibre channels which is significantly slower than a penetration process dominated by meniscus flow through pores. In addition the mechanism of fluid flow in internally sized papers is presented.
Acknowledgements iv
Abstract vi
1 Introduction 1
1.1 Introduction to the thesis . . . 2
1.2 Brief overview of LPM manufacturing process . . . 3
1.2.1 First stage of treating; impregnation of decor paper with urea formalde-hyde resin . . . 3
1.2.2 Second stage of treating; coating with melamine formaldehyde resins . 4 1.2.3 Consequences of inadequate penetration of resin at first stage . . . 4
1.3 Aim and purpose of research . . . 5
1.4 Structure of the thesis . . . 6
2 Literature review 8 2.1 Previous research into resin impregnation of decor papers . . . 9
2.2 Review of experimental methods used in the thesis . . . 10
2.2.1 SEM in the study of liquids and paper . . . 10
2.2.2 Cryo 2-photon confocal laser scanning microscopy (CLSM) . . . 10
2.2.3 Plasma treatment of paper . . . 11
2.2.4 Mercury intrusion porosimetry . . . 12
2.3 Testing the rate of fluid imbibition into paper . . . 13
2.3.1 Testing imbibition into decor papers . . . 13
2.3.2 Review of non-optical methods to test rate of liquid imbibition into paper 13 2.3.3 Review of optical techniques for measuring liquid imbibition into pa-per . . . 14
2.4 Review of theories of fluid flow in paper . . . 15
2.4.1 Bulk capillary flow theory and the use of the Lucas-Washburn equation 15 2.4.2 Effect of pore geometry . . . 20
2.4.3 Complex simulated three dimensional pore models of imbibition . . . . 21
2.4.4 Intra-fibre flow . . . 22
2.4.6 Effect of surfactants on imbibition into paper . . . 23
2.4.7 Film flow . . . 23
3 The Cause of Surface Defects in Low Pressure Melamine Panels 26 3.1 Introduction . . . 27
3.2 Materials and Methods . . . 27
3.2.1 Justification of techniques used . . . 27
3.2.2 Selection of paper samples . . . 28
3.2.3 Resins . . . 28
3.2.4 Treatments . . . 29
3.2.5 Sample preparation for SEM; treated and pressed paper . . . 30
3.2.6 Sample preparation for Raman microscopy . . . 30
3.2.7 SEM imaging and data acquisition . . . 31
3.2.8 Experimental design and statistical analysis of data . . . 35
3.2.9 Raman microscopy and data acquisition . . . 36
3.2.9.1 Introduction . . . 36
3.2.9.2 Experimental . . . 37
3.2.10 SEM examination of edges of raw paper . . . 38
3.3 Results . . . 40
3.3.1 Overall effects of treatment & paper type on surface quality of paper . . 40
3.3.2 Treatment effects . . . 40
3.3.2.1 Surface . . . 40
3.3.2.2 Subsurface . . . 42
3.3.3 Paper effects . . . 44
3.3.3.1 Surface . . . 44
3.3.3.2 Subsurface . . . 46
3.3.4 Interactions of treatment & paper type on surface defects & subsurface pores . . . 47
3.3.4.1 Surface defects . . . 47
3.3.5 Melamine distribution . . . 70
3.3.5.1 Preliminary studies of Raman spectra of resins . . . 70
3.3.5.2 Melamine distribution in treated and pressed paper . . . 70
3.4 Discussion . . . 75
3.4.1 Conclusion . . . 78
4.2 Materials and methods . . . 82
4.2.1 Sampling . . . 82
4.2.2 Standard paper testing . . . 83
4.2.2.1 Klemm testing . . . 83
4.2.2.2 Resin demand . . . 84
4.2.2.3 Gurley porosity . . . 85
4.2.2.4 Thickness and density . . . 85
4.2.3 Measuring rate of saturation . . . 85
4.2.3.1 Inverted Bottle Test . . . 85
4.2.4 Relative reflectance method . . . 85
4.2.5 Statistical analysis of data . . . 89
4.3 Results . . . 90
4.3.1 Heterogeneity of paper and the relationship between the physical char-acteristics of paper and suitability of decor papers for LPM . . . 90
4.3.1.1 Density . . . 90
4.3.1.2 Paper thickness . . . 94
4.3.1.3 Gurley porosity . . . 97
4.3.2 Heterogeneity of paper and the relationship between fluid imbibition and suitability of decor papers for LPM . . . 99
4.3.2.1 Klemm test . . . 99
4.3.2.2 Resin demand . . . 105
4.3.2.3 Inverted bottle test . . . 107
4.3.2.4 Rate of saturation to 50% & 95% using relative reflectance method . . . 109
4.3.3 Relationship between the imbibition of liquids into decor papers and their physical characteristics . . . 112
4.3.3.1 Klemm tests . . . 112
4.3.3.2 Resin demand . . . 115
4.3.3.3 Rate of saturation to 50% using relative reflectance method . 118 4.4 Discussion . . . 118
4.4.1 Relating measures to defect levels . . . 118
4.5 Conclusion . . . 122
5 Mechanisms of Liquid Imbibition 123 5.1 Introduction . . . 124
5.2 Materials and methods . . . 126
5.2.1 Experimental design . . . 126
5.2.3 Determination of surface tension . . . 127
5.2.4 Use of micromodels . . . 128
5.2.5 Experimentation . . . 129
5.2.6 Statistical analysis of data . . . 131
5.3 Results . . . 131
5.3.1 One-dimensional model . . . 131
5.3.2 Two-dimensional models: capillaries aligned with inlet . . . 135
5.3.3 Two-dimensional models: capillaries not aligned with inlet . . . 136
5.3.4 Explaining rates of fluid imbibition into micromodels . . . 143
5.4 Discussion . . . 145
5.5 Conclusion . . . 147
6 Mechanisms of Fluid Flow in Paper 148 6.1 Introduction . . . 149
6.1.1 Background . . . 149
6.2 Materials and methods . . . 150
6.2.1 Introduction . . . 150
6.2.2 Paper samples . . . 151
6.2.3 Cryo-SEM imaging . . . 151
6.2.3.1 Sample preparation for SEM . . . 151
6.2.4 Imaging using cryo-two-photon confocal laser confocal microscopy . . 154
6.2.4.1 Development of cryo-cell for CLSM . . . 154
6.2.4.2 Sample preparation for CLSM . . . 154
6.2.4.3 Obtaining images . . . 157
6.2.5 EDXA analysis of sized papers . . . 161
6.3 Results . . . 162
6.3.1 Unsized & unfilled bleached kraft papers . . . 162
6.3.1.1 Cryo-2-photon laser confocal microscopy . . . 166
6.3.2 Decor papers . . . 174
6.3.2.1 Cryo-SEM . . . 174
6.3.2.2 Cryo two-photon confocal microscopy . . . 176
6.3.3 Pore-scale modelling of observations . . . 179
6.3.3.1 3D Pore Morphology of Paper . . . 179
6.3.3.2 Mechanisms of displacement in porous networks . . . 182
6.3.4 Relative flow rates along flow paths . . . 189
6.3.5 Sized papers . . . 190
6.3.5.1 Introduction . . . 190
6.3.5.3 Cryo two-photon laser confocal microscopy . . . 197
6.3.5.4 EDXA analysis . . . 200
6.4 Discussion . . . 204
6.4.1 Viscous effects . . . 204
6.4.2 Implications to fluid distributions within sheets . . . 204
6.4.3 Implications to printing interactions . . . 204
6.4.4 Sizing effects . . . 205
7 Effects of filler on the rate of imbibition in paper 209 7.1 Introduction . . . 210
7.2 Materials and methods . . . 210
7.2.1 Experimental materials . . . 210
7.2.1.1 Paper samples . . . 210
7.2.1.2 Liquid types . . . 211
7.2.2 High speed video microscopy . . . 211
7.2.3 Plasma treatment . . . 214
7.2.4 Mercury intrusion porosimetry . . . 215
7.2.5 SEM imaging . . . 216
7.2.6 Statistical analysis of data . . . 216
7.3 Results . . . 216
7.3.1 Macro effects of filler and plasma treatment on fluid flow . . . 216
7.3.2 SEM observations of the distribution of filler . . . 223
7.3.3 SEM observations of the effect of filler on the spreading of liquids . . . 224
7.4 Discussion . . . 237
8 Discussion on decor papers 242 8.1 Introduction . . . 243
8.2 Structure of decor papers and implications for imbibition . . . 243
8.3 Conclusion . . . 257
9 Conclusions 258
Appendices 275
A Tables of paper and resin properties from Chapter 3 276
C Details on design and construction of cryo-cell used in CLSM from Chapter 6 286
C.1 Cell design . . . 286 C.2 Use of cryo-cell . . . 291
D Development of method for determination of liquid flow using high speed
visuali-sation from Chapter 7 293
1.1 Schematic representation of the UF resin impregnation stage of a paper treater. 3 1.2 Images of pre-wetting roller, closeup on the left and showing the positions of
the sky rollers on the right. Note that only the bottom third of the pre-wetting roller is in the resin bath. The roller rotates against the travel of the paper en-abling a film of resin on the roller to come into contact with the paper. Arrows
denote the direction of movement of the paper and the prewetting roller. . . 5
3.1 Polaron Model E5000 sputter coater . . . 31
3.2 LKB model 7800 knifemaker . . . 32
3.3 Reichert-Jung Ultracut microtome . . . 32
3.4 Cambridge Instruments S360 Stereoscan scanning electron microscope . . . 34
3.5 Closeup of the specimen chamber in the Cambridge S360 SEM . . . 34
3.6 The Renishaw model 2000 Raman microscope . . . 37
3.7 The effect of UF saturation treatment on the total number of pores in paper samples. Error bar (LSD) represents the least significant difference (p<0.05). 41 3.8 Effect of UF saturation treatment on variance of areas of individual pores. . . . 41
3.9 Effect of level of UF saturation on total area of unfilled pores. . . 41
3.10 Effect of level of UF saturation on the ratio of the major to minor axis of unfilled pores. . . 43
3.11 Effect of level of UF saturation on the ratio of the proportion of unfilled pores beneath the surface of paper in treated and pressed LPM. . . 43
3.12 Effect of paper type on variance of areas of individual pores. . . 43
3.13 Effect of paper type on total numbers of unfilled pores. . . 45
3.14 Effect of paper type on total area of unfilled pores. . . 45
3.15 Effect of paper type on the ratio of the major to minor axis of unfilled pores. . . 45
3.16 Effect of paper type and treatment on the average unfilled pore area after pressing. 47 3.17 Effect of paper type and treatment on the length of the major axis of unfilled voids after pressing. . . 48
3.18 SEM images of untreated decor papers, top: Alpine White, middle: Beech and bottom: Black. . . 50
3.20 SEM images of untreated decor papers, top: New England Elm, middle: Storm and bottom: Streetlight. . . 52 3.21 Secondary electron (left) and backscattered (right) images of Black, Kraft,
Storm and Streetlight with no UF resin treatment. . . 53 3.22 SEM image of MF coating on New England Elm which was not subjected to
preliminary UF treatment. Note the small size of the pores. . . 54 3.23 SEM image of the edge of the treated decor paper Streetlight with no UF
treat-ment showing large unfilled voids in the centre of the paper. . . 54 3.24 SEM images of the MF coating on the surface of pressed Folkstone Grey
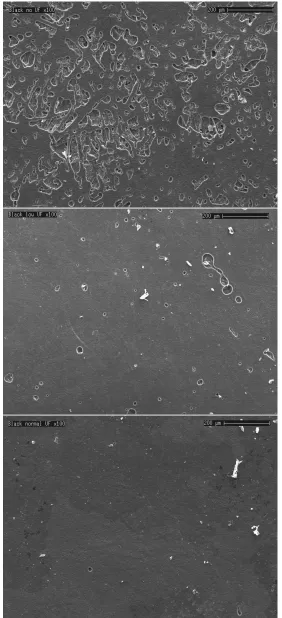
show-ing the relationship between treatment level and numbers of unfilled pores, top to bottom; no UF resin, deliberately under resinated and normal resin treatments. 55 3.25 SEM images of the MF coating on the surface of pressed Storm showing the
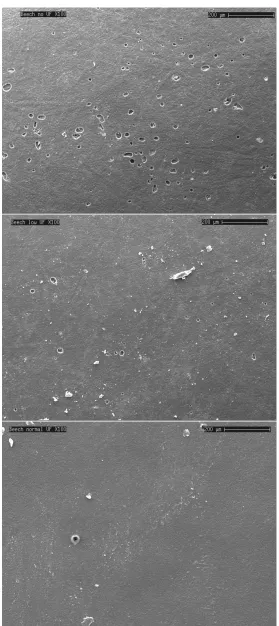
relationship between treatment level and numbers of unfilled pores, top to bot-tom; no UF resin, deliberately under resinated and normal resin treatments. . . 56 3.26 SEM images of the MF coating on the surface of pressed New England Elm
showing the relationship between treatment level and numbers of unfilled pores, top to bottom; no UF resin, deliberately under resinated and normal resin treat-ments. . . 57 3.27 SEM images of the MF coating on the surface of pressed Streetlight showing
the relationship between treatment level and numbers of unfilled pores, top to bottom; no UF resin, deliberately under resinated and normal resin treatments. . 58 3.28 Higher magnification SEM images of MF coating on Streetlight showing
de-tails of unfilled surface voids caused by migration of MF resin even though normally treated with UF resin. Note also the presence of MF ”caps” dislodged from the unfilled surface voids during pressing. . . 59 3.29 SEM images of the MF coating on the surface of pressed Alpine White
show-ing the relationship between treatment level and the number of unfilled voids on the surface, top to bottom; no UF resin, deliberately under resinated and normal resin treatments. . . 60 3.30 SEM images of the MF coating on the surface of pressed Kraft showing the
relationship between treatment level and the symmetry of unfilled voids on the surface, top to bottom; no UF resin, deliberately under resinated and normal resin treatments. . . 61 3.31 SEM images of the MF coating on the surface of Black, from top to bottom;
showing no, low and normal UF saturation respectively demonstrating the con-siderable variability in individual unfilled pore area. . . 62 3.32 SEM images of the MF coating on Beech showing a reduction in average
3.33 SEM images of the MF coating on Fog showing average pore sizes in paper
with top to bottom; no, low and normal UF saturation respectively. . . 64
3.34 The appearance of the decor paper Storm not treated with UF resin prior to MF resin application. . . 65
3.35 The appearance of the decor paper Storm deliberately under treated with UF resin prior to MF resin application. . . 65
3.36 The appearance of the decor paper Streetlight not treated with UF resin prior to MF resin application . . . 66
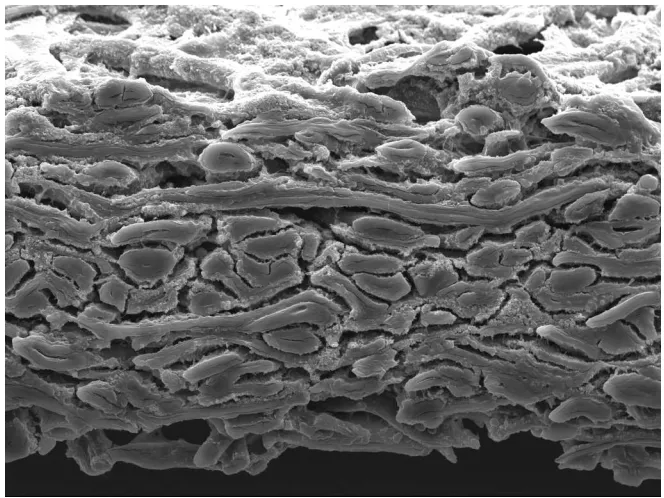
3.37 Edge image of normally treated Beech after pressing showing a high level of unfilled voids below the surface . . . 66
3.38 SEM images of the edge of MF coated Streetlight showing the relationship between treatment level and the proportion of unfilled voids below the sur-face of pressed paper, showing top to bottom; no UF resin, deliberately under resinated and normal resin treatments. . . 67
3.39 SEM image of the rough side of the untreated decor paper Beech showing high filler content. The unfilled pores are more symmetrical after pressing (Figure 3.32). . . 68
3.40 SEM images of the rough side of the untreated decor paper Streetlight, showing high filler content. The unfilled pores are more symmetrical after pressing (Figure 3.28). . . 68
3.41 SEM images of the rough side of the untreated decor paper Black, showing very low filler content. The unfilled pores are less symmetrical after pressing (Figure 3.31). . . 68
3.42 SEM images of the rough side of the untreated decor paper Kraft, which has no filler. The unfilled pores are less symmetrical after pressing (Figure 3.30). . 68
3.43 SEM image of the edge of Beech raw paper showing a heterogeneous distribu-tion of filler material resulting in a significant increase in pore sizes away from the surface of the paper. . . 69
3.44 SEM image of the edge of Folkstone Grey raw paper showing a homogeneous distribution of filler material resulting in a more even distribution in pore sizes below the surface of the paper. . . 69
3.45 Effect of treatment and position in the paper on the concentration of melamine in the treated pressed paper. . . 71
3.46 Raman spectra for uncured MF and UF resins. . . 72
3.47 Raman spectra for cured MF and UF resins. . . 72
3.49 Raman spectra for Fog paper samples treated with MF, but not subjected to a preliminary UF resin treatment showing a strong melamine peak in the centre
of the paper. . . 73
3.50 Raman spectra for Fog paper samples treated with MF, and a low preliminary UF treatment showing detectable melamine in the centre of the paper. . . 73
3.51 Raman spectra for Fog paper samples treated with MF, and a normal prelimi-nary UF treatment showing no detectable melamine in the centre of the paper. . 73
3.52 Raman spectra for Streetlight paper samples treated with MF, but not subjected to a preliminary UF resin treatment. Melamine is detectable at all positions in the paper. . . 74
3.53 Raman spectra for Streetlight paper samples treated with MF and a low UF preliminary UF resin treatment. Melamine is detectable at all positions within the paper. . . 74
3.54 Raman spectra for Streetlight paper samples treated with MF and a normal pre-liminary UF resin treatment. No melamine is detected away from the surface of the paper. . . 74
4.1 Sampling diagram for all paper tests including the imbibition test. . . 83
4.2 Klemm testing apparatus . . . 84
4.3 Experimental set-up for relative reflectance measurements . . . 88
4.4 Images showing position of CCD camera in relation to paper samples in the relative reflectance measurement apparatus and closeup of paper sample in temperature controlled bath showing “standard” washer. . . 88
4.5 Densities of the papers tested, the error bar (LSD) represents the least signifi-cant difference (p<0.05). . . 91
4.6 Relationship between density and ash content. . . 92
4.7 Relationship between density and thickness. . . 92
4.8 Relationship between paper density and total pore area. . . 93
4.9 Relationship between paper density and total number of unfilled pores. . . 93
4.10 Relationship between paper density and the average area of unfilled pores. . . . 94
4.11 Thickness of the papers tested measured on a log scale. . . 95
4.12 Relationship between paper thickness and total area unfilled pores (on a log scale). . . 95
4.13 Relationship between thickness of paper and total number of unfilled pores (measured on a log scale). . . 96
4.14 Effect of paper type on Gurley porosity. . . 97
4.15 Effect of density on Gurley porosity. . . 98
4.17 Relationship between Gurley porosity and average area of unfilled pores. . . 99
4.18 Effect of paper type on the wicking of water in the machine direction as mea-sured by the Klemm method . . . 101
4.19 Effect of paper type on the wicking of diethylene glycol in the machine direc-tion as measured by the Klemm method . . . 101
4.20 Relationship between Klemm with diethylene glycol and the standard Klemm test in the machine direction. . . 102
4.21 Relationship between Klemm tests carried out with water in the machine and cross directions. . . 103
4.22 The relationship with Klemm tests carried out in the machine and cross direc-tions with diethylene glycol. . . 103
4.23 Relationship between Klemm MD and total area of unfilled pores. . . 104
4.24 Relationship between Klemm MD and number of unfilled pores. . . 104
4.25 Effect of paper type on resin demand. . . 105
4.26 Relationship between resin demand and total area of unfilled pores. . . 106
4.27 Relationship between resin demand and total number of unfilled pores. . . 106
4.28 Effect of paper type on the rate of saturation of DEG using the inverted bottle test, uncorrected for thickness (s). . . 108
4.29 Effect of paper type on the rate of saturation of DEG using the inverted bottle test, corrected for thickness (s/100 µm). . . 108
4.30 Effect of paper type on time taken to saturate to 50% of the decor paper sam-ple as determined by the relative reflectance method corrected for thickness. Measure is seconds/100µm measured on a log scale. . . 110
4.31 Effect of paper type on time taken to saturate to 95% of the decor paper sam-ple as determined by the relative reflectance method corrected for thickness. Measure is seconds/100µm measured on a log scale. . . 110
4.32 Relationship between the rate of imbibition to 50% saturation and the log of total number of pores. . . 111
4.33 Relationship between the rate of imbibition to 50% saturation and the log of total number of pores. . . 111
4.34 Relationship between the Klemm test with water in the machine direction and density, the higher the density the lower the Klemm wicking of either water or DEG. . . 112
4.35 Relationship between the Klemm test with DEG in the machine direction and density, the higher the density the lower the Klemm wicking of either water or DEG. . . 113
4.37 Relationship between Klemm MD with DEG and Gurley porosity showing a similar trend to that of water where with increasing air permeability the Klemm wicking increases. . . 114 4.38 Relationship between resin demand and density. . . 116 4.39 Relationship between resin demand and Gurley porosity. . . 116 4.40 Relationship between resin demand and wicking of water in the machine
di-rection using the Klemm test. . . 117 4.41 Relationship between resin demand and wicking of DEG in the machine
direc-tion using the Klemm test. . . 117 4.42 Relationship between log of the rate to 50% saturation as measured on a log
scale with density. . . 118
5.1 Different imbibition mechanisms as described by Lenormand et al. (1983) A) piston displacement, B) snap-off, C) I1imbibition and D) I2imbibition. The most important of which in the micromodels used in this study being piston flow and snap-off as depicted in A & B. . . 126 5.2 Complete setup of micromodelling experiments showing A: timer, B: video
enhancer, C: video recorder, D: inclined platform, E: UV light source, F: mi-cromodel and G: CCD camera. . . 129 5.3 Photographs of the actual models used; Top: Capillary micromodel, Middle:
Cross capillary micromodel, Bottom: Diagonal micromodel. Scale bar repre-sents 10 mm. . . 130 5.4 Differences in imbibition rate between: top: simple wetting fluids and bottom:
surfactant based wetting fluids for one-dimensional capillary micromodels ob-served experimentally and using the Lucas-Washburn equation. Error bars lsd, p = 0.05 . . . 133 5.5 Measurement of imbibition into a one dimensional capillary network with
31.5% isopropanolθ= 52◦. Inset is a thresholded image of the solution im-mediately as the drop impacts and the final fluid distribution with the model. Surface and sub-surface spread is in mm and drop area and spread have a nor-malised scale of 0-1 where 0 is the minimum value and 1 the maximum. . . 134 5.6 Measurements of a one dimensional capillary network with the surfactant Zonyl
5.7 Showing the difference in imbibition rate between top: simple wetting flu-ids and bottom: surfactant based wetting fluflu-ids for two-dimensional cross-capillary micromodels observed experimentally and using the Lucas-Washburn equation, error bars lsd p = 0.05. . . 138 5.8 Measurements of a two-dimensional cross-capillary micromodel using 100%
isopropanol (θ≃15◦). Inset is a thresholded image of the solution illustrating the pattern of fluid movement. . . 139 5.9 Measurements of a two-dimensional cross-capillary micromodel using 31.5%
isopropanol (θ≃52◦) showing the times where penetration rate is actually zero while films spread and thicken prior to snap-off when the liquid front jumps the discontinuity. . . 139 5.10 Measurements of a two-dimensional cross-capillary micromodel using 0.1%
Zonyl (θ≃30◦) showing image of imbibing liquid. . . 140 5.11 Measurements of a two-dimensional cross-capillary micromodel using 84%
isopropanol (θ≃35◦) showing image of imbibing liquid. . . 140 5.12 Showing the difference in imbibition rate between top: simple wetting fluids
and bottom: surfactant based wetting fluids for two-dimensional diagonal mi-cromodels observed experimentally and using the Lucas-Washburn equation, error bars lsd p = 0.05. . . 141 5.13 Measurements of a two-dimensional diagonal micromodel using 100%
iso-propanol (θ≃15◦) showing image of penetrating liquid and it’s symmetrical distribution. . . 142 5.14 Measurements of a two-dimensional diagonal micromodel using 0.2% Zonyl
(θ≃30◦) showing image of penetrating liquid and it’s asymmetrical distribu-tion1. . . 142 5.15 Plot showing effect of liquid type and associated surface tension with
imbibi-tion rate for all micromodels. . . 144 5.16 Plot showing effect of liquid type and associated contact angles with imbibition
rate for all micromodels. . . 144
6.1 An example of an SEM image of fluid penetration into kraft paper in (a) sec-ondary electron mode and (b) backscattered mode. . . 152 6.2 Left; controller for Oxford CT1500B Cryotrans coldstage/coating unit for use
6.3 Vacuum chamber for preparation of (SLN2) and placement of droplet onto pa-per sample immediately prior to freezing in the chamber. This technique was exactly the same as that used for cryo-SEM except with the purpose built Ox-ford cryo chamber. . . 156 6.4 Nitrogen gas nozzle used to remove condensation from bottom window of
cryo-cell . . . 157 6.5 Leica inverted 2-photon confocal laser scanning microscope used to obtain all
images. Note the thermocouple temperature in image b: showing a temperature of -40.4◦C, showing that this was during the cooling phase before imaging as the temperature was not stable below - 50◦C. Note the cryo cell positioned on the microscope stage. . . 158 6.6 Computer station controlling two-photon microscope showing image
acquisi-tion on right screen and microscope and laser configuraacquisi-tions on the left screen. 160 6.7 Reichert Jung FC4 Ultracut cryo-microtome. . . 161 6.8 Low magnification image showing the fluid configuration at the paper surface.
A region of saturation exists (shaded blue) near the droplet (upper left of the image). The remaining regions exhibiting the presence of fluid are partially saturated. Red shading shows regions where pores exhibit partial filling. Green shading illustrates regions where the surface pores diverge to large openings. . . 162 6.9 The typical fluid distribution in the midst of the saturated zone. One observes
that pores at the surface are not all filled and fibres at depth are still visible to the surface. . . 163 6.10 Higher magnification image of the fluid configuration inside the partially
sat-urated zone. This image appears on the front cover of the Journal of Pulp and Paper Science Vol. 29 No. 4 (123 - 131) April 2003 (Roberts et al., 2003) . . . 164 6.11 Fluid configurations within the partially saturated zone. The top image has
been colourised to highlight the fluid flow. The yellow section highlights the metastable state just prior to snap off, the red shows filled pores and the green shows film flow along inter-fibre channels. The bottom image shows films thickening on the edge of a pore leading to pore filling. . . 165 6.12 Close up of a partially filled pore exhibiting pinning of the meniscus on the
pore wall. As a result it was unlikely that snap-off would have occurred in this particular pore. . . 167 6.13 A small pore (red) with a pore size of ≃ 10 µm completely filled with the
6.14 Two examples of fluid configuration in regions far from drop edge. The wetting fluid was present solely as films along channels formed by overlapping fibres (blue) and as films wetting corners of the pores (red). . . 170 6.15 At the outer edge of the fluid only film flow was observed along fibre intersects.
The top image has been colourised to highlight film flow and is a closeup of the bottom image. The arrow highlights a bordered pit that appears to have no visible liquid beneath it. . . 171 6.16 Stereo images showing, Top: film flow occurring along edges of fibres
analo-gous to that seen in Figure 6.14, Middle: thickening of films as seen in Fig-ure 6.11 and Bottom: pinning of the meniscus and pore filling away from the droplet edge as seen in Figure 6.12. . . 172 6.17 Stereo images showing, Top: film flow adjacent to the droplet and Bottom:
pore filling occurring from films from interfibre channels at different depths in the paper. Note the lenses of liquid forming at the different levels . . . 173 6.18 Images of decor papers at various stages of wetting: a); Beech showing pore
filling from adjacent interfibre films in the fully saturated zone, b); Black at the edge of the partially saturated zone showing transition from film thickening to pore filling, c); Folkstone Grey showing pore filling at the edge of the partially saturated zone from interfibre films, d); Fog showing edge of saturating zone, note pore filling from film flow notwithstanding the very small pore sizes, e); a closeup of film thickening surrounding a pore in Storm and f); Alpine White a highly filled very dense paper in the saturating zone showing interfibre film flow and unfilled pores. . . 175 6.19 Stereo images of the decor paper Streetlight showing, Top: unfilled voids
be-low edge of droplet, Middle: unfilled voids bebe-low edge of droplet and film fbe-low just out from droplet edge, Bottom: all morphologies of fluid flow underneath the middle of the un-depleted droplet. . . 177 6.20 Stereo images of decor papers showing, Top: Alpine White showing pore
6.21 (a) A schematic of the typical pore geometry in paper sheet; a (small) surface pore opening which opens up to a significantly larger pore. (b) Illustration of the fibre bonding state observed in 3D; note the large degree of entanglement and interconnection of the fibres. Flow channels formed by fibre overlap there-fore form a highly interconnected pore space. (c) illustrates a typical fibre cross section picture. The high degree of fibre overlap was reinforced. (d) The open channel pore geometry that was generated by fibre overlap. (e) Illustration of the indentations (A) and roughness (B) that are observed on a fibre surface and (C) the intra-fibre pore. . . 181 6.22 Interfacial configurations corresponding to different fluid penetration
mecha-nisms; (a) piston displacement, (b-d) penetration across pore boundaries and discontinuities. In case (b) the fluid can continue to advance, but in cases (c) and (d) the fluid configuration will remain stable. . . 184 6.23 (a) A simple illustration of a pore with two small fibre overlap channels; (b)
gives a more detailed view of the channel geometry. In (c) the free penetration of a film along a channel was illustrated; a gradient in the thickness of the film along the edge of uniform cross-section is illustrated (r2c >r1c). Because of this variation in thickness the capillary pressure at location (1) is greater than at location (2) Pc1>Pc2 via Eqn. (1). Since the pressure of the non-wetting phase (air) is the same at the two locations the fluid will tend to penetrate along from (2) to (1). (d - f) show the fluid configuration at the edge of a channel after filling is complete. In (d - e) αe ≥180o and the interface will
not thicken beyond the channel depth rc and will instead remain pinned at the
channel/pore edge. In (f) as the effective channel angleαe<180o, one would
observe a continued thickening mechanism. . . 185 6.24 (a) A schematic of a fibre cross section with two neighbouring fibres; this leads
6.25 High magnification image of an unfilled sized laboratory kraft paper BL-8 with the droplet of fluid in the bottom left quadrant of the image which was frozen 30 seconds after placement. Note the apparent high contact angle of the liquid on the surface of the fibres. . . 192 6.26 SEM secondary electron image of fluid droplet frozen 30 seconds after
place-ment onto sized copy paper. . . 193 6.27 SEM secondary electron image of fluid droplet frozen 2 seconds after
place-ment onto sized copy paper. . . 193 6.28 SEM secondary electron image of fluid droplet frozen 30 seconds after
place-ment onto sized copy paper. . . 193 6.29 SEM secondary electron image of fluid droplet frozen 30 seconds after
place-ment onto sized copy paper. . . 193 6.30 Images of sized copy paper with droplets left 30 minutes prior to freezing.
Image B shows the beginnings of film flow in interfibre channels. . . 194 6.31 SEM images of fluid penetration into BL-8 after 20 minutes of contact, left:
secondary electron mode and right: backscattered electron mode. . . 195 6.32 Higher magnification images of Figure 6.31 at higher magnifications. The two
right handed figures are in secondary and backscattered mode respectively. No presence of bulk fluid or film flow in pores was observed. . . 196 6.33 Further evidence that there was no presence of fluid within pores. Here an
edge image with the droplet shown on the far right in Figure 6.32 in secondary electron and backscattered modes. This edge image clearly shows that within the pores no fluid was present. . . 196 6.34 Stereo cryo confocal images of BL-8 laboratory made sized paper near the
droplet edge showing fluid flow of a length scale up to 200 µm within the fibre especially in the top image. The droplet of the penetrating liquid was in the top left hand quadrant in all images. The image size is 250 x 250 µm. . . . 198 6.35 Stereo cryo confocal images of BL-8 laboratory sized paper where one can
observe the opposite wall of the fibre through an unaspirated bordered pit, showing that there was not bulk liquid present in the lumen of the fibre . . . 199 6.36 SEM image of the edge of sized paper near the droplet edge. EDXA analysis
confirmed the presence of CsI within the fiber near the surface (X), but no presence of CsI within the lower fiber(Y). . . 200 6.37 EDXA spectra, Top: in wall of surface fibre just underneath droplet (X in
6.38 Edge cryo-SEM image of BL-8. EDXA analysis confirmed the presence of CsI within the fiber wall at (X), and on the edge of the lumen(Y)however there was no evidence of bulk liquid in the lumen itself. . . 202 6.39 EDXA spectra, Top: in wall of fibre just underneath droplet (X in Figure 6.38),
and Bottom: on the edge of the lumen of the fibre just below the droplet (Y in Figure 6.38) . . . 203 6.40 Figure showing the presence of films in an unfilled unsized laboratory paper
only both near the droplet center (a) whole droplet (b) after a 3 µl droplet
penetrated paper. . . 205 6.41 Illustration of (a) a highly interconnected network of channels and (b) the same
network with 80% of the channels removed. Here only the remaining channels which span the system are shown; i.e., those that could conduct fluid from top to bottom of the sheet. Clearly having a large proportion of channels hy-drophobised randomly would not lead to effective sizing. . . 207
7.1 Sequence of images (left) and light intensity profiles (right) showing: a & f just before droplet touch, b & g at droplet touch, c & h full saturation, d & i just after saturation showing strike-through of liquid on top surface note spike in graph at about point 130 showing increased reflection from strike-through liquid and e & j full spread after droplet depletion. Note the changing reflectance values at the point “130” on the x axis. The “halo” visible in the top image is a shadow cast by the collar from one of the light sources. The y axis of the graphs is the intensity of the light reflected off the top side of the paper the scale being 0 = black and 255 full white. The x axis is the number of pixels in the image. The line on the graph is 4.5 mm long and is equivalent to the diameter of the Teflon collar. The changing amount of reflected light was calculated for each frame by subtracting the light intensity of the dry paper before droplet touch from the light intensity of each consecutive frame during the complete wetting sequence giving a graph of droplet spread and change of reflectance over time. The time between consecutive images was 0.003 s. . . . 213 7.2 Fitted curve (2nd order polynomial) (red) of the wetting sequence of PCC30
(30% PCC) imbibed with water (blue). The initial steep section on the graph relates to the saturation within the droplet edge and hence is extremely rapid.
K1in Equation 7.1 is the coefficient used to determine average subsurface spread.214 7.3 Plasma reactor setup including chamber and RF generator . . . 215 7.4 Graphs showing the effect of plasma treatment, filler type and amount on the
7.5 Graphs showing the effect of plasma treatment, filler type and amount on the rate of subsurface spread of a) water and b) propanol. The graphs show stan-dard error bars between replicates. . . 218 7.6 Series of images showing the degree of saturation after 0.015 seconds. Note the
differences in level of saturation and hence rate of imbibition in the z direction. Scale bar is 4.5 mm . . . 220 7.7 Images of water droplets on talc before and after plasma treatment showing
that plasma treatment had very little effect. . . 221 7.8 Low magnification image of wetting of an unfilled plasma treated paper. Note
that there are fewer unfilled pores than in untreated papers (Figure 7.19). . . 223 7.9 High magnification image of individual PCC particles in a paper with 15%
PCC. Note complex scalenohedral but overall roughly spherical shape. . . 225 7.10 High magnification image of individual talc particles in a paper with 15% talc.
Note the plate-like structure of the particles with relatively smooth surface and very rough edges. . . 225 7.11 SEM images of laboratory paper with 7.5% PCC. . . 225 7.12 SEM images of laboratory paper with 7.5% talc. . . 225 7.13 SEM images of laboratory paper with 15% PCC. . . 226 7.14 SEM images of laboratory paper with 15% talc. . . 226 7.15 SEM images of laboratory paper with 30% PCC. Note tendency for the PCC
particles to aggregate into clumps in pores. . . 226 7.16 SEM images of laboratory paper with 30% talc. Note tendency for the talc
particles to be distributed around and not in the larger pores. . . 226 7.17 Schematic showing the distribution of filler particles at a pore scale; a) unfilled
paper, b) paper filled with talc and c) paper filled with PCC. Note distribution of PCC particles in clumps in larger pores and the distribution of talc particles around the edges of larger pores. . . 227 7.18 Schematic showing the distribution of filler particles at a larger scale; a)
un-filled paper, b) paper un-filled with talc and c) paper un-filled with PCC. . . 228 7.19 Low magnification image of wetting of a paper with no filler. . . 230 7.20 Higher magnification image of a paper with no filler. . . 230 7.21 High magnification image of an unfilled paper. . . 230 7.22 Higher magnification image of an unfilled paper. . . 230 7.23 Low magnification image of wetting of paper filled with 7.5% PCC. Arrows
marked A show unfilled pores. . . 231 7.24 Higher magnification image of a 7.5% PCC filled paper showing infilling of
7.25 Wetting of a 7.5% PCC filled paper showing showing few unfilled pores. Note impact of filler on filling of pores (arrow marked A). . . 231 7.26 Wetting of a 7.5% PCC filled paper showing showing pore filling right at edge
of wetting area. Note wetting of particles of PCC on fibre surface (arrow marked A) . . . 231 7.27 Low magnification image of wetting of paper filled with 7.5% talc. Note
un-filled pores in comparison to Figure 7.23. Arrows show unun-filled pores behind wetting front. . . 232 7.28 Higher magnification image of a 7.5% talc filled paper showing more detail of
pore filling. . . 232 7.29 High magnification image of a 7.5% talc filled paper showing pore filling only
at edge of wetting area. Fluid filling a pore appears to be pinned on a talc particle (arrow A) and a thickening film in an inter-fibre channel also appears pinned on a talc particle (arrow B). . . 232 7.30 7.5% talc filled paper showing fluid propagation by films. . . 232 7.31 Low magnification image of wetting of paper filled with 15% PCC. . . 233 7.32 Higher magnification image of a 15% PCC filled paper showing film flow at
edge of wetting area. Arrow A shows particles of PCC being readily wet and arrow B shows particles in a fibre overlap channel where pinning of fluid flow is evident. . . 233 7.33 High magnification image of a 15% PCC filled paper showing pore filling at
very edge of wetting area. . . 233 7.34 Higher magnification image of a 15% PCC filled paper showing film flow at
very edge of wetting area. Arrow A shows the influence of aggregated PCC particles in the filling of pores. . . 233 7.35 Low magnification image of wetting of paper filled with 15% talc. . . 234 7.36 Higher magnification image of a 15% talc filled paper showing more detail
wetting. . . 234 7.37 High magnification image of a 15% talc filled paper showing few unfilled
pores. Arrow A shows liquid filling a pore pinned on the edge of a particle of talc. . . 234 7.38 Higher magnification image of a 15% talc filled paper showing unfilled pores
near edge of wetting area. The arrow marked A again shows the effect of a particle of talc impeding pore filling. . . 234 7.39 Low magnification image of wetting of paper filled with 30% PCC. . . 235 7.40 Higher magnification image of a 30% PCC filled paper showing few unfilled
7.41 High magnification image of a 30% PCC filled paper showing more detail of imbibition into clumps of particles. Note the pattern of imbibition exactly follows the distribution of particles. . . 235 7.42 Higher magnification image of a 30% PCC filled paper showing more detail of
imbibition of clumps of particles. . . 235 7.43 a) Low magnification image of wetting of paper filled with 30% talc. . . 236 7.44 Higher magnification image of a 30% talc filled paper showing the edge of the
wetting area. . . 236 7.45 High magnification image of a 30% talc filled paper showing more detail of
pore filling. . . 236 7.46 Higher magnification image of a 30% talc filled paper showing more detail
of filling of pores. Arrows marked A show the impact of particles of talc on impeding pore filling. . . 236 7.47 Schematic comparing the effects of different fillers with the infilling of large
pores, A: no filler, B: talc and C: PCC. The schematic is of a vertical section through paper. . . 240 7.48 Schematic of potential flow paths of liquid in A) unfilled, B) papers filled with
talc and C) papers filled with PCC showing little difference in the tortuosity of flow paths between talc filled and unfilled papers and a significantly reduced tortuosity for PCC filled papers. . . 241
8.1 Graphs showing the relationship between average pore diameter determined by mercury intrusion porosimetry and saturation rate to 50%. . . 246 8.2 Low magnification SEM image of unresinated Alpine White showing
distribu-tion of filler. Note even distribudistribu-tion of pore sizes with no large pores. . . 247 8.3 High magnification SEM image of unresinated Alpine White (x 3K) showing
filler particles. The particles of filler do not appear clumped. . . 247 8.4 Low magnification SEM images of unresinated Beech showing distribution of
filler. Note larger pores. . . 248 8.5 High magnification SEM images of unresinated Beech showing filler particles.
The particles appear aggregated on fibre surfaces. . . 248 8.6 Low magnification SEM images of unresinated Black showing distribution of
filler. Note very open structure of the paper with large pores. . . 249 8.7 High magnification SEM images of unresinated Black showing filler particles.
The particles appear aggregated on fibre surfaces. . . 249 8.8 Low magnification SEM images of unresinated Fog showing distribution of
8.9 High magnification SEM images of unresinated Fog showing filler particles. Particles appear clumped in the pores. . . 250 8.10 Low magnification SEM images of unresinated Folkstone Grey showing
dis-tribution of filler. Note presence of larger pores and concentration of filler near the surface. . . 251 8.11 High magnification SEM images of unresinated Folkstone Grey showing filler
particles. Particles appear clumped in the pores. . . 251 8.12 Low magnification SEM images of unresinated New England Elm showing
distribution of filler. Note presence of larger pores and concentration of filler near the surface. . . 252 8.13 High magnification SEM images of unresinated New England Elm showing
filler particles. Note plate-like kaolin particles and concentration of filler par-ticles in pores. . . 252 8.14 Low magnification SEM images of unresinated Storm showing distribution of
filler and the very open structure of the paper. . . 253 8.15 High magnification SEM images of unresinated Storm showing filler particles,
which appear heterogeneously distributed. . . 253 8.16 Low magnification SEM images of unresinated Streetlight showing
distribu-tion of filler and the presence of very large pores. . . 254 8.17 High magnification SEM images of unresinated Streetlight showing filler
par-ticles, which appear heterogeneously distributed. . . 254 8.18 Cryo-SEM images in the saturated zone showing the comparison of papers
with no large unfilled voids: from top-bottom; Alpine White, Folkstone Grey, and Fog. . . 255 8.19 Cryo-SEM images in the saturated zone showing the comparison of papers
with large unfilled voids: from top-bottom; Beech, Black, and Storm. These papers had the slowest rates of imbibition to 95% saturation. . . 256
9.1 Images reconstructed from the x-ray micro CT of wetting an unfilled laboratory paper with 1-eicosene doped with OsO4showing trapping of air in the saturated zone as well as liquid in the form of films in unfilled saturating kraft paper, confirming what was seen in Chapter 6 using CLSM. The brighter areas in the image show the distribution of the liquid. The left image is the coronal section, the right image is the sagital section and the bottom image is the transverse section of the same sample. Note the filled paper has less trapping than the unfilled paper. . . 261
B.2 Plot of normalised changing reflectance ratio vs. time for a) Black, b) Folk-stone Grey & c) Kraft. . . 284
C.1 Copper cooling coil placed in dewar of liquid nitrogen showing needle valve on the supply side of the nitrogen gas and the vacuum pump used for generating nitrogen slush . . . 286 C.2 a: Image of the cryo-cell insert showing the sintered bronze ring, the rubber
washer to keep sample still under high gas flow and the removable magnetic stainless steel viewing window. Note the rare earth magnets embedded in the
Kel-F. The insert is actually upside down in the image. b: Cryo-cell insert on
top of Delrin base, c: cryo-cell insert placed in Delrin base with Luer No. 12 syringe in place for N2cold gas input, showing top viewing port enabling laser positioning and focussing. . . 288 C.3 Assembly diagram of cryo-cell for 2-photon laser confocal microscope . . . 289 C.4 Engineering diagram of cryo-cell for 2-photon laser confocal microscope a:
Kel-F cryo-cell insert, b: Delrin base. . . 290
C.5 The cryo-cell in the base plate on the microscope stage, note the incoming cold gas on the R.H.S. and the thermocouple wire going into an exhaust port on the L.H.S. . . 291
D.1 The experimental apparatus with camera, controlled voltage supply and light source. . . 295 D.2 Images showing the relationship of the high speed CCD camera to the position
3.1 Composition of the UF resin used to treat papers. . . 29 3.2 Composition of the MF resin used to treat papers. . . 29 3.3 SEM magnifications for edge imaging of papers . . . 35 3.4 Significant effects of, and interactions between, saturation treatment and paper
type on surface defects of treated pressed samples. . . 40
4.1 Significant effects of, and interactions between the physical characteristics of papers, the level of defects and the imbibition characteristics of decor papers. . 90
5.1 Static advancing contact angles and their corresponding air-liquid surface energy.127
7.1 Average thicknesses for all papers. . . 212 7.2 Saturation rate raw data (mm/s) . . . 219 7.3 Sub surface spread raw data (mm/s) . . . 219 7.4 Average and predicted pore diameter obtained from mercury intrusion
porosime-try. . . 221 7.5 Surface energies. . . 222
8.1 Filler content of decor papers. . . 246
A.1 Details of papers analysed . . . 277 A.2 Physical property data from suppliers . . . 278 A.3 Summary of identifiable compounds in uncured UF resin using Raman
spec-troscopy identifiable in Figure 3.46 (Hill et al., 1984). . . 279 A.4 Summary of identifiable compounds in uncured MF resin using Raman
spec-troscopy identifiable in Figure 3.46 (Scheepers et al., 1993, 1995). . . 279 A.5 Summary of identifiable compounds in cured UF resin using Raman
spec-troscopy identifiable in Figure 3.47 (Hill et al., 1984). . . 280 A.6 Summary of identifiable compounds in cured MF resin using Raman
spec-troscopy identifiable in Figure 3.46 (Scheepers et al., 1993, 1995). . . 280
E.1 Identification of significant relationships.
(* = p<0.05, ** = p<0.01, *** = p<0.001, NS = not significant p>0.05) . 297 E.2 Summary of significant relationships for rates of imbibition, the data being
Introduction
This chapter introduces the thesis. The background to the research is described including its aims, practical applications, scope, methods of study as well as the structure of the thesis. An overview of the industrial process of resin impregnation of decor paper is presented here and the key steps in the manufacture of low pressure melamine panels are described.
From where it all comes; transverse section of softwood tracheids from Wollemi Pine, Wollemia
nobilis with alternate biseriate pitting. Photo courtesy Dr Roger Heady, Electron Microscope Unit,
1.1
Introduction to the thesis
Decorative melamine panels are ubiquitous in the modern interior. The durability and chem-ical resistance of these panels is due to a 100-200 µm layer of resin impregnated paper. The surprising lack of information and depth of understanding of the production of this resin im-pregnated paper has led to the body of work which constitutes this thesis. From the requirement to better understand this process arose a broader need to understand the physics behind liquid penetration in paper.
The use of amino resin impregnated and coated decor papers laminated onto wood com-posite panels is widespread throughout the world in furniture, cabinet-making, partitioning of offices and for flooring. The first reference to the process of manufacturing low pressure melamine (LPM) laminates was by Seidl (1949) who described overlays for laminating veneer and plywood including descriptions of the resins used. Decorative overlays were described as being made from special papers of high resin content that are moulded into a dense infusible plastic, typical of the “familiar plastic table top”. The purpose of these overlays was to produce a highly serviceable and appealing surface of attractive color or design.
Enzenberger (1961, 1968) was the first to describe the process of impregnation of decor pa-pers, and lamination using melamine formaldehyde (MF) resins. Adam and Kamutski (1993) referred to the original patents for the production of melamine resins by Cassella, Ciba and Henkel in 1935 and described in detail the attributes of MF resins in their cross-linked state which make them suitable for LPM laminates. A good description of the manufacture and use of UF and MF resins is given in Pizzi (1983a,b) and Jalbert (1991).
The origin of this thesis lay in the author’s industrial experience in managing a commer-cial LPM production facility and specifically the problem that was frequently encountered, the presence of numerous surface defects in MF coatings. This problem is commonplace through-out the world in factories making the product. The causes and nature of these surface defects in LPM laminates which gives them a mottled, milky appearance with poor stain and abrasion resistance were unknown.
Little has been published on what factors control the “treatability” of decor paper. Suppli-ers of resins, decor papSuppli-ers and the treating machines are unable to provide useful insights into the physics of saturation at both a macro and microscopic level. Many raw papers, however, perform differently and take up different amounts of resin during saturation. Some papers are anecdotally “difficult to saturate” and tend to produce more rejects during laminating in short cycle LPM presses.
1.2
Brief overview of LPM manufacturing process
The production of LPM coated panel board occurs in three stages, firstly the manufacture of the substrate, either particleboard or medium density fibreboard (MDF). This is followed by treatment of the decor paper with resins (impregnation and coating) and finally pressing of the treated paper onto the substrate (laminating). This thesis commences by investigating problems resulting from fluid imbibition in the first stage of the treatment of the decor papers (described below).
1.2.1 First stage of treating; impregnation of decor paper with urea
formalde-hyde resin
Initially decor paper is impregnated with a urea formaldehyde (UF) resin by passing the paper under very slight tension over the top of a pre-wetting roller, the bottom third of which is in a bath containing UF resin (Figures 1.1 & 1.2). The film of resin picked up on the roller is transferred onto the bottom side of the paper, and the resin penetrates into the paper. The paper then travels over a series of rollers to give the resin time to migrate from one side to the other and displaces air from the paper. The paper is then completely immersed in a resin bath to wet the top-side of the paper (Figure 1.1) and it is then dried to a specific moisture content in a series of ovens. If the paper is dipped into the resin bath too soon after the pre-wetting rollers, a layer of air could be trapped in the core thereby preventing the paper from being adequately saturated with the UF resin.
This thesis relates to the part of the process where the paper comes into contact with the pre-wetting roller to just before it is dipped into the resin bath after the first sky roller and, in fact, probably only to the first metre of travel of the paper after contact with the pre-wetting roller. This constitutes about 0.5 s or a fraction of a percent of the whole process time, yet it is during this stage that the success or failure of the whole process is ordained. Surprisingly this critical part of the process has been and remains the least understood part of the whole process of manufacturing LPM panels.
1.2.2 Second stage of treating; coating with melamine formaldehyde resins
The next stage of the treatment process involves coating the saturated and dried UF resin im-pregnated paper with a melamine formaldehyde (MF) resin. This is usually done by applying the resin onto the paper using gravure rollers. A gravure roller contains thousands of small trapezoidal cells that fill when the roller passes through a resin bath. The excess resin is scraped off the roller so that the desired quantity of resin remains in the cells of the roller. As the paper travels over the other side of the roller, the resin is transferred to the paper. The quantity of resin transferred is very accurately controlled by the differential between the circumferential speed of the gravure roller and the line speed of the paper. The resin is then smoothed over the paper by a series of wire and smoothing rollers. The paper is finally dried in a series of accurately controlled convection ovens. The treated paper is then ready for laminating onto the panel substrate to produce the final product.
1.2.3 Consequences of inadequate penetration of resin at first stage
The aim of the first stage of the treatment process is to fill the void spaces (pores) of the paper with relatively inexpensive UF resin solids so that a minimal amount of the more expensive MF resin is used in the second stage to coat the paper. The MF resin is substantially more durable than UF resin and must contiguously cover the surface (Adam and Kamutski, 1993). Melamine impregnated paper is ten times more impermeable than paper treated with UF resin alone (Ebrahimzadeh, 1998). However, if MF resin flows into voids in the paper remaining after UF resin treatment, then insufficient MF resin may remain on the surface of the paper to effectively coat it. Defects in LPM may occur as a result of this mechanism because the MF resin used to treat decor paper is formulated to flow just prior to full cure in order to achieve the desired textured finish on the surface of the panel. To overcome this problem it has often been necessary to add excess MF resin to the paper to ensure there will be enough on the surface to provide a good protective coating. This is expensive and can lead to longer pressing cycles with consequential lost production and possible over-cure of the coating resin.
Figure 1.2: Images of pre-wetting roller, closeup on the left and showing the positions of the sky rollers
on the right. Note that only the bottom third of the pre-wetting roller is in the resin bath. The roller rotates against the travel of the paper enabling a film of resin on the roller to come into contact with the paper. Arrows denote the direction of movement of the paper and the prewetting roller.
1.3
Aim and purpose of research
1.4
Structure of the thesis
In addition to this chapter, the thesis is comprised of 8 chapters as follows;
Chapter 2 is primarily a review of the literature of treatment of decor papers, the techniques used to study fluid flow in paper and previous research into fluid flow in paper. Most previous research on the latter is based on the Lucas-Washburn theory (Lucas, 1918; Washburn, 1921), of the penetration of liquids into porous materials where the rate of penetration is a function of the balance between surface tension forces and viscous drag. Interfacial contact angle is assumed to be constant and the pore morphology is reduced to an equivalent cylindrical pore. It has long been recognized that Lucas-Washburn over simplifies the morphology of paper, which, in reality, is a geometrically complex material made up of a cellulose fiber matrix in many cases modified with a consolidated mass of pigment and binder. A critique of the Lucas-Washburn theory also forms part of Chapter 2.
Chapter 3 discusses the experimental identification of the causes and nature of the defects in pressed LPM is examined experimentally. The effect of level of UF resin saturation and paper type on defects in the MF coating is examined. Scanning electron microscopy (SEM)1 was used to examine the morphology of defects and Raman microscopy was used to study the distribution of MF resin in the paper.
Chapter 4 examines the physical characteristics and fluid imbibition behaviour (simulating conditions at the pre-wetting roller) of nine different decor papers. The level of defects in the pressed papers (reported earlier in Chapter 3) are related to these characteristics. Relationships between imbibition and physical characteristics are also established.
Chapter 5 reports on studies of the effects of liquid contact angle and surface tension on imbibition into simple model systems thus removing the confounding effect of the structural complexity of real paper. Mechanisms of fluid transport are presented.
Chapter 6 reports on attempts to identify the actual mechanisms of fluid flow in both un-sized and un-sized papers using cryo-SEM and a newly developed technique involving cryo 2-photon confocal laser scanning microscopy (CLSM).
Chapter 7 reports on extensions of the studies covered in Chapters 3, 4, 5 & 6 into more complex paper systems. This involves papers with different filler types and amounts, two dif-ferent fluid types, and modifications of the surface energy of the papers using plasma treatment to remove any chemical heterogeneity on the paper surface. This enables the determination of the impact of fillers on the morphology of pores within the paper structure and on its effects on fluid imbibition.
Chapter 8 discusses extensions of the work presented in Chapter 7 enabling identification of the causes of the paper effects on saturation demonstrated with the decor papers in Chapters
1The term ’SEM’ is used to indicate both the process (i.e. scanning electron microscopy) and the equipment
3 & 4.
Chapter 9 concludes the thesis by discussing the main findings of the thesis in relation to the aims and introduces areas of future research.
Literature review
This chapter reviews the literature on the treatment of decor papers, the experimental methods used to study fluid flow in paper and previous research on fluid flow in paper. Its purpose is to allow the reader to understand material presented in subsequent experimental chapters. It is not intended to be a comprehensive review of fluid-paper interactions.
2.1
Previous research into resin impregnation of decor papers
Arledter (1957) examined the factors affecting the penetration of paper by oil and resin. He concluded that any penetration test method based on perception of the human eye, or any method which did not use test solutions with precisely controlled temperatures and viscosities could not yield reliable test data, particularly if the same paper was compared at different times and by different observers. Arledter (1957) found that the time of resin penetration in different papers varied between 0.5 to 1000 seconds and judgement as to when the end point of penetration was reached varied for different observers by a wide margin. He stated that resin solvents should be removable from the impregnated paper structure without excessive resin migration and without leaving closed air voids. The purpose of Arledter’s insightful paper was to firstly determine the best methods or instruments to determine the resin penetration rate of absorbent papers in general, secondly to investigate what test solutions or test methods were most suitable for measuring treating performance of absorbent papers and finally to inter-relate paper structure factors, resin penetration rate and resin pick up. Even today these areas are worthy of study as our understanding of the absorption of liquids by paper is incomplete.
Cussons (1997) in an unpublished report has provided the best outline of what happens during the resin impregnation process of decor paper in a commercial treater. He discussed various paper and liquid effects on treating. He stated that most decor papers had pore size distributions of 2-50 µm and that flow of resin mainly occurred in the region>10 µm. Cussons (1997) stated that only 50% of the total void volume in decor paper is filled with resin using standard treatment methods and pore size distribution is the most important factor affecting resin impregnation.
Schnieder (1997a) divided resin impregnation of decor papers into four stages:
1. Phase 1-10 milliseconds when surface pores fill.
2. Phase 2; 10-80 ms, fiber walls swell after first contact with resin i.e. they absorb water. The resin solution then penetrates the pores very quickly.
3. Phase 3; 80-400 ms, absorption slows down. After 100 ms the resin strikes through, which means that it reaches the backside of the paper. After 400 m/s 80% of the pores are full and paper has reached it’s final thickness.
4. Phase 4; 400-2000 ms, the rate of absorption slows down with saturation being reached after 2000 m/s.
There were no details in the study as to how she identified within-fibre imbibition.
flow of MF resin into the paper during pressing (Chapter 3) Therefore the rest of this review focusses on fluid flow and the methodology to measure and model fluid flow in paper.
2.2
Review of experimental methods used in the thesis
2.2.1 SEM in the study of liquids and paper
SEM is used to image raw and resin impregnated papers (Chapters 3, 7 & 8) and cryo-SEM, a new technique involving freezing of the sample immediately after liquid contact, is used to study the imbibition of aqueous solutions into paper (Chapters 6 & 7).
Oliver and Mason (1976) described the use of SEM to study stationary and moving liquid drops on paper surfaces and demonstrated the effect of surface roughness on the morphology of the liquid droplets. Molten drops of polythene and polymethylmethacrylate were applied to paper and the process of spreading and solidification of the droplet was observed. Solid droplets were mounted on a stub, gold coated and imaged. Morphological changes in droplets were complicated by contraction in their volume during solidification. The authors concluded that the complicated structure of paper and limitations of SEM prevented qualitative analysis of the morphology of liquid drops applied to paper.
Forsberg and Lepoutre (1994) used environmental scanning electron microscopy (ESEM) to observe moderate structural changes at the surface of paper fibres as water condensed onto the surface in a high moisture environment. They stated that cellulosic fibers are sensitive to moisture during printing with offset or water-based gravure inks, and interactions between wa-ter and paper can lead to undesirable changes in the paper structure. The purpose of their study was therefore to study the roughening phenomenon in-situ. They found a roughening of the paper surface but made no comments on the distribution of fluids nor imbibition mechanisms. Using this technique the authors were unable to obtain a “snapshot” of the mechanisms of im-bibition in paper because as soon as the water condensed it would have imbibed into the paper almost immediately.
Liukkonen (1997) also used ESEM to examine the interaction of water with paper surfaces and found that the electron beam caused the water droplets to evaporate. Also the drops con-tinued to grow and merge over time. Cryo-SEM has the potential to overcome problems of evaporation of the imbibing fluid and could enable the study of fluid flow in unsized papers as well as sized papers.
2.2.2 Cryo 2-photon confocal laser scanning microscopy (CLSM)