Abstract— This paper describes the experimental behaviour of a flat pratt truss which is entirely fabricated using cold-formed steel (CFS) angle sections. Three modeled specimens of cold-formed flat pratt truss of each 1m span were fabricated with back-to-back angle sections of 50X50X3.0mm. Five joints were made at the junction of top chord members and the vertical members, Similarly five joints were also made at bottom chord members. The intersection of chord members and vertical members were connected by bolts to the gusset plates at the junction. Experimental tests were performed by applying five concentrated loads at each junction until the failure of the member was taking place. Numerical analysis was also carried out for the truss using the finite element software and the obtained results were compared with the arrived experimental results. Both the experimental and analytical results reveals that the predominant failure of the truss occurs at the top corner junction which is nothing but a shear failure and at the mid junction of the bottom chord member which is a sagging or bending failure. Based on the experimental results it was observed that the ultimate load of the truss was increased by 33% due to the presence of gusset plates and the shear strength of the bolts in the truss. The displacements corresponding to the ultimate loads were also been noted at the junction and their behaviour were analyzed in detail as a comparative study of both experimental and analytical results.
Key words— Angle sections, flat pratt truss, gusset plate, truss joints.
I. INTRODUCTION
A. General
The use of cold formed steel (CFS) structures in residential construction has become increasingly popular all over the world in recent decades, and is now a highly competitive alternative system adopted to the traditional structure system. CFS is commonly used in commercial and industrial buildings as a secondary framing material in roof truss system. Some of the widely known advantages of CFS framing are (i) lighter in weight, (ii) reduces the transport and handling cost, (iii) easier prefabrication process and (iv) can be easily removed and therefore can be used for temporary structures.
The main aim of designing the CFS framing systems is that the dead weight of the structure will be reduced to a greater extent which in turn reduces the total cost of the project. In recent years, the use of CFS in primary framing systems has been gaining its own popularity in foreign countries. Further in addition to this development, this research work has been carried out with a flat pratt truss which is entirely made up of CFS angle sections. As the CFS sections are lighter in weight smaller spans of the
Revised Manuscript Received on April 12, 2019.
Palanati Durga Prasad, Academic Consultant ([email protected])
Dr.K.V.N.Sunitha, Professor ([email protected])
Dr.B.Padmaja Rani, Professor ([email protected])
industrial roof are taken into consideration in this work. Both the analytical and experimental investigations regarding the behaviour of CFS pratt truss has been carried out for a span of 1m with 5 junctions of each top and bottom chord members with the vertical and diagonal members. B. Roof Trusses
Roof trusses are the horizontal steel structural system which consists of various members such as top chord members, bottom chord members, vertical members, diagonal members and purlins. These roof trusses are commonly used in industrial buildings in order to avoid the presence of intermediate steel columns inside the span of the industrial structure. The load transfer will be from the roof sheet to the purlins, then to the roof truss and finally from the truss to the vertical steel columns of the structure. The main scope of this paper consists of analyzing a complete roof truss (flat pratt truss) both experimentally and analytically. In the connection of the truss members the concept of using gusset plate is taken into consideration. The type of connections preferred for the truss is bolted type of connections. Each junction is provided with a gusset plate that is connected to the chord members, vertical members and as well as the diagonal members. This method of using gusset plate at the junction of connection is known as offset type of truss connections.
In general CFS channel sections are used in the roof truss systems. For a change from this criteria back to back angle sections are used as truss members in this research work. All the loading conditions as per Indian Standards have been applied analytically on to the top chord members of the truss and have been analyzed as a comparative study with the experimental results which are as follows.
II. EXPERIMENTAL PROGRAMME
B. Prefabrication process
Generally CFS sheets are manufactured by the process of press breaking method. All the angle sections of the truss were fabricated with 3mm CFS sheets and the gusset plates at the junction were fabricated with 5mm CFS sheets. The prefabrication process was done by three stages (i) cutting of CFS sheets to the required dimension, (ii) bending of CFS sheets that has been cut (for angle sections 900 bend was done) and (iii) arrangement of truss members which include bolt hole drilling, cutting of angle sections to the desired length and bolting of truss in the drilled bolt hole to arrive at the required flat pratt truss with corresponding dimensions and specifications.
Experimental Study on use of Cold Formed
Steel Sections as Truss Members
Sections as Truss Members C. Specimen details
Each of the three specimens were fabricated 1m span with an overall depth of 500mm with 5 junctions at top and bottom chord members. Each span between two junction were fabricated for a span of 250 mm . 3mm thick CFS sheets were used for angle sections and 5 mm thick CFS sheets were used for the supporting gusset plates. The connections of the gusset plate and the angle sections were done using 1.5 inches long 12mm dia HSFG bolts.
Other than this the load has to be transferred to five junctions present on the top chord member. To make this possible a spandrel beam was fabricated with 5 rollers of 30mm dia were situated at 250mm intervals and were welded at the bottom of the spandrel beam. Thus the load applied was equally transferred from the spandrel beam to the fabricated flat pratt truss through the rollers. The image of the fabricated flat pratt truss and the spandrel beam is shown below in Fig. 1.
Fig.1 Image of flat pratt truss and spandrel beam Experimental setup:
The testing was carried out in a 100 ton capacity universal testing machine (UTM). All of the three specimens were subjected to 5 point loading condition at each top chord junction. Each specimen was arranged in the UTM with simply supported conditions having an effective span of 1m in length. Dial gauges were provided at top chord corner junctions and at the bottom chord middle junction.
Load was applied at the top middle of the spandrel beam which was equally transferred to the five junctions at the top chord junctions through the rollers. The UTM was connected to the data acquisition system through which the amount of load applied was digitally noted along with corresponding deflections. Load was applied gradually at a uniform rate until the reversal of the specimen was observed in the data acquisition system which signifies that the failure of the specimen has occurred. The experimental set-up of the testing specimen has been shown below in Fig. 2.
Fig.2 Experimental set-up of the flat pratt truss specimen
Experimental Results
a. Specimen-1
The truss specimen-1 which was fabricated for an effective span of 1m was placed in the UTM for testing with a 5 point roller supported spandrel beam placed over it for loading purpose. Dial gauges were fixed at the top corner joints and at the bottom middle joint of the specimen. An ultimate load of 73.72KN was recorded on the data acquisition system that was equally transferred to the five joints of 14.744KN at each of the top chord joints, after which the load started to reverse which clearly signified the failure of the specimen. The corresponding deflections of the joints were noted which is as shown below in Table-I.
Table-I Joint Displacement of the truss specimen-1
Joint
number
Joint location in the
truss
Deflection
(mm)
1
Top left corner of
the truss
2.85
2
Bottom middle of
the truss
3.13
3
Top right corner of
the truss
2.83
b. Specimen-2
The truss specimen-2 which was fabricated similarly to specimen-1 for a depth of 500mm with the spandrel “I” beam of 100mm depth with 5 point roller supports were placed on the in the UTM for testing . Deflections were measured at the joints using the dial gauges at top corner joints and bottom middle joint. The data acquisition system recorded an ultimate load of 71.32KN which was transferred equally to the five joints to a value of 14.26KN at each of top chord joints, after which reversal of load was observed. The displacements at the joints were noted for the ultimate load which is as shown in Table-II.
Table-II Joint Displacement of the truss specimen-2 Joint
number
Joint location in the truss
Deflection (mm) 1 Top left corner of
the truss
2.52 2 Bottom middle of
the truss
2.77 3 Top right corner of
the truss
2.56
c. Specimen-3
corresponding to the applied load. A value 76.12KN was noted on the data acquisition system as the ultimate load after which load reversal was occurred. This ultimate load was equally transferred to five joints to a value of 15.22KN at each of the top chord joints. The displacement corresponding to the applied load at each joint is tabulated below in Table-III.
Table-III Joint Displacement of the truss specimen-3 Joint
number
Joint location in the truss
Deflection (mm) 1 Top left corner
of the truss
3.18
2 Bottom middle of the truss
3.61 3 Top right corner
of the truss
3.10
Therefore by taking the average of the loads and displacements obtained from each specimen we get an ultimate load of 73.72KN from UTM and an ultimate load of 14.744KN at each joint. On the other hand we get the averaged displacement of 2.85mm at the top left corner joint, 3.13 at bottom middle joint and 2.83mm at top right corner joint.
Failure Pattern of Truss
The observed type of failure in all the three specimens were (i) shear failure at the top corner joints and (ii) bending or sagging failure at the bottom middle joints. The brief explanation of the failure pattern of the all the three specimens is discussed below
a. Shear failure
As the load was applied gradually on to the joints, the truss was resisting the loads for the first few amount after which the top left and right corner gusset plates were subjected to bending. But still the load was resisted due to the strength of the plates and the shear capacity of bolts. This was observed under constant displacement value. At one point the load applied started to reverse its value with constant deflection. But the bolt hole of the gusset plate and angle section started to elongate which clearly denotes us the shear failure of the truss at both of the top corner joints. The image of shear failure of the Truss specimen is shown below in Fig.3.
Fig.3 Shear failure of the truss specimen at top corner joint
b. Bending or sagging failure
Along with the shear failure another failure was also observed when the ultimate load of the specimen was
attained. This type of failure was the bending failure that occurred at the bottom chord member. The maximum bending was noted at the mid span of the bottom chord member. The displacement was noted at the ultimate load using dial gauges.
As we know that this type of failure most often occurs in horizontal beams and thus this failure of the specimen denotes us that the whole truss acts monolithically as a horizontal member of roofing system. The image of the sagging of tested specimen is shown below in Fig.4.
Fig.4 Bending or sagging failure of the truss specimen at bottom mid span
III. NUMERICAL ANALYSIS
Modeling of the truss
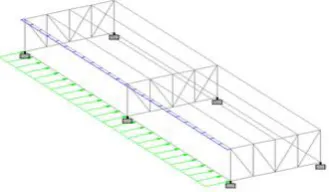
Numerical analysis was also carried out using the finite element software (STAAD.PRO) that was modeled similar to that of the experimental test specimen with the following conditions namely (i) The span of the truss was modeled as 1m, (ii) The intermediate vertical members were modeled at 250mm spacing, (iii) The height of the truss was taken as 500mm and the height of the structure from the floor level to the bottom of the truss was taken as 6m, (iv) The truss acts as rafters for the roof and were located at 2.00m intervals in the model, (v) Purlins were provided at every joint where the diagonal members, vertical members and the top chord members were met together and (vi) All the loads namely dead load, live load ,wind load etc., were applied as uniformly distributed load (UDL) on the purlins which were provided perpendicular to the pratt truss. The diagrammatic representation of the modeled flat pratt truss is shown below in Fig.4.
Sections as Truss Members The next step was modeling with the assigning of steel
angle sections for the modeled members. The steel sections were given in terms of inches in the software. Therefore, the sections which were used in the experimental process were converted to inches and were assigned to all the members of the truss.
Loading conditions of the truss
[image:4.595.95.258.370.451.2]The following step after assigning the steel section to the truss was the process of applying different loading conditions and loading combinations to the truss. The various loadings to the truss were applied based on following conditions (i) The dead load to the truss were applied on the purlins as UDL based on the data given in table no: 1 of (Indian Standards) IS 875 (part-1):1987 codal provision, (ii) The live load to the truss were applied based on the data given in table no: 2 of IS 875 (part-2):1987 codal provision, (iii) The wind load to the truss were applied in all the four directions based on the data given in IS 875 (part-3):2015 and (iv) The loading combinations given to the model was provided based on data given in table no: 4 of IS 800:2007 codal provisions. The images of various load applied to the modeled truss is as shown below in Fig.5, Fig.6 and Fig.7.
[image:4.595.326.529.499.727.2]Fig.5 Application of dead load and live load on purlins
Fig.6 Application of wind load in x-direction on purlins
Fig.7 Application of wind load in z-direction on purlins
There were about nine different loading combinations as per the codal provisions namely (i) 1.5DL+1.5LL, (ii) 1.2DL+1.2LL+1.2WLX+, (iii) 1.2DL+1.2LL+1.2WLX-, (iv) 1.2DL+1.2LL+1.2WLZ+, (v) 1.2DL+1.2LL+1.2WLZ-, (vi) 0.9DL+1.5WLX+, (vii) 0.9DL+1.5WLX-, (viii) 0.9DL+1.5WLZ+ and (ix) 0.9DL+1.5WLZ-.
Where,
DL - Dead load applied to the truss, LL - Live load applied to the truss,
WLX+ - Wind load applied to the truss in positive “x” direction,
WLX- - Wind load applied to the truss in negative “x” direction,
WLZ+ - Wind load applied to the truss in positive “z” direction and
WLZ- - Wind load applied to the truss in negative “z” direction.
Numerical analysis results
After the assigning of sections and loadings to the truss, the modeled program was run in order to get the analytical results. The analytical results of the truss namely the axial force in y-direction at the top left corner joint, top right corner joint and at the bottom middle joint were noted. Other than this the deflections corresponding to ultimate load of the joint were also noted.
[image:4.595.81.246.500.596.2]The analytical results were noted and it was observed that the obtained results of the modeled truss were very much similar to that of obtained experimental results. The obtained loads applied at failure of the joints were (i) 10.23 KN at the top left corner joint, (ii) 10.64 KN at the bottom middle joint and (iii) 10.18 KN at the top right corner joint. The deflections corresponding to ultimate load was tabulated which is as shown below in Table-IV and the failure pattern of the truss is as shown below in Fig.8.
Table-IV Joint Displacement of the truss (from numerical analysis)
Joint number
Joint location in the truss
Deflection (mm) 1 Top left corner
of the truss
2..12
2 Bottom middle of the truss
2.46 3 Top right corner
of the truss
2.08
[image:4.595.86.246.655.756.2]IV. RESULTS AND DISCUSSIONS Experimental results
a. Truss specimen-I
The observed and recorded values of the experimental results of the truss specimen-1 of top left corner joint, bottom middle joint and top right corner joint were plotted in a graph with Load (KN) in X-axis and corresponding deflection (mm) in Y-axis and compared as shown in Graph-1 below
Graph-1Load vs deflection behaviour of top left corner joint, bottom middle joint and top right corner joint of
truss specimen-I
The curves of graph-1 clearly depicts that the failure has convincingly occurred at the top corner joints which is nothing but the shear failure. The curve of bottom middle joint shows that the failure has not occurred but has started to occur where the load got reversed. Other than this the vertical line in the top joint curves shows the elastic to plastic property of steel which is nothing but the increase in load was not creating the respective increase in deflection. This point is the yielding state from which the ultimate point has been attained and then the failure of the specimen has occurred by the reversal of load.
b. Truss specimen-II
The observed and recorded values of the experimental results of the truss specimen-II of top left corner joint, bottom middle joint and top right corner joint were plotted in a graph with Load (KN) in X-axis and corresponding deflection (mm) in Y-axis and compared as shown in Graph-2 below
Graph-2Load vs deflection behaviour of top left corner joint, bottom middle joint and top right corner joint of
truss specimen-II
The curves of graph-2 clearly give us a similar failure pattern to that of truss specimen- I such that the shear failure has occurred at top corner joints. The bottom middle joint curve clearly shows that the failure has not yet occurred but has started to occur where the load got reversed. Other than this the vertical line in the top joint curves convincingly shows the yielding property of steel specimen where the increase in load does not create any increase in deflection . Thus a similar results has been observed in truss specimen-II as that of truss specimen-I.
c. Truss specimen-III
The observed and recorded values of the experimental results of the truss specimen-III of top left corner joint, bottom middle joint and top right corner joint were also plotted in a graph with Load (KN) in X-axis and corresponding deflection (mm) in Y-axis and compared as shown in Graph-3 below
Graph-3Load vs deflection behaviour of top left corner joint, bottom middle joint and top right corner joint of
truss specimen-III
The curves of graph-3 also clearly indicate that a similar failure to that of truss specimen- I and truss specimen-II has been noted, which is nothing but the shear failure at top corner joints. The curve of bottom middle joint shows that the failure has not occurred but has started to occur where the load got reversed that is such as that of other specimens. Other than this the yielding property from elastic to plastic state of steel specimen has been clearly shown in the vertical line in the curves of top corner joints where the increase in load does not create corresponding increase in deflection respectively and then the ultimate load has been attained and then failure has occurred through the reversal of load. Thus all the three specimens show us similar results.
B. Numerical Analysis results
Sections as Truss Members
Graph-4Load vs deflection behaviour of top left corner joint, bottom middle joint and top right corner joint
(numerical analysis result)
The curve of graph4 clearly shows us the failure of the truss obtained by the results of numerical analysis. The results of the truss shows that the failure has occurred at the top corner ends that is clearly shown in the reversal of the curve. On the other hand the bottom midddle joint has started to fail which is similar to that of obtained experimental results. The main controversy between the numerical result and experimental result was that the ultimate load of numerical analysis was slightly lesser than that of experimentally obtained load which also clearly shows through the change in the curves. The main reason for this change in value was that the gusset plates and the bolts was not modelled in the software. Instead of which the members were connected by member to member through the nodes of the softwares. Thus the change in the value of load is mainly due to the presence of gusset plates and the bolts that increased the ultimate load carrying capacity of the experimentally tested value by 33% of its numerically obtained value.
V. CONCLUSION
The main objective of this research work has been successfully attained. The behaviour of flat pratt truss was studied by performing the respective experimental and numerical process. Based on the carried out experimental and numerical results the following conclusions were obtained:
1. The averaged ultimate load that was obtained experimentally by the junction of the flat pratt truss was 14.744 KN.
2. The averaged deflection corresponding to the ultimate load was noted as 2.85 mm for top left corner joint, 3.13 mm for the bottom middle joint and 2.83 mm for the top right corner joint.
3. On the other hand the ultimate load which was arrived by numerical analysis method was noted as 10.64 KN and the corresponding deflection value was recorded as 2.46 mm.
4. It was observed in all the three specimens that the failure pattern occurred in the specimen was noted at the top corner joints(which is a shear failure) and bottom middle joint(which is a bending or sagging failure) and the yielding property of steel has been noted through the curves shown where the increase in load was not creating the corresponding increase in deflection.
5. This change in the values of experimentally obtained and numerically obtained ultimate load is mainly because of the reason that the gusset plates and the bolts have not been modeled in the software. In other words it can be said that the presence of gusset plate and bolts has increased the ultimate load carrying capacity of the truss specimen.
6. Thus it can be clearly concluded that the presence of gusset plate and the bolts has increased the ultimate load carrying capacity of the truss by 33% of its original value. This result will be laid as a strong foundation for using roof trusses that are entirely made up of cold formed steel (CFS) sections.
REFERENCES
1. J.L.Dawe ,Yi Liu and J.Y.Li “Strength and behaviour of
cold-formed steel offset trusses” Journal of
Constructional Steel Research 66(2010)
2. Mehran Zeynalian ,Adele Shelley and H.R.Ronagh “An experimental study into the capacity of cold formed steel truss connections” Journal of Constructional Steel Research 127(2016)
3. Mehran Zeynalian ,Sattar Bolkhari and Pooria Raeei “Structural Performance of cold formed steel trusses used in electric power substations” Journal of Constructional Steel Research 147(2018)
4. M.F. Hassanein, Mohamed Elchalakani and A.A.
Elkawas “Design of cold-formed CHS braces for steel roof structures” Thin Walled Structures 120(2017) 5. Chris Mathieson, G. Charles Clifton and James B.P. Lim
“Novel pin-jointed connection for cold-formed steel trusses” Journal of Constructional Steel Research 116(2016)
6. Raul Zaharia and Dan Dubina“Stiffness of joints in bolted connected cold formed steel trusses” Journal of Constructional Steel Research 62(2006)
7. Zilvinias Bucmys and Alfonsas “Component method in the strength evaluation of cold-formed steel joints” Procedia Engineering 172(2017)
8. Amin Ahmadi ,Chris Mathieson and Raj Das “An
experimental study on a novel cold-formed steel connection for light gauge open channel steel trusses” Journal of Constructional Steel Research 122(2016)
9. IS:811-1987“Specification For Cold Formed Light
Gauge Structural Steel Sections”
10. IS:875 (Part 1)-1987“Dead loads-Unit weights of
Building Materials and Stored Materials”
11. IS:875 (Part 2)-1987 “Live Loads and Imposed loads for the structures ”