Abstract— Applying data mining and machine learning techniques on Moodle logs is an emerging trend that can help track student’s performance and decrease the failure rate. Due to Moodle’s limitation to provide these features, this study was conceptualized. The study made use of historical data from Moodle logs of past academic years to pre-process and develop machine learning models using an open source data mining tool named Weka. This study made use of predictor attributes related to study behavior of students such as Course Viewing Time, Resource Views, Quiz Taken, Replied in Discussions, and Viewed at Weekends. However, it was found out that predictor attributes such as Activities Completed, Course Views and Assignment Passed are the ones which are strongly correlated to students’ performance. Moreover, the predictive accuracy of a model improves depending on the machine learning algorithm being used. Algorithms such as J48, Random Forest, JRip, and OneR have been consistently performing well regardless of the model it is being trained into; and, achieved a predictive accuracy as high as 96.42%. The study was able to reflect the predicted results of Weka back to Moodle through an integrator and developed block using Moodle API. Finally, the developed application was evaluated by IT Experts using the ISO 25010 criteria.
Index Terms—data mining, machine learning, predictive analytics, predict students’ performance, Moodle logs
I. INTRODUCTION
The growth of information available online as well as the stored data in huge organizations led to a quest of discovering hidden information that is useful for decision making. Imagine shopping malls and supermarkets using all the swiped data of their customers to identify frequently bought items and turn this information to targeted marketing and loyalty programs.
An emerging field in education called Educational Data Mining (EDM) is designed for automatically extracting meaning from large repositories of data generated by or related to people's learning activities in educational settings [1]. For example, several learning management systems (LMSs) track information such as when each student accessed each learning object, how many times they accessed it, and how many minutes the learning object was displayed on the user's computer screen.
LMS accumulate a vast amount of information which is very valuable for analyzing students’ behavior and could create a gold mine of educational data [2]. By applying data mining techniques on student data in LMS, we can obtain knowledge that can help to improve quality of education, student’s performance and decreased failure rate. It is also
Revised Manuscript Received on April 12, 2019.
Edmund D. Evangelista, DIT Student, St. Paul University of the Philippines, Cagayan 3500, Philippines. (E-mail: [email protected])
helpful in early identification of dropouts and students who need special attention and allows the teacher to provide appropriate advising/counseling.
LMS produce information of high educational value, but usually so abundant that it is impossible to analyze it manually [3]. Tools to automatically analyze this kind of data are needed. Unfortunately, these platforms do not provide specific tools to allow educators to thoroughly track and assess all learners’ activities while evaluating the structure and contents of the course and its effectiveness in the learning process [4]. Moodle, even in its latest learning analytics can only detect students at risk of dropping but not failing. With these limitations of predictive analytics in the existing framework, this study was conceptualized.
This study aimed to develop machine learning models using study behavior predictors of students’ academic performance through Moodle logs. Specifically, historical data from Moodle logs were harvested and analyzed using Weka (Waikato Environment for Knowledge Analysis) data mining tool to determine the study behavior predictors that are correlated to students’ academic performance. Weka is an open source suite of machine learning software written in Java that contains a collection of visualization tools and algorithms for data analysis and predictive modeling. Datasets were harvested based on initial predictors such as Course Views, Course Viewing Time, Resource Views, Quiz Taken, Assignment Submitted, Discussion Views, Replied in Discussions, Viewed in Mobile, Viewed at Night, Viewed at Weekends, and Final Grade. Best features were identified among the initial predictors through the feature selection techniques of Weka and repeatedly trained it using algorithms such as J48, Random Forest, JRip, OneR, Logistic Regression, Multilayer Perceptron, Bagging, and K-Nearest Neighbor. The algorithm which acquired the highest predictive accuracy having false positive and false negative predictions will be used to develop the models.
II. CONCEPTUAL FRAMEWORK
The conceptual framework of this study was adopted on the concepts of Cross Industry Standard Process for Data Mining (CRISP-DM) and Predictive Analytics Process Model [5].
CRISP-DM, is an open standard process model that describes common approaches used by data mining experts making it the most widely-used analytics model in data mining [6]. It was conceived in 1996 and became a
Development of Machine Learning Models
using Study Behavior Predictors of Students’
Academic Performance Through Moodle
Logs
STUDENTS’ ACADEMIC PERFORMANCE THROUGH MOODLE LOGS
European Union project under the ESPRIT funding initiative in 1997 [7]. It is also commonly described this model as both a process and a methodology.
As a methodology, it includes descriptions of the typical phases of a project, the tasks involved with each phase, and an explanation of the relationships between these tasks. As a process model, it provides an overview of the data mining life cycle.
[image:2.595.51.283.249.367.2]The researcher selected this process model over the other existing models because its framework has been anchored on business understanding (data mining goals) that other models failed to emphasize. The process or methodology of CRISP-DM contains six major steps namely: (1) business understanding, (2) data understanding, (3) data preparation, (4) modeling, (5) evaluation, (6) deployment [8].
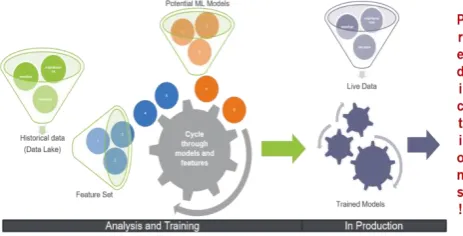
Figure 1. Predictive Analytics Process Model
Figure 1 indicates that the process model starts by gathering data of interest from the data lake (which is the Moodle database in this study). In an iterative process, features from the Moodle logs are selected using feature selection techniques of Weka such as CFS Subset Eval and then trains the models based on the predictors that are correlated to students’ academic performance.
Data mining techniques, statistical methods, and machine learning algorithms are used to determine the best features and the best models. Once an appropriate feature set and model are generated, thresholds are set to determine prediction results. The model/s with best predictive accuracy will be used and are then put into production to begin producing predictions about future data.
Predicted results generated by the model/s are reflected back to Moodle through an integration table and Moodle block developed by the researcher.
III. STATEMENT OF THE PROBLEM
The study aims to develop machine learning models that will be used to predict students’ performance using Moodle Logs that are related to their study behavior. Specifically, the study revolves around the following questions:
1. What study behavior attributes in Moodle logs tend to be useful in predicting students’ performance in each of the five courses?
2. What data mining techniques will be used to pre-process the dataset that was formed from the selected attributes of Moodle logs in each of the five courses? 3. What attributes of the dataset tend to provide the
most accurate predictions?
4. What are the limitations of the existing framework
for predictive analytics?
5. What application tool can be developed to address the limitations of the framework for predictive analytics using machine learning approach?
6. Is there a significant difference in the predictive accuracy of the machine learning models in terms of the algorithms being used?
7. Is there a significant difference in the predictive accuracy of the machine learning models when attributes were feature selected?
8. What is the extent of compliance of the developed application tool in accordance with ISO 25010 standards?
9. What enhancement can be done to improve the developed application tool for predictive analytics?
IV. METHODOLOGY
Research Design
The study made use of descriptive and correlational research to develop and evaluate machine learning models for five Basic Computer Science courses with developed Moodle block to reflect predicted results back to LMS courses.
[image:2.595.307.548.485.616.2]The system architecture of the study has adopted the standard predictive analytics workflow and was improvised to tailor fit into the existing parameters and environment of the study. It is represented by the three major components as shown in figure 2 namely: harvest data, modeling, and development. Data are harvested from the Moodle logs through MySQL Workbench tool, a unified visual database design tool that enables a DBA, developer, or data architect to visually design, model, generate, and manage databases. The modeling and development of machine learning model will be done using Weka.
Figure 2. The System Architecture
delivering new software capability every 2-4 weeks. Moreover, the block will be written using PHP and MySQL web technology along with the utilization of built-in Moodle Application Programming Interface (API).
Participants of the Study
The direct participants of this study were selected faculty handling courses such as CSC102 (Application Development for Beginners), CSC122 (Intro to Computer Programming), CSC123 (Fundamentals of Web Design), CSC125 (Object Oriented Programming I), and CSC130 (Discrete Structures). The same faculty along with the three (3) Moodle Administrators will be purposively selected to evaluate the proposed system based on ISO 25010 criteria.
Instrumentation
The proposed system was tested by the IT experts (selected faculty and Moodle Administrators). The system evaluation tools included items to describe the system in terms of functional suitability, performance efficiency, usability, reliability, security, maintainability, and portability. The main research instrument that was used in this study is the questionnaire that was developed based on the ISO 25010 quality standard.
Data Gathering Procedure
Before gathering and collecting Moodle logs and required data, the researcher sought the proper authorization and permission to conduct research from the Vice President for Academics and the Director of the E-Learning Center of Excellence of Gulf University for Science and Technology, Kuwait.
Data Analysis
The data collected will be tabulated, analyzed, interpreted using both descriptive and inferential statistics. It will be based on the given problem statement. The analysis, training, and development of machine learning models will be done using Weka for each of the courses covered in this study.
Mean was used to analyze the average rating of the IT experts with respect to the compliance of the application that was developed in this study in relation to the ISO standard.
V. RESULTS AND DISCUSSIONS
The ultimate goal of this study was to develop, implement, and evaluate machine learning models to predict students’ performance using Moodle logs that are related to study behaviors. Predicted results of the developed machine learning models were reflected back to the LMS using the Moodle block developed in this study.
[image:3.595.43.295.690.785.2]Pre-identified Predictor Attributes of the Study
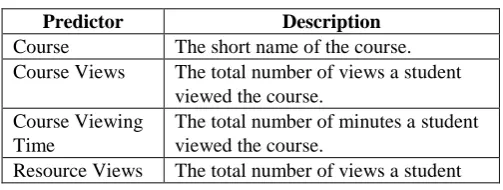
Table 1. List of Pre-identified Predictors
Predictor Description
Course The short name of the course. Course Views The total number of views a student
viewed the course. Course Viewing
Time
The total number of minutes a student viewed the course.
Resource Views The total number of views a student
viewed a specific module such as File or Folder.
Quiz Taken The total number of quizzes completed by a student in a course.
Assignment Submitted
The total number of assignments submitted by a student in a course. Discussion
Views
The total number of forums viewed by a student in a course. Announcements are also classified as forums in Moodle.
Replied in Discussions
The total number of replies made by a student in the forum of a course. Viewed in
Mobile
The total number of views a student viewed a course using mobile phones. Viewed at Night The total number of views a student
viewed a course at night time (7PM to 5AM).
Viewed at Weekends
The total number of views a student viewed a course during weekends (Friday and Saturday).
Assignment Passed
It refers to the number of assignments passed by a student;
Activities Completed
It refers to the list of required activities that need to be completed by a student in the course
Extra Credit It refers to the number of extra activities earned by a student that is not required by the course but can still be pursued by a student if he/she wishes to get extra grades.
Final Grade Final grade of a student in a course that is either P (Passed) or F (Failed).
Table 1 details the list of pre-identified predictors that are related to study behavior of students in Moodle. These attributes will be collected in Moodle logs for each course to form a dataset for training and testing. Training dataset will be used to train the developed machine learning models in predicting students’ performance while the testing dataset will be used on the actual data in the production server.
Attributes of the Dataset that Provide the Most Accurate Predictions
STUDENTS’ ACADEMIC PERFORMANCE THROUGH MOODLE LOGS
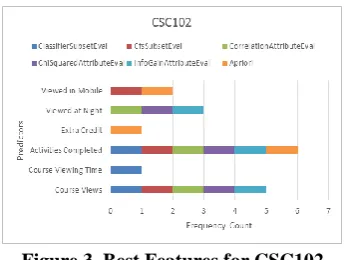
[image:4.595.379.475.223.429.2]Figure 3. Best Features for CSC102
Figure 3 illustrates the best features for CSC102 based on CFS Subset Eval were Activities Completed, Course Views, and Viewed in Mobile. It can be seen in the figure that the other feature selection techniques corroborate with the top 2 selected features.
The same strategy was performed on other courses. CSC122’s best features were Activities Completed, Course Views, and Viewed in Mobile. CSC123’s best features were Activities Completed, Assignment Passed, and Course Views while CSC125 were Activities Completed, Course Viewing Time, and Assignment Submitted. Similarly, the best features for CSC130 are Activities Completed and Assignment Passed.
The best features identified by the CFS Subset Eval in each course will be used as the predictor attributes for the models to be developed.
[image:4.595.47.291.422.508.2]Predictive Accuracy of each Courses
Table 2. Predictive Accuracy of each Course
Course Algorithm Accuracy F-Measure
CSC102 J48 89.91% 0.894
CSC122 Random Forest 90.9% 0.909
CSC123 IBK 90.47% 0.902
CSC125 JRip 96.42% 0.964
CSC130 J48 93.61% 0.936
Table 2 details the predictive accuracy of each course. It can be gleaned in the table that each course was trained with eight different algorithms, the algorithm with the highest predictive accuracy and F-Measure will be used. This means that it is a good practice to test your models with different algorithms because you will come to know what algorithms to focus on and what to discard [9]. Selecting a specific algorithm in your dataset without testing the other competent algorithms is putting bias to the study itself.
[image:4.595.131.211.658.764.2]Installing the Predictor Block
Figure 4. Installing the Predictor Block
Figure 4 illustrates how to install the Predictor (PREDIcting Students’ Performance Using MaChine TOols and AppRoaches) block. In order to use the block, the registered teacher in a course must add the block so that it appears in the course. This block will enable predicted results of the model to reflect back to the specific course in Moodle.
Student View of the Predictor Block
Figure 5 demonstrates the student view of the Predictor block in a course. It alerts each student enrolled in the course on information such as the prediction (Passed or Failed), the percentage of accuracy, and the features where the prediction was based.
Figure 5. Student View of the Predictor Block
Faculty View of the Predictor Block (Part 2)
Figure 6 highlights the faculty view of the Predictor block in a course. It alerts the faculty on the list of students who are predicted as failed in the course. This gives a faculty the change to contact affected students for whatever intervention measures.
Faculty View of the Predictor Block (Part 2)
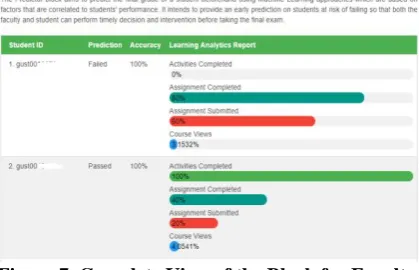
[image:5.595.65.275.261.396.2]Figure 7 shows the shows a detailed view of the prediction results as seen by a faculty. It shows a graphical view of the learning analytics report where the prediction has been based. This also allows a faculty to know which specific aspects of the course a student has been lagging so that necessary intervention can be implemented.
Figure 7. Complete View of the Block for Faculty
Evaluation Result
Table 3. Extent of Compliance of the Developed Tool in Accordance with ISO 250101 Standards
Characteristics Mean Qualitative Description Functional Suitability 4.63 Very Great Extent Performance Efficiency 4.67 Very Great Extent
Usability 4.57 Very Great Extent
Reliability 4.85 Very Great Extent
Security 4.59 Very Great Extent
Compatibility 4.50 Very Great Extent
Maintainability 4.68 Very Great Extent
Portability 4.62 Very Great Extent
Overall Mean 4.64 Very Great Extent
Table 3 shows the result of the evaluation of the developed application tool by the IT Experts with regards to ISO 25010 criterion of functional suitability, performance efficiency, usability, reliability, security, maintainability, compatibility and portability. The respondent could give a score of 1 to 5, with 1 as the lowest and 5 as the highest. The respondents gave an overall mean score of 4.64; the score indicate a very great extent.
VI. CONCLUSION
The developed predictive models for predicting students’ performance using Moodle logs and its implementation through the “Predictor” block can address in early identification of students “at risk of failing” as evident on the summary of results of the system evaluation. It is an
essential tool to provide early intervention and feedback mechanism in the field of educational data mining.
Through the “Predictor” block, faculty can receive a list of students at risk of failing directly from their courses in Moodle along with the overall learning analytics report to back up the prediction. Faculty can also use this information provided to determine the strengths and weaknesses of their students so that timely decisions can be performed.
In addition, the identification of the predictor attributes in each course can also offer an insight to the faculty on which aspects of their courses in Moodle needs to be improved. Moreover, the application tool can help to improve the retention rate in the university because of its capability to identify early those students at risk of failing.
VII. RECOMMENDATIONS
The following recommendations are offered based on the conclusions of the study:
1. The developed machine learning models and the Predictor block itself should be validated by the concerned faculty and Moodle Administrators of the university against actual transmitted final grades to further affirm its reliability.
2. The Predictor block may be presented to the management of the University for its Use.
3. The university through its different Heads of Department must review thoroughly the approved syllabus of each course and ensure the same to be strictly followed in the LMS by all their faculty so that faculty teaching the same courses are synchronized in managing their courses in Moodle. 4. The university through its different College Deans
should formulate an academic policy on how to deal with students who had been identified by the developed application tool as “at risk of failing”. This may involve early intervention measures, counseling, and policies to help identified students to improve their academic performance.
5. Datasets from the upcoming semesters should be utilized in the succeeding studies to further confirm the reliability and integrity of the model’s prediction. 6. Future researchers are encouraged to further validate
the effectiveness of the developed application tool by pursuing the same in their respective institutions. They are also encouraged to use other data mining tools and platforms for comparative analysis of the predictive analytics framework.
REFERENCES
1. Nithya, P., Umamaheswari B., & Umadevi, A. (2016). A survey on educational data mining in field of education. J Comput Sci Softw Dev 1: 1-6.
2. Mostow, J. and Beck, J. (2006). Some useful tactics to modify, map and mine data from intelligent tutors. Nat Lang Eng 12, pp 195–208.
3. Romero, C. (2017). MDM tool: A data mining framework
integrated into Moodle [Online]. Retrieved from
https://www.ucm.es/ data/cont/docs/
STUDENTS’ ACADEMIC PERFORMANCE THROUGH MOODLE LOGS
4. Zorrilla, M. E., Menasalvas, E., Marin, D., Mora, E., & Segovia, J. (2005). Web usage mining project for improving web-based learning sites. In Web mining workshop, Cataluna (pp. 1–22).
5. What is predictive analytics? (2016). Retrieved from https://www.predikto.com /advantage
6. A. Azebedo & M. Santos (2008). KDD, SEMMA and
CRISP-DM: A Parallel Overview [Online]. Retrieved from
https://www.researchgate.net/ publication/
220969845_KDD_semma_and_CRISP-DM_A_parallel_overview
7. Cross-industry standard process for data mining. (2018, October 18). Retrieved from https://en.wikipedia.org/ wiki/ Cross-industry_standard_process_for_data_mining
8. Vorhies, W. (2016). CRISP-DM – a Standard Methodology to Ensure a Good Outcome [Online]. Retrieved from https://www.datasciencecentral.com/profiles/blogs/crisp-dm-a-standard-methodology-to-ensure-a-good-outcome
9. Brownlee, J. (2015). 8 Tactics to Combat Imbalanced Classes
in Your Machine Learning Dataset [Online]. Retrieved from