This is a repository copy of Spatial impulse response measurement in an urban
environment.
White Rose Research Online URL for this paper:
http://eprints.whiterose.ac.uk/85333/
Version: Submitted Version
Conference or Workshop Item:
Murphy, Damian Thomas orcid.org/0000-0002-6676-9459 and Stevens, Francis Kit Murfin
(2014) Spatial impulse response measurement in an urban environment. In: Spatial Audio,
AES 55th International Conference, 27-29 Aug 2014.
[email protected] https://eprints.whiterose.ac.uk/ Reuse
Items deposited in White Rose Research Online are protected by copyright, with all rights reserved unless indicated otherwise. They may be downloaded and/or printed for private study, or other acts as permitted by national copyright laws. The publisher or other rights holders may allow further reproduction and re-use of the full text version. This is indicated by the licence information on the White Rose Research Online record for the item.
Takedown
If you consider content in White Rose Research Online to be in breach of UK law, please notify us by
an urban environment
Francis Stevens1, Damian Murphy1
1AudioLab, University of York, York, United Kingdom
Correspondence should be addressed to Francis Stevens ([email protected])
ABSTRACT
Acoustic impulse responses are used for multiple applications in sound design and auralisation. They are often recorded in real-world environments, and through the use of convolution can provide realistic reverberation effects. Analysis of impulse responses can provide insight into the acoustic behaviour of the recording location. Previous work on impulse response recording has focused on indoor environments. This work presents results of an acoustic survey conducted in a semi-enclosed outdoor courtyard. Impulse responses were measured using a B-format microphone to capture spatial information. Both a starter pistol and a loudspeaker reproducing swept-sine waves were used as the excitation source. The results are analysed regarding their spatial and reverberation characteristics. This work is part of a wider study investigating acoustic impulse responses from multiple outdoor locations, and aims to evaluate the performance of impulse response recording methods in an outdoor environment.
1. INTRODUCTION
Recording of acoustic impulse responses is a method by which the reverberation characteristics of a space can be captured. This capturedacoustic fingerprintcan be com-bined with another sound through convolution to make that sound appear as if it was recorded in the impulse response recording location. This method of adding ar-tificial reverberation has many creative applications, in-cluding: music production, games design, and other au-diovisual media. Integrating surround-sound recording methods into the impulse response recording process al-lows spatial information about the recording location to be captured. These can be used to place a listener artificially in the recording space through the use of auralisation techniques.
At present, the majority of available impulse responses are recordings taken in indoor environments. This work is part of a wider study investigating impulse responses measured in various outdoor locations. This in order to collect a range of recordings for use in auralisation re-search, as well as to evaluate the performance of impulse response recording techniques developed explicitly for in-door environments in an outin-door setting. In this paper we present analysis of B-format impulse responses recorded in a semi-enclosed courtyard. The recordings are
evalu-ated regarding the reverberation properties of the location, including focus on the spatial behaviour of the recorded sound. The recorded impulse responses have been made available online and are freely available to download.
Previous work investigating urban sound propagation has primarily considered sound attenuation over large dis-tances, often for the purpose of constructing noise maps [1]. Recent work conducted in York considered the acous-tic properties of a street historically used for dramaacous-tic performances, and showed that use of a sine sweep for impulse response recording is a suitably robust method for use in outdoor measurement work [2].
In this work we made use of logarithmic sine sweeps and a starter pistol in our measurements. The impulse responses were recorded in B-format in order to capture spatial infor-mation. The resultant impulse responses were evaluated using techniques outlined in [3], as well as components ofSpatial Impulse Response Rendering(SIRR) analysis in order to investigate the directional characteristics of the recorded sound.
2. IMPULSE RESPONSE MEASUREMENT
Stevens AND Murphy Spatial impulse response measurement in an urban environment
Early impulse response recording made use of a quasi-impulsive source such as a balloon pop or a gunshot [5]. Use of these sources is undesirable as they do not offer a true impulse, and their own acoustic properties will colour the recorded result. A swept-sine wave can be used to emulate the frequency response of an impulse (equal at all frequency values) by providing a constant amplitude sweep across a suitable frequency range, typically cov-ering the range of human hearing (c. 20 Hz - 20 kHz). The input sweep can be deconvolved from the recorded result to give the impulse response. Spreading the im-pulse out in the time domain allows recording at lower levels due to the increased signal-to-noise ratio, avoiding non-linearities associated with reproduction of an impulse at high levels. But this can lead to possible time-smearing in the resultant impulse response [6]. For this work we used a logarithmic sine sweeps(t), given by:
s(t) =sin
ω1.T
lnω2 ω1
.
e
t T.ln
ω2 ω1
−1
(1)
whereT is the total length of the sweep,ω1is the start
frequency, andω2is the end frequency. All of the sweeps
used had a duration of 60 seconds and covered the fre-quency range 22 Hz - 22 kHz. Note that it is often desir-able to use as long a sweep as possible to increase signal-to-noise ratio. In order for a measured impulse response to offer comprehensive analysis of the recording space, use of an omnidirectional sound source is required. How-ever, omnidirectional sources often suffer from attenuated bass response and are usually designed for band limited noise excitation [7]. Whilst an omnidirectional source is appropriate for generating impulse response recordings for analysis, it may not be suitable when recording im-pulse responses for auralisation of a directional source [2].
[image:3.612.319.538.106.290.2]A directional source can be used to approximate an omni-directional one by taking multiple recordings at the same position; rotating the sound source to a different angle for each measurement. These results can then be summed and normalised to emulate the use of a single omnidirec-tional source [8]. This allows more thorough analysis of the recording space than use of a single sweep, but also affords flexibility for auralisation of non omnidirec-tional sources. In this work we use a Genelec S30D to record four sweeps at each position, rotating the speaker 90 degrees each time, allowing comparison of recorded
Fig. 1:Frequency spectra of anechoic recordings of (a) a starter pistol shot and (b) a loudspeaker emitting a swept-sine wave.
impulse responses using both single and multiple speaker orientations.
Despite the advantages offered by swept-sine generated impulse responses, a starter pistol or balloon pop can still offer a useful alternative if the recording location has associated spatial limitations preventing the use of loudspeaker equipment [9], or if a quicker method than sine sweep recording is required. In this work we decided to compare results recorded using both methods. Before conducting field work, the starter pistol and loudspeaker were recorded in an anechoic chamber to evaluate their spectral content.
From Figure 1 the limitations of using a starter pistol become clear - there is a consistent amplitude roll-off with increasing frequency of around 20 dB per decade. This is a feature associated with the Friedlander blast-wave model [10] that is not present in the loudspeaker spectrum. There is some undesirable variation in the spectrum of the speaker, but the physical properties of any loudspeaker mean perfect reproduction of the entire spectrum is not possible.
3. SITE CHARACTERISATION
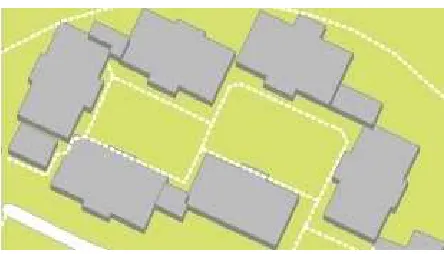
Figure 2 shows a birds-eye plan of the measurement site. The site was chosen as it fulfilled the following criteria:
Self-contained:beside the south east entrance, the court-yard perimeter is enclosed by the buildings and a 2.4m
AES 55THINTERNATIONAL CONFERENCE, Helsinki, Finland, 2014 August 27–29
Fig. 2:Birdseye view of the measurement site c2014 OpenStreetMap.
tall boundary wall. This allowed for isolation of the build-ings that we were interested in, reducing the effect of interfering reflections from other nearby structures.
Size:the inner dimensions of the courtyard are approx-imately 70m by 30m. This offers a space big enough to examine acoustic behaviour between multiple buildings, yet small enough to allow localisation of the causes of this behaviour.
Little noise:There are no noisy roads/building sites near the recording location.
Orthogonal, planar surfaces: recording in a location with near identical buildings comprised mainly of large planar surface makes reflection paths easier to identify, as well as providing acoustic coupling for non line of sight source/receiver combinations
Clear spaces: the spaces between the buildings are rel-atively empty, isolating the acoustic properties of the buildings.
Room access: we had access to a ground floor room in order to take some measurements using a sound source positioned inside a building.
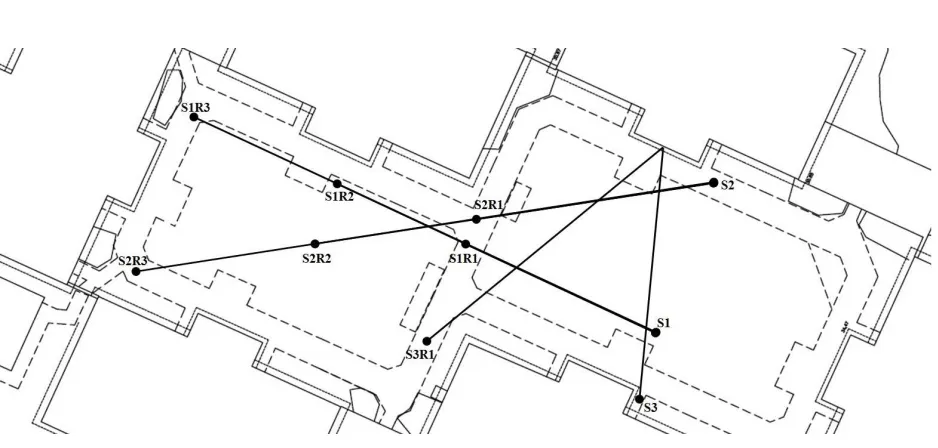
Seven receiver positions were chosen for three different source positions. Figure 3 shows their location within the courtyard. Receivers S1R1, S1R2, and S1R3 sit at different distances forming an axis from source position S1. This axis was chosen as it is roughly parallel to the faces of the buildings to the north and south of the court-yard. Receivers S2R1, S2R2, and S2R3 form an axis from source S2 in order to approximate the diagonal span of the courtyard (limited by line of sight due to minor
obstacles in the courtyard). These sets of receiver posi-tions were chosen to compare the acoustic properties of a direct sound path orthogonal to the surrounding geom-etry with those of sound path at an oblique angle. S3R1 is positioned out of the line of sight of source S3, with acoustic coupling provided by the glass frontage of the north eastern building. Position S4 was inside a ground floor room adjacent to position S3. For the sake of clarity it has not been included in Figure 3.
4. ACOUSTIC MEASUREMENT
Recordings were made at each position using the starter pistol, a single sweep and multiple speaker orientation sweeps. A Sound Field ST450 B-format microphone was used for the recording of both sources. For recording the starter pistol one Tascam DR680 was used to record the B-format signal and a close recording of the source using an Earthworks M30 microphone positioned at a distance of 1m.
For the sine sweep recordings two Tascam DR680 recorders were required for audio capture; one for play-back of the sine sweep and the other for recording the output from the B-format microphone. They were syn-chronised using an AES-3 cable from the digital through of the playback loudspeaker to the digital input of the recording Tascam unit. The sample rate was 96 kHz, with 24 bit recording resolution.
The temperature was around 21◦C for the duration of the sine sweep recordings, and around 14◦C for the starter pistol recordings. The level of wind was minimal for all of the recording work, picking up toward the end of the sine sweep recordings but only significantly deteriorating the signal-to-noise ratio on one recording (S4R1). There was an extractor fan on one of the buildings that could not be accessed that contributed some low level noise to the recordings.
5. ANALYSIS
The recorded impulse responses were analysed in terms of their reverberation parameters and spatial characteris-tics. To explore the performance of each method further, coherence measurement was performed between input source and recorded result for each impulse response.
5.1. Coherence
Stevens AND Murphy Spatial impulse response measurement in an urban environment
Fig. 3:Birds-eye view of the measurement site indicating source and receiver positions S1R1 - S3R1.
can be applied to our recordings to evaluate causality between the recorded impulse and the input source. For signals containing multiple frequency components, the co-herence can be measured at different frequencies. For two input signalsxandy, the magnitude squared coherence estimateCxyat frequency f is defined as:
Cxy(f) = | Pxy(f)|2 Pxx(f)Pyy(f)
(2)
wherePxxandPyyare the power spectral densities ofxand yrespectively, andPxyis the cross power spectral density
betweenxandy[12].
A coherence value of 1 indicates a strong relationship be-tween the two signals, where a value close to 0 represents little causality. The coherence value can be degraded ei-ther by noise or by non-linearity. For each starter pistol recording the coherence between the close and far record-ings was measured. For the sine sweep recordrecord-ings the measure was between the recorded sweep and the digi-tal input sweep. The frequency range for all coherence measurements was 22 Hz - 22 kHz, the same as the sine sweep.
Table 1 contains mean coherence values in octave bands between 63 Hz and 8 kHz for each recording method at positions S1R1 and S1R2. The results show a clear deterioration in coherence level with increasing distance
between source and receiver, which is unsurprising as in-creasing distance is effectively dein-creasing signal-to-noise ratio, allowing non-linearities (such as the noise produced by the extractor fan on site) to degrade coherence further. Impulse responses generated using a single sweep are seen to have consistently higher coherence levels than those generated using multiple speaker orientations. This is likely due to non linearities introduced by averaging errors in the normalisation of the four recordings in the multiple speaker case. Both sine sweep methods show a loss in coherence at lower frequencies, potentially due to the frequency response of the loudspeaker (shown in Figure 1 to roll-off below around 100 Hz), as well as low frequency noise interference from the extractor fan in the courtyard.
The coherence values for the starter pistol recordings dis-play similar frequency dependent characteristics, show-ing particularly low values at lower frequencies. This is symptomatic of the low signal-to-noise ratio of the starter pistol relative to the swept-sine methods. Interestingly, the starter pistol displays relatively high coherence in oc-tave bands above 500 Hz and occasionally values higher than those measured for multiple sweep orientations. This at least indicates the usefulness of a starter pistol for im-pulse response recording in certain frequency ranges, with signal-to-noise ratio issues predominately affecting low frequencies.
AES 55THINTERNATIONAL CONFERENCE, Helsinki, Finland, 2014 August 27–29
Table 1:Mean coherence in octave bands (63 Hz - 8 kHz) for each recording method at positions S1R1 and S1R2
Octave Band Position S1R1 Position S1R2
(Hz) Sine Sweep Multiple Sweeps Starter Pistol Sine Sweep Multiple Sweeps Starter Pistol
63 0.85 0.85 0.61 0.77 0.76 0.44
125 0.89 0.84 0.77 0.84 0.85 0.69
250 0.94 0.82 0.88 0.89 0.89 0.85
500 0.96 0.87 0.91 0.89 0.84 0.84
1k 0.95 0.83 0.87 0.90 0.83 0.82
2k 0.95 0.84 0.89 0.91 0.87 0.81
4k 0.96 0.89 0.92 0.93 0.89 0.86
8k 0.98 0.94 0.96 0.96 0.94 0.92
This may seem at odds with the frequency spectrum asso-ciated with the starter pistol. The high frequency roll off in Figure 1 might suggest better results at low frequencies. It is important to note that the duration of a starter pistol shot is very short (c. 390ms), allowing higher frequencies to dominate bass frequencies not sustained long enough to produce a useful signal level. Certainly when listen-ing to a firlisten-ing starter pistol there is a pronounced high frequency ‘crack’. The swept-sine conversely has a very long duration, with an emphasis on lower frequencies due to the logarithmic characteristic of the sweep. This is what allows swept-sine impulse response recording to produce useful, consistent, results at low frequencies.
5.2. Reverberation Time
[image:6.612.320.536.285.632.2]RT60 is a measure of reverberation time. It is calculated using reverse cumulative trapezoidal integration of an impulse response to estimate the decay curve, and a linear least square fit to estimate the decay curve’s slope. T30 RT60 measurement estimates the slope of the decay curve between -5 dB and -35 dB relative to the peak value, extrapolating the curve to -60 dB to obtain a measure of reverberation time. T20 measurements are made using the section of the decay curve from -5 dB to -25 dB relative to the peak value. RT60 measurements are typically taken for multiple octave bands for a given IR [3].
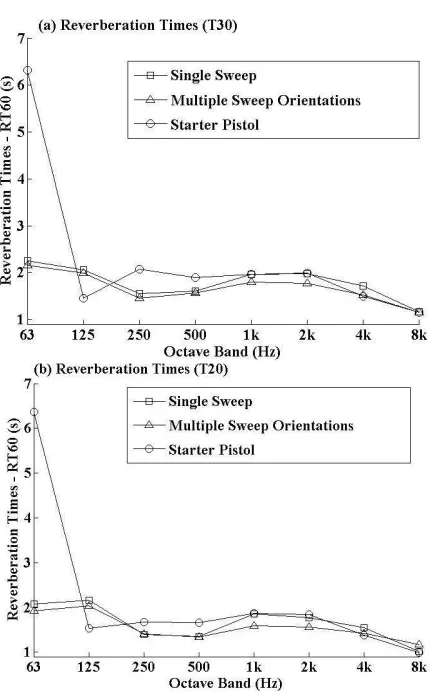
Figure 4 indicates good agreement in measured T20 and T30 reverberation time between impulse responses gen-erated using a single sine sweep, and those gengen-erated using multiple sweep orientations. They show similar frequency dependent characteristics, with a large amount of reverberant energy focused between the 1 kHz and 2 kHz octave bands and between the 63 Hz and 125 Hz
Stevens AND Murphy Spatial impulse response measurement in an urban environment
bands. This may be explained by the glass frontage of each building, around 6m in width, which is comparable to the wavelength of propagating sound around the 63 Hz octave band.
Measured reverberation time parameters for the starter pis-tol recording in the 1 kHz octave band and above exhibit similar frequency dependent characteristics to the sine sweep recordings, again showing a concentration of re-verberant energy between the 1 kHz and 2 kHz frequency bands.
In the 500 Hz octave band and below, the results indicate errors due to decreasing signal-to-noise ratio, showing extreme overestimation in the 63 Hz octave band, and low values in the 125 Hz band. The low signal-to-noise ratio at low frequencies, exacerbated by the presence of primarily low frequency noise introduced by the extrac-tor fan in the courtyard, results in skewed energy decay curves. Consequent linear regression results in erroneous values of reverberation time. These results agree with the coherence measurements in low frequency octave bands presented in table 1.
Whilst clearly erroneous, the results from the starter pis-tol recordings in the 63 Hz frequency band have been included for completeness, and to indicate the extent of the degradation in performance at low frequencies, espe-cially compared with the results in octave bands between 1 kHz and 4 kHz.
The reverberation time results again show how record-ing with a starter pistol may be appropriate. The general agreement between all methods in the 1 kHz and 2 kHz bands indicates that whilst an impulse response generated using starter pistol will not allow comprehensive analy-sis of a space, it provides a quick method for obtaining a coarse measure of reverberation time with increased accuracy at perceptually important frequencies.
5.3. Spatial Analysis
Alongside analysis of the impulse responses’ reverber-ation parameters, the directional characteristics of each impulse response can be analysed through investigation of the spatial characteristics captured by the B-format recordings.
B-format recordings are comprised of four channels - W, X, Y, and Z - representing omnidirectional pressure in-formation, and directional pressure gradient information for front/back, left/right and top/bottom [13]. The direc-tional information encoded in B-format recordings can
be taken advantage of to investigate the spatial character-istics of a recorded impulse response via calculation of instantaneous intensity vectorI. In order to do this, the B-format signal is divided into discrete time frames, each one of which is then windowed using a Hanning window, followed by performance of a short-time Fourier trans-form (STFT) on each channel of the B-trans-format recording. The resultant frequency domain signals can be used to estimate the intensity vector using the following equation:
I
(
ω
) =
√
2
Z
0R
{
W
∗(
ω
)
U
(
ω
)
}
(3)
whereU(ω) is vector[X(ω),Y(ω),Z(ω)](comprised of
the frequency domain signals for each channel),Z0is the
characteristic acoustic impedance of air, and * denotes the complex conjugate [14].
These vectors can be overlaid on a spectrogram of the recording’s omnidirectional (W-channel) response to cre-ate plots allowing concurrent analysis of the magnitude and direction of arriving acoustic energy. Calculation ofI
is one of the steps involved in Spatial impulse response rendering (SIRR), a method of reproducing spatial acous-tics over a multichannel loudspeaker system. The plots used for analysis in this work were generated usingU(ω)
formed of X(ω) and Y(ω) only (ignoring the Z axis),
resulting in a plot of the horizontal plane.
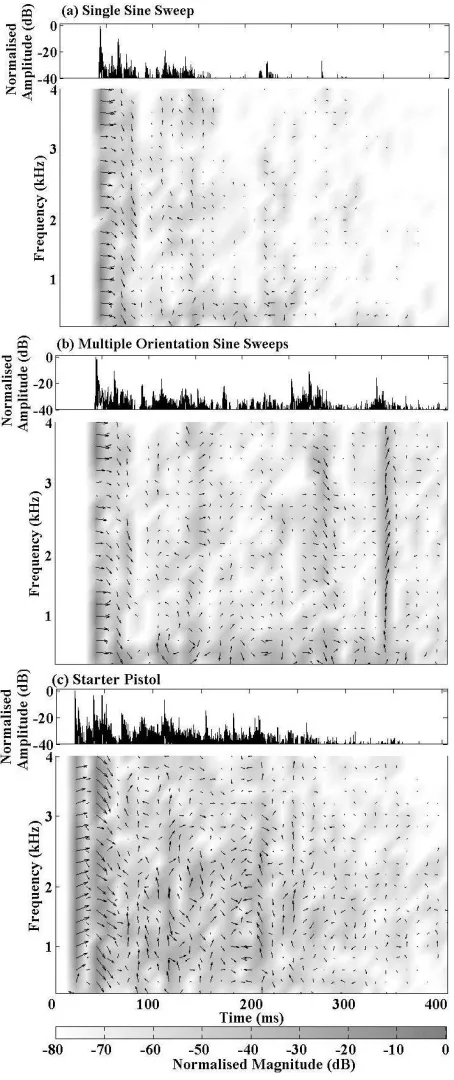
Figure 5 contains amplitude envelopes for the first 400 ms of impulse responses measured at position S1R1 given use of a single sine sweep, multiple sweep orientations and a starter pistol as the excitation source, each aligned with a SIRR analysis plot of the recording for frequencies up to 4 kHz. Each plot indicates a highly directional direct sound followed by a strong reflection at an azimuth angle of about 45◦. The surrounding location geometry indicates that this is a reflection from the frontage of the closest building to the south. Each plot then indicates several other highly directional reflection paths.
The plot created from the recording using multiple sweep orientations indicates several pronounced, relatively late (more than 200 ms following the direct sound), reflection paths that are either not present or are greatly attenuated in the other recordings. This indicates the benefit of us-ing multiple sweeps with a directional source oriented in different directions - the resultant impulse response more closely resembles the result of excitation of the space
AES 55THINTERNATIONAL CONFERENCE, Helsinki, Finland, 2014 August 27–29
Fig. 5:Amplitude envelopes and SIRR analysis plots for each recording method at position S1R1.
equally in all directions, illuminating reflections paths not indicated through the use of a single orientation sweep or a starter pistol as the excitation source.
The plot for the starter pistol recording shows less pro-nounced reflections relative to the overall response than in the other two plots, which is indicative of the relatively low signal-to-noise ratio associated with this method. The reason that the reflection paths are relatively strong in all of the recordings is most likely due to the recording location - the lack of a ceiling results in a large amount of acoustic energy dissipating out of the space fairly rapidly. Accordingly none of the measured impulse responses have pronounced reverberant tail sections.
6. CONCLUSIONS
In summary, this work describes the measurement of spa-tial impulse responses in a semi-enclosed courtyard using a starter pistol and a sine sweep as the excitation source. These impulse responses are available online at [15]. In order to analyse the recorded impulse responses and com-pare results for the different techniques, reverberation time (T30 and T20) and coherence measurements have been calculated. To investigate the spatial characteristics of the measurements, we have seen SIRR analysis plots of a recording for each excitation source. This analysis gives insight into the reverberant behaviour of sounds in an urban environment and the performance of impulse re-sponse measurement methods, traditionally used indoors, in this environment. The analysis shows us that in such an environment distinct echoes of the direct sound, in the form of early reflections, are greatly pronounced.
The analysis also indicates that the use of a starter pistol as an excitation source is a potentially useful impulse response recording method, especially in situations where use of the equipment required for sine sweep measure-ment is impractical or inappropriate. This method is limited by a lower signal-to-noise ratio than sine sweep recording, most dramatically effecting results at low fre-quencies. Sine sweep recording is shown to be a very successful method for use outdoors, with the use of a single sweep in particular displaying high coherence be-tween impulse response and the input sweep, indicating high signal-to-noise ratio.
Stevens AND Murphy Spatial impulse response measurement in an urban environment
despite resulting in a slight loss of coherence. Given ap-propriate conditions (low noise, light wind, dry weather) impulse response measurement using the swept-sine tech-nique can provide the best results when recording in an urban environment.
Future work will consider further collection and analy-sis of spatial acoustic impulse responses recorded in a variety of outdoor environments. This may include the use of longer sweeps, or the recording of more speaker orientations at a given position, in order to improve the signal-to-noise ratio of the recording method, and more closely to approximate an omnidirectional source in order to more completely characterise the acoustic properties of the recording environment. Future experimentation with non line-of-sight source/receiver combinations is also pos-sible. Collection of a greater range of impulse responses recorded outdoors will be useful for analysis of the acous-tics associated with certain environments, auralisation, and computer modelling of those environments.
7. REFERENCES
[1] Hany Hossam Eldien. Noise mapping in urban en-vironments: Application at Suez city centre. In Pro-ceedings of the international conference on comput-ers and industrial engineering, 2009.
[2] Mariana Lopez, Sandra Pauletto and Gavin Kearney. The application of impulse response measurements techniques to the study of the acoustics of Stonegate, a performance space used in medieval english drama. Acta acustica united with acustica, 99:98-109, 2013.
[3] Acoustics Measurement of the reverberation time of rooms with reference to other acoustic parameters. International Standards Organisation, ISO Std. 3382, 1997.
[4] Angelo Farina. Advancements in impulse response measurement by sine sweeps. InProceedings of the 122th AES Convention, 2007.
[5] Jonathan Abel et Al. Estimating Room Impulse Re-sponses from Recorded Balloon Pops.Proceedings of the 129th AES Convention, 2010.
[6] Angelo Farina. Simultaneous measurement of im-pulse response and distortion with a swept-sine tech-nique. InProceedings of the 108th AES Convention, 2000.
[7] Kristian Jambroˇsi´c, Marko Horvat and Marijan Bogut. Comparison of impulse sources used in re-verberation time measurements. InProceedings of the 51st international symposium ELMAR, 2009.
[8] Simon Shelley, Damian Murphy and Andrew Chad-wick. B-format acoustic impulse response measure-ment and analysis in the forest at Koli national park, Finland. InProceedings of the 16th int. conference on digital audio effects (DAFX-13), 2013.
[9] Trevor Cox. Sonic wonderland: A scientific odyssey of sound. Bodley Head, 2014.
[10] Steven Beck. Variations in recorded acoustic gunshot waveforms generated by small firearms. Journal of the acoustical society of America, 129(4):1748-1759, 2011.
[11] Steven Kay.Modern spectral estimation. Prentice Hall, 1988.
[12] Peter Welch. The use of fast Fourier transform for the estimation of power spectra: A method based on time averaging over short, modified periodograms. IEEE transactions on audio and electroacoustics, 15(2):70-73, 1967.
[13] Eric Benjamin and Thomas Chen. The native b-format microphone: Part 1. InProceeding of the 119th AES Convention, 2005.
[14] Juha Merimaa and Ville Pulkki. Spatial impulse re-sponse rendering I: Analysis and synthesis.Journal of the audio engineering Society, 54(12):1115-1127, 2005.
[15] Francis Stevens and Damian Murphy. B-format im-pulse responses files from Alcuin courtyard, Uni-versity of York. [Online] Available: http://www. openairlib.net, 2014.
AES 55THINTERNATIONAL CONFERENCE, Helsinki, Finland, 2014 August 27–29