promoting access to White Rose research papers
White Rose Research Online [email protected]
Universities of Leeds, Sheffield and York
http://eprints.whiterose.ac.uk/
This is the author’s pre-peer review version of an article published inMedical Education
White Rose Research Online URL for this paper: http://eprints.whiterose.ac.uk/id/eprint/75610
Published article:
Pell, G, Fuller, R, Homer, M and Roberts, T (2013) Advancing the OSCE: Sequential testing in theory and practice. Medical Education, 47 (6). 569 - 577 . ISSN 0308-0110
Advancing the OSCE: Sequential testing in theory and practice
Address
Godfrey Pell1, Richard Fuller, Matthew Homer, Trudie Roberts
Leeds Institute of Medical Education
School of Medicine,
University of Leeds
Leeds LS2 9JT
Contributions
Godfrey Pell and Richard Fuller conceived of the study. Godfrey Pell and Matt Homer carried out the
statistical analysis. All four authors helped in the planning and writing of the paper. All authors gave
final approval for the article to be published.
Funding
No external funding was received.
Acknowledgments
None.
Ethics
Ethical approval for this study was not required – no participants were involved, and all assessment
data were anonymised in advance of the analysis.
Conflicts of interest
Word Count
Abstract
Introduction
Models of short term remediation for failing students are typically associated with improvement in
candidate performance at retest, yet are costly to deliver (particularly for performance retest with
Objective Structured Clinical Examinations (OSCEs)). There is increasing evidence that these
traditional models are associated with longitudinal underperformance of candidates.
Methods
Rather than a traditional OSCE model, sequential testing involves a shorter ‘screening’ test format,
with an additional ‘sequential’ test for candidates who fail to meet the standards of the screening
test. For those tested twice, overall pass/fail decisions are then made on the full sequence of tests.
The impact of sequential assessment on student performance cost of assessment delivery and
overall reliability was modelled using prior data from the final, graduating OSCE of an undergraduate
medical degree programme.
Results
The initial modelling predicted significant improvements to reliability in the critical area, reflected in
pilot results (with 14% of students, n=228, required to sit the sequential OSCE). One student (0.4%)
was identified as a false positive, i.e. under the old system would have passed the OSCE, but failed
on extended testing. Nine students (4%) who would have required OSCE retests under the prior
system passed the full sequence and were therefore able to graduate at the normal time without
loss of earnings. Overall reliability was estimated as 0.79 for the full test sequence, with significant
cost saving realised.
Discussion
Introducing sequential testing for OSCEs increases reliability for borderline students since the
increased number of observations implies that ‘observed’ student marks are closer to the ‘true’
benefits in terms of reliability to be achieved. Introduction of such a system has financial benefits,
Introduction
In the measurement of any population group or cohort, repeat testing of an extreme sub-group
within that group shows the second measure moving, on average, closer to the population mean
(providing some random error is present). This phenomenon is called regression to the mean1–3.
What is the relevance of this for high stakes performance assessments? Regression to the mean
suggests that some failing candidates would have passed on a different day (perhaps reflecting the
difference in the sampling of the domains between the tests), and that some candidates who have
just passed would, if retested, fail. Whilst the former group have the opportunity of resitting the
examination, the latter group escape this consequence since they are deemed to have passed first
time around. Whilst this problem is partly overcome by the addition of standard error of
measurement (SEM) to aggregate scores4,5, it has the effect of increasing the number of false
negatives (i.e. the just competent candidate who should have passed, but performed poorly on the
day for some reason). The approach taken to dealing with these issues clearly has important
consequences for candidates and institutions, particularly in terms of high stakes graduating and
licensing examinations.
Are current models of assessment, standard setting process and retesting of underperforming
candidates sufficiently robust and fair to all stakeholders (e.g. candidates, educational institutions,
employers, regulators and patients)6,7? If not, is there a better model that could be employed?
Recent work has undertaken a longitudinal analysis of those students who obtained a borderline or
fail grade in their OSCE assessments within a programme of assessment in an undergraduate
medical degree8. This found that the majority of such students performed relatively worse than
their peers at Year 5 compared to Year 3, in spite of directed remediation and the departure from
the course of the very worst performing students, suggesting that current models ofassessment,
students. These findings pose questions with regard to both the detection of these underperforming
students and the meaningful remediation and support that is successful longitudinally9. A potential
solution would be to consider introducing a sequential testing arrangement where those candidates
categorised as ‘failing’ or ‘borderline’ in a traditional ‘single OSCE’ students are brought back for an
additional examination, with final pass/fail decisions made based on the performance across the two
tests (‘the full sequence’).This would be coupled with more customised remediation and follow-up
for students failing the full sequence.
This paper outlines the theoretical case for sequential testing, exploring the impact from both
candidate and institutional perspectives, including estimates of cost savings and improvements to
reliability for borderline students. The paper models the outcomes of implementing a fully
sequential test approach to the OSCE by using past institutional data, and describes the practical
application of the methodology in a recent (2011) high stakes examination, and begins with a review
of previous published work in this area.
Implementing sequential testing in OSCEs – lessons from the literature
The literature includes a range of interesting work advancing the concept of the sequential OSCE.
Muijtjens and colleagues10used real OSCE data to simulate results of a (theoretical) sequential test
in order to investigate how long the ‘screening’ test (i.e. the first part of the sequence) should be as
a proportion of the full test. It considered the trade off between efficiency saving in terms of
reduced testing for the majority of students against the risk of increased false positives. In reducing
the first screening test by 30-40%, a tentative rate for false positives is estimated in this paper at
0.2%. Whilst this work postulated a novel method of determining the optimum cut score for the
screening test, others have reinforced the value of receiver operating characteristics as a
The Medical Council of Canada trialled a sequential test format to the OSCE component of its
licensure examination12, revealing that sequenced format was cost effective with acceptable
psychometric properties. However, problems were experienced due to the multi-site nature of the
test and poor perceptions reported by candidates and faculty. A further paper13considers the
positive impact on overall test reliability and financial savings made from the implementation of
sequential testing approach by combining the test results from final year OSCE and Objective
Structured Long Examination Records (OSLER) examinations. However, this paper provides little
theoretical justification for the sequential model, and does not address issues relating to
dependency in the data resulting from combining these two different assessment types. There is
also no consideration of station level issues of quality, particularly in the measurement of error
variance that can be critical in ensuring that decisions made in any smaller ‘screening’ test are robust
14
What conclusions can we draw from this work in advancing the argument for introducing sequential
testing in OSCEs? It is clear that any such model must present arguments of overall rigour, cost
effectiveness and benefits to candidates (fairness) and institutions (reliability and credibility of
decision making) whilst also ensuring only competent students progress. A clear benefit of such a
model allows the possibility of almost eliminating false positives, whilst giving false negatives the
opportunity of improving their performance as a result of wider sampling through the
sequential/additional assessment within the same overall testing period. Adopting the results from
the Muijtjens study, a 30-40% reduction in the first or ‘screening’ element of the sequential model
has positive benefits for candidates and institutions in terms of cost and potential acceptability, with
an estimated 10-20% of candidates needing an additional test. Adding a similar sized additional test
for this candidate group generates an overall test that includes more stations, and hence has higher
For graduation level examinations in the UK setting, a single point of entry into the first stage of
postgraduate training has meant a traditional model of test-remediate-retest has required either
disruption to academic programmes, or continuing a process that sees successful retest candidates
unable to start employment in time. Sequential test approaches have clear benefits for such
candidates, ensuring all competent candidates are available for employment at the appropriate
time.
At the institutional level, the sequential test format for high stakes assessments presents a powerful
consequential validity through detecting the small number of students who fail the overall sequence
and the design of a programme of remediation that leads to sustained success. Instead of a “one
size fits all” brief remediation period held during the summer, this would be replaced by tailored
support delivered over a full academic year, utilising aspects of self-regulated learning theory in
respect of motivation, engagement & tasking15,16. There are clearly structural benefits to institutions
in terms of curriculum delivery, and the opportunity to redress the concerns expressed about
traditional models of assessment, remediation and retest within a short time frame. Whilst the
impact of longer remediation programmes is not well researched, work in upper secondary school
level education reveals that students can benefit from the extra year’s consolidation17. In addition,
longitudinal profiling provides a vehicle to monitor the performance of the remedial student group
over time8.
Methods
The OSCE test model prior to sequential testing
The final year, graduating OSCE model involved all students undertaking a single OSCE of 18-20
individual stations, with an active testing time of approximately 3 hours. Stations are typically longer
in duration and integrate higher level processes (e.g. decision making, prescribing) to determine
mastery appropriate to the expected level of new doctors. Our typical test cohort will be 260
students, and the assessment is delivered over a two day period, via four separate test centres. This
requires up to 500 trained OSCE assessors, the vast majority of whom give up their clinical practice
for a portion of the two day period to examine. The Borderline Regression method is used for
standard setting18.
Students had to fulfil two requirements in order to pass the OSCE:
1. They had to obtain a passing mark set at the aggregate of the individual station pass marks
plus 1 standard error of measurement4,5.
2. They also had to obtain a passing profile of at least 60% of stations to prevent excessive
compensation across stations. Whilst an argument can be made that this should be
unnecessary in an assessment measuring a single construct (clinical competence), the
importance and impact of the context and domain specific nature of clinical performance is
well established19,20.
The sequential test model
For the first, or ‘screening’ part of the sequential test, it was decided to base the passing score on
the aggregate score of the OSCE stations plus 2 SEM. This was considered appropriate, as it was
hypothesised (based on modelling with previous data) that it would eliminate almost all false
positives, and would also eliminate almost entirely those candidates who failed the first part of the
It is worthy of note that the standard setting details of sequential testing models, with discussion of
any adjustment using the standard error of measurement together with pass profiling, have received
little combined attention in the literature.
Reliability
The impact of introducing a sequential assessment is modelled in this paper using the data from an
earlier assessment, with the 2011 implementation year’s data employed to confirm consistency of
the results. The reliability analysis consists of the internal consistency measure, Cronbach’s alpha,
with values for the full sequence extrapolated from the first sequence (that all students sit) using the
Spearman Brown ‘prophecy’ formula4. For the simple model of students crossed with stations, this
is equivalent to a D-study in generalisability theory20.
Estimates of cost and other savings
The costing analysis is based on a number of
assumptions:-1) If the number of stations is reduced, the different types of station maintain roughly the
same proportions in terms of resources used (e.g. those with simulated patients). Under this
assumption marginal costs such as the reduction in the numbers of simulators, and the
reduction in the clinical resources can be predicted with reasonable accuracy.
2) A reduction in the number of stations also reduces the number of support staff needed to
marshal and invigilate. These tend to participate as a normal part of their job, with the
institutional cost being the opportunity cost of other tasks displaced by attendance at the
OSCE. We use the daily rate for an intermediate administrator for these calculations, and
3) A reduction in the number of stations will reduce the number of assessors. This proves more
difficult to accurately cost because of complicated funding arrangements, but has a clear
impact on the delivery of clinical service as a result of assessor time. For the purposes of the
model, a figure based on the reduction of assessors required has been included.
Implementation
Mindful of some of the problems reported in delivering a sequential test OSCE format across
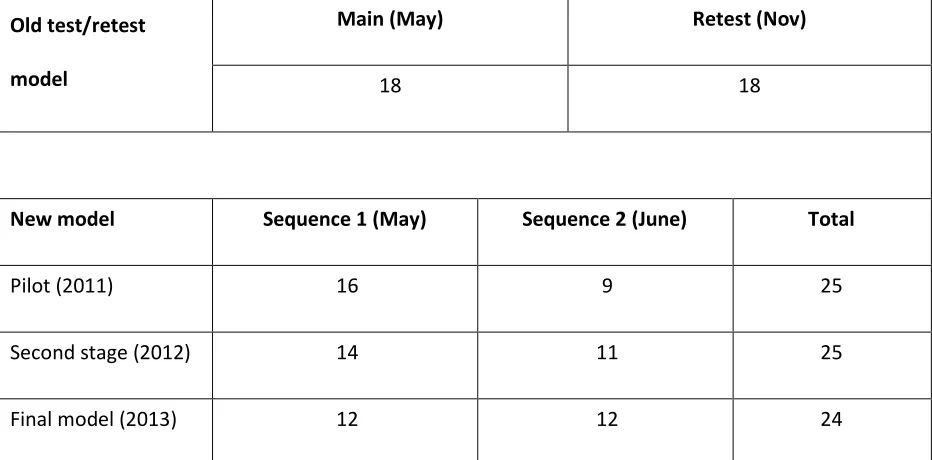
multiple sites12, it was decided to introduce the sequential model in a step-wise manner by reducing
the length of the first part of the sequence (S1) by two stations each year (from a start point of 18
stations), and increasing the second part (S2) two by a similar amount (starting from 9 stations) until
the final model of a 12 + 12 format has been reached (see Table 1). This final model is intended to
maximise cost-savings whilst maintaining an adequate value of reliability (alpha) for the first part of
the sequence. To mitigate potential problems arising from poor individual station-level metrics, an
Old test/retest
model
Main (May) Retest (Nov)
18 18
New model Sequence 1 (May) Sequence 2 (June) Total
Pilot (2011) 16 9 25
Second stage (2012) 14 11 25
[image:13.595.67.533.73.303.2]Final model (2013) 12 12 24
Table 1: Evolution from the traditional test/retest model to the final sequential model
Results – Modelling and Implementation (2011 OSCE)
Sequential test delivery and patterns of student performance
Based on previous years’ data, the pass mark for S1 was estimated to be the aggregate station pass
mark plus 2 SEMs (i.e. approximately 4% above the aggregate station passing score). From this, the
number of students expected to take S2 was estimated in advance to be somewhere between 8 and
16% of each year group - based on a typical Cronbach’s α of 0.75 for an 18 station OSCE, an
acceptable level of reliability for an OSCE that has satisfactory station level metrics, and is delivered
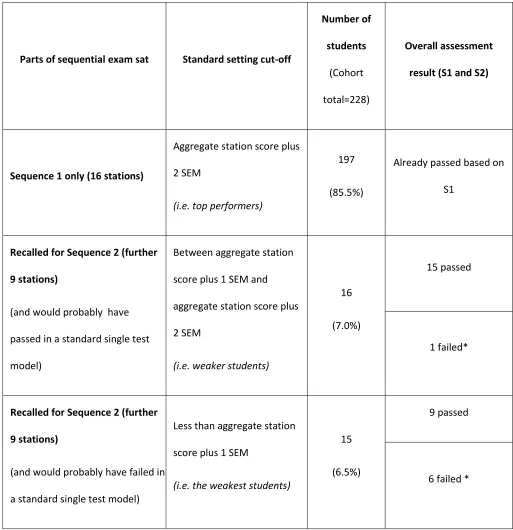
across multiple sites using real patients14. Table 2 shows the results of the actual exam in 2011,
demonstrating that these estimates were broadly correct, with 13.5% of students brought back for
S2.
This table also shows that under the previous model approximately 15 (6.5% of the year group)
students would have undertaken a retest OSCE but, that with a sequential model, nine of these
pass S1. These students therefore passed the sequential assessment, were competent and available
to enter postgraduate employment and training. Under the previous remediate-retest system, they
would have lost up to a year’s salary, with an impact on employers who would have been left with a
much shorter window to appoint staff to fill gaps resulting from examination failure.
Importantly, when we implemented the sequential model, one student (0.4%) was identified as a
false positive under the old system (i.e. would have passed the main OSCE, but in fact failed the full
Parts of sequential exam sat Standard setting cut-off Number of students (Cohort total=228) Overall assessment
result (S1 and S2)
Sequence 1 only (16 stations)
Aggregate station score plus
2 SEM
(i.e. top performers)
197
(85.5%)
Already passed based on
S1
Recalled for Sequence 2 (further
9 stations)
(and would probably have
passed in a standard single test
model)
Between aggregate station
score plus 1 SEM and
aggregate station score plus
2 SEM
(i.e. weaker students)
16
(7.0%)
15 passed
1 failed*
Recalled for Sequence 2 (further
9 stations)
(and would probably have failed in
a standard single test model)
Less than aggregate station
score plus 1 SEM
(i.e. the weakest students)
15
(6.5%)
9 passed
6 failed *
[image:15.595.62.575.70.600.2]*Includes 2 students who failed to achieve the required pass profile of 60% of all stations (i.e. 15 out of 25)
Reliability
For the pre-existing, ‘single OSCE’ model, reliability estimates were based on non- normalised data
(i.e. using raw station total scores), usually giving a Cronbach’s alpha in the region of 0.75 which is
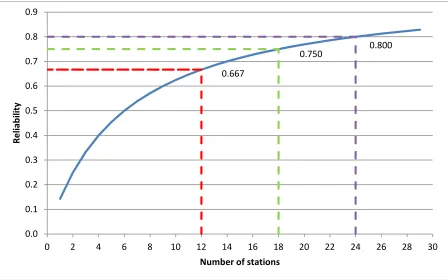
generally regarded as adequate for this type of assessment. Based on this typical alpha value, and
using the Spearman-Brown prophecy formula to adjust for different numbers of stations, Figure 1
indicates that a fully implemented model of 12 stations (i.e. the number of stations in S1 in the final
model) gives an estimated alpha of 0.67, and 24 stations (the full sequence in the final model) an
alpha of 0.80.
The number of stations in the final model has a natural symmetry model, comprising six less stations
for S1, and six stations more for the full sequence (S1 plus S2). This final arrangement also ensures
the equality in size and scope between the two sequential parts. Conceptually, it is not a
requirement that both parts of the sequence are of equal size, however a symmetrical model has
automatic appeal to students (i.e. face validity), who generally indicate that it gives them a fair
opportunity to redeem themselves in S2 following a poor performance in S1 (evidenced via multiple
Fig 1: Estimate of reliability (alpha) for the full sequence by number of stations
Table 3 shows the predicated and actual reliability estimates for the first step towards a fully
implemented sequential testing model (S1 consists of 16 stations, and S2 of 9, in this first step).
Number of stations Estimated (Model) Actual (2011)
S1 16 0.739 0.709
[image:17.595.68.300.475.614.2]S1 + S2 25 0.806 0.792
Table 3: Comparison of actual reliability with estimates for first step towards implementation
(2011) 0.667 0.800 0.750 0.0 0.1 0.2 0.3 0.4 0.5 0.6 0.7 0.8 0.9
0 2 4 6 8 10 12 14 16 18 20 22 24 26 28 30
Re
lia
bi
lit
y
Estimates of cost and other savings
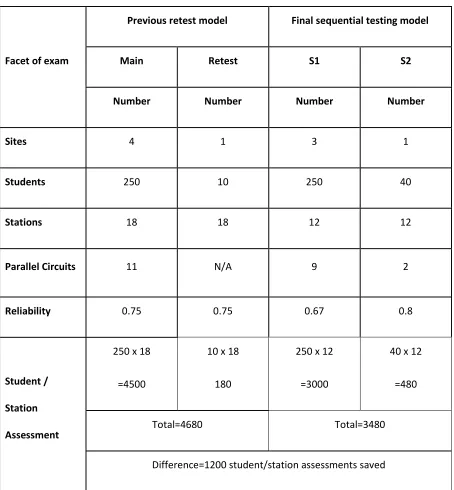
Using the assumptions described in the earlier modelling, we undertook a comparison of the two
models (traditional retest vs. final sequential testing – to be implemented in 2013) in terms of
number of sites, students, stations and parallel circuits. As detailed in Table 4, reducing the main
assessment to 12 stations will reduce not only the number of student/assessor interactions, but also
the number of sites from four to three (we have assumed 10 students required to undertake the
traditional retest model; for the sequential model, we have estimated 40 candidates requiring S2.
Facet of exam
Previous retest model Final sequential testing model
Main Retest S1 S2
Number Number Number Number
Sites 4 1 3 1
Students 250 10 250 40
Stations 18 18 12 12
Parallel Circuits 11 N/A 9 2
Reliability 0.75 0.75 0.67 0.8
Student /
Station
Assessment
250 x 18
=4500
10 x 18
180
250 x 12
=3000
40 x 12
=480
Total=4680 Total=3480
[image:19.595.67.521.66.556.2]Difference=1200 student/station assessments saved
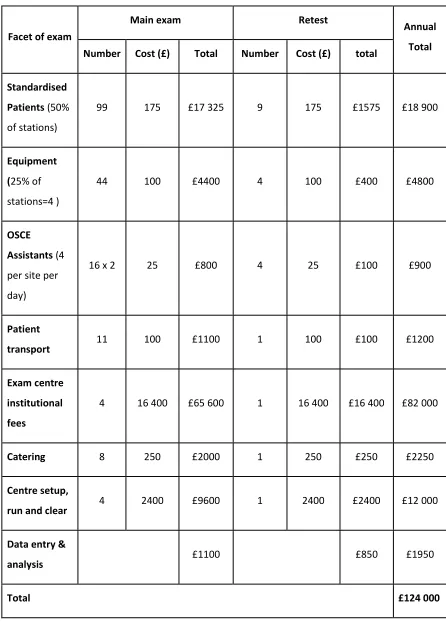
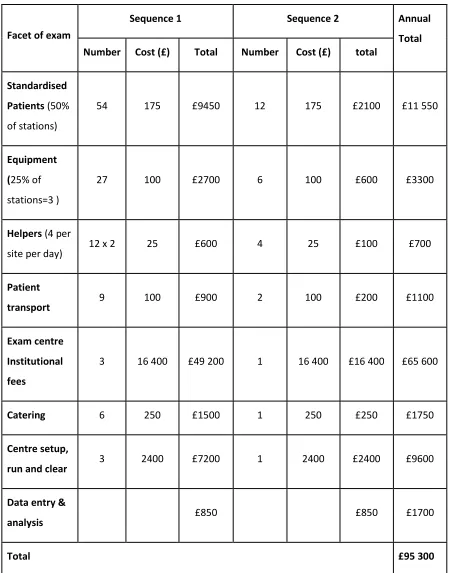
Estimates of cost-savings indicate this to be approximately £29 000 (US $45 000,€37 000) within just
this one of year of assessment (traditional model = £124 000; sequential model £95 300), with
detailed modelling in the appendix. Interestingly, this is of a very similar magnitude to that quoted
by Cookson et al.13, where a figure of £30, 000 is given. Given the difficulty in accurately costing
assessor time (and consequent impacts on clinical service delivery), it is highly likely that cost savings
may be significantly higher than we have estimated, a point noted previously by other
commentators21.
Discussion
Delivery of high stakes testing that ensures rigour, fairness and reliability is essential, particularly in
the identification and decision making in respect of candidates at the critical pass/fail area. This
paper describes the adoption of sequential test methodology in order to reconcile a number of these
issues. Modelling with a sound theoretical approach (using regression towards the mean) allows a
determination of the impact of altered test format across a range of domains, which were then
realised in a careful programme of implementation.
Sequential testing brings a number of benefits. For the institution, avoiding a significant structural
change (e.g. altering assessment timetables to facilitate retests within an academic year) is of value,
allowing the whole sequence of testing to be undertaken within a single planning activity,
accompanied by cost savings described. Higher reliability in the critical area generates improved
quality and rigour in respect of the high stakes decisions made. In this study, the adoption of
sequential testing revealed one false positive result – namely a student who would have been
determined as ‘just’ competent within a traditional single OSCE, failed as a result of more extensive
performance on the screening test (S1) has truly been affected because of anxiety or a poor start to
the OSCE. Anecdotally, in our centre, student satisfaction and opinion with this model has been
much higher than the previous test-retest approach, and is being extended in 2012/2013 to high
stakes testing in Year 4 of the undergraduate programme.
However, the introduction of sequential testing is not without risk – requiring advance planning and
organisational change, and communication with students, staff and institutions. Dedicated
psychometric expertise is vital, in the modelling, planning and analysis of the sequential format and
to evidence high quality whole exam and station level metrics. Having a strong theoretical approach
to underpin this, and associated modelling of impact were vital in making changes to our high stakes
testing. Being able to generate decisions about the S1 ‘screening’ test in a quicker time to inform
students of the requirement to take S2 requires significant expertise, particularly in terms of
continuing to ensure good station level metrics14. For students undertaking S2, our first year of
experience showed these students needed a deal of support – both in reaffirming they had not
‘failed’ and had a further opportunity to demonstrate their ability, and in counselling in terms of
effective, ongoing study skills and clinical practice.
When undertaking the modelling process, it is important to maintain the philosophical integrity of
the process in terms of ‘what can be measured’. Because the S2 candidates are by definition an
extreme sub-group, the reliability of the full sequence cannot be measured directly, and has to be
inferred from S1 (taken by the full cohort) using Decision theory. Within the initial model, we
deliberately adopted a wide range for the number of S2 candidates (20-40), based on modelling each
of the final year assessment over the previous 3 years. When comparing the actual results with the
modelled results, the alpha was 0.792, close to the 0.806 value predicted for the 25 station model
(Table 3). The number of candidates recalled for S2 was 31, which is in the centre of our predicted
historically unexceptional. Whilst this is a single centre study and with early results, it has generated
similar outputs to published theoretical work10, whilst overcoming some of the difficulties
encountered in running our high stakes OSCE across multiple sites12. We have concluded, therefore
that the basis for our modelling was sound, and that it is reasonable to proceed towards the
implementation of the full model.
Can such arguments for the introduction of sequential testing be applied to traditional written test
formats? Whilst it is clear that the introduction of sequential testing for performance based tests
increases reliability for borderline students since under such a system, marks are closer to the ‘true’
student score, this could easily be achieved by increasing the size of the written test for the whole
cohort by adding more items (e.g. in a single best answer test format) from an already established
question bank. However, in the use of written tests that are more challenging to construct and mark
(e.g. short answer test formats) there may benefit from a sequential approach, with identifiable cost
savings in faculty time. Irrespective of test format, the station (or item) level quality of the
assessment needs to be sufficiently high for the full benefits in terms of reliability to be achieved,
especially in the screening test. In the adoption of sequential testing formats, the test analysis
should be sufficiently detailed to monitor the effects both desirable and unintended of the new
References
1. Galton F. Regression Towards Mediocrity in Hereditary Stature.The Journal of the
Anthropological Institute of Great Britain and Ireland. 1886 Jan 1;15:246–63.
2. Bland JM, Altman DG. Statistics Notes: Some examples of regression towards the mean.BMJ.
1994;309(6957):780.
3. Senn S. Francis Galton and regression to the mean.Significance. 2011 Sep 1;8(3):124–6.
4. Streiner D, Norman G.Health Measurement Scales: A practical guide to their development and
use. 3rd ed. OUP Oxford; 2003.
5. Hays R, Gupta TS, Veitch J. The practical value of the standard error of measurement in
borderline pass/fail decisions.Med Educ. 2008 Aug;42(8):810–5.
6. Pell G, Boursicot K, Roberts T. The trouble with resits ….Assessment & Evaluation in Higher
Education. 2009 Apr;34:243–51.
7. Ricketts C. A new look at resits: are they simply a second chance?Assessment & Evaluation in
Higher Education. 2010;35(4):351.
8. Pell G, Fuller R, Homer M, Roberts T. Is short-term remediation after OSCE failure sustained? A
retrospective analysis of the longitudinal attainment of underperforming students in OSCE
assessments.Med Teach. 2012;34(2):146–50.
9. Hays RB. Remediation and re-assessment in undergraduate medical school examinations.
Medical Teacher. 2012 Feb;34(2):91–2.
10. Muijtjens AM, van Vollenhoven FH, van Luijk SJ, van der Vleuten CP. Sequential testing in the
11. Regehr G, Colliver J. On the equivalence of classic ROC analysis and the loss-function model to
set cut points in sequential testing.Acad Med. 2003 Apr;78(4):361–4.
12. Smee SM, Dauphinee WD, Blackmore DE, Rothman AI, Reznick RK, Des Marchais J. A
sequenced OSCE for licensure: administrative issues, results and myths.Adv Health Sci Educ
Theory Pract. 2003;8(3):223–36.
13. Cookson J, Crossley J, Fagan G, McKendree J, Mohsen A. A final clinical examination using a
sequential design to improve cost-effectiveness.Medical Education. 2011 Jul;45:741–7.
14. Pell G, Fuller R, Homer M, Roberts T. How to measure the quality of the OSCE: A review of
metrics - AMEE guide no. 49.Med Teach. 2010;32(10):802–11.
15. Sandars J. The use of reflection in medical education: AMEE Guide No. 44.Med Teach. 2009
Aug;31(8):685–95.
16. Stegers-Jager KM, Cohen-Schotanus J, Themmen APN. Motivation, learning strategies,
participation and medical school performance.Med Educ. 2012 Jul;46(7):678–88.
17. Fertig M. Shot Across the Bow, Stigma or Selection? The Effect of Repeating a Class on
Educational Attainment. SSRN eLibrary [Internet]. 2004 Aug [cited 2011 Oct 5]; Available from:
http://papers.ssrn.com/sol3/papers.cfm?abstract_id=575381
18. Pell G, Roberts TE. Setting Standards for Student Assessment.International Journal of Research
& Method in Education. 2006 Apr;29(1):91–103.
19. Eva KW, Neville AJ, Norman GR. Exploring the etiology of content specificity: factors influencing
analogic transfer and problem solving.Acad Med. 1998 Oct;73(10 Suppl):S1–5.
20. Schuwirth LWT, van der Vleuten CPM. General overview of the theories used in assessment:
21. Walsh K. Sequential testing: costs and cost savings may be greater.Medical Education.
Appendix – Detailed cost savings:
Facet of exam
Main exam Retest Annual
Total
Number Cost (£) Total Number Cost (£) total
Standardised Patients(50% of stations)
99 175 £17 325 9 175 £1575 £18 900
Equipment (25% of stations=4 )
44 100 £4400 4 100 £400 £4800
OSCE Assistants(4 per site per day)
16 x 2 25 £800 4 25 £100 £900
Patient
transport 11 100 £1100 1 100 £100 £1200
Exam centre institutional fees
4 16 400 £65 600 1 16 400 £16 400 £82 000
Catering 8 250 £2000 1 250 £250 £2250
Centre setup,
run and clear 4 2400 £9600 1 2400 £2400 £12 000
Data entry &
analysis £1100 £850 £1950
[image:26.595.65.511.103.725.2]Total £124 000
Facet of exam
Sequence 1 Sequence 2 Annual
Total
Number Cost (£) Total Number Cost (£) total
Standardised Patients(50% of stations)
54 175 £9450 12 175 £2100 £11 550
Equipment (25% of stations=3 )
27 100 £2700 6 100 £600 £3300
Helpers(4 per
site per day) 12 x 2 25 £600 4 25 £100 £700
Patient
transport 9 100 £900 2 100 £200 £1100
Exam centre Institutional fees
3 16 400 £49 200 1 16 400 £16 400 £65 600
Catering 6 250 £1500 1 250 £250 £1750
Centre setup,
run and clear 3 2400 £7200 1 2400 £2400 £9600
Data entry &
analysis £850 £850 £1700
[image:27.595.65.515.68.641.2]Total £95 300