Toward a simple real-time control system for efficient management of furrow irrigation
1 2 3 4 5 6 7 8 9 10 11 12 13 14 15 16 17 18 19 20 21 22 23 24 25 26 27 28 29 30 31 32 33 34
Kanya L. Khatri & R. J. Smith
Cooperative Research Centre for Irrigation Futures, and National Centre for Engineering Agriculture, University of Southern Queensland, Toowoomba, Queensland, 4350, Australia
Corresponding author
Kanya Lal Khatri
Cooperative Research Centre for Irrigation Futures Faculty of Engineering and Surveying
University of Southern Queensland Toowoomba, QLD, 4350
Australia
Ph: +61 7 4631 1713 Fax: +61 7 4631 2526
Email: [email protected], [email protected]
Abstract
1 2 3 4 5 6 7 8 9 10 11 12 13 14 15 16 17 18 19 20 21 22 23 24 25 26 27 28 29 30 31 32 33
reductions in the total volume of water applied to the two fields of 20% and 60% respectively, indicating the scale of benefits that can be achieved in the irrigation sector by implementing simple real-time control.
Keywords: surface irrigation, automation, irrigation advance, irrigation efficiency, simulation
1. Introduction
Amongst surface irrigation methods, furrow irrigation is the most commonly used method for irrigating crops and pastures in northern Australia and around the world but this method has been often considered inefficient with highly variable and poor application efficiencies. In fact it is not the fault of method but indeed it is the lack of proper management and a limited capability to predict the soil infiltration characteristic.
The performance of surface irrigation is a function of the field design, infiltration characteristic of the soil, and the irrigation management practice. However, the complexity of the interactions makes it difficult for irrigators to identify optimal design or management practices. The infiltration characteristic of the soil is the most crucial factor affecting the performance of surface irrigation (Khatri and Smith, 2005a) and both spatial and temporal variations in the infiltration characteristic are a major physical constraint to achieving higher irrigation application efficiencies (Shafique and Skogerboe, 1983). The spatial and temporal variation commonly found in infiltration characteristics (Raine et al., 1997) also raises concerns regarding the adequacy of generalised design and management guidelines for surface irrigation.
1 2 3 4 5 6 7 8 9 10 11 12 13 14 15 16 17 18 19 20 21 22 23 24 25 26 27 28 29 30 31 32 33
management parameters were optimized for each irrigation throughout the season to simulate perfect real- time control of individual irrigations, the average application efficiency increased significantly to 93% with a storage efficiency of 90%, without any significant difference in the distribution uniformity.
The term real time control applied to the analysis of field parameters in surface irrigation means that irrigation information is collected, studied and processed during the irrigation. The results obtained are used to modify the management variables for the same irrigation. The necessary information can be obtained from advance data or field run-off. Smith and Duke (1984) modified the two-point method proposed by Elliott and Walker (1982) to determine infiltration characteristics in real time from advance data. They developed a remote sensing system to automatically measure the advance time and they looked for the optimum placement for sensors using the kinematic wave model. The best location for a two sensor system was between 40 and 60% of field length.
Walker and Busman (1990) developed a computer model for simulation and optimization of surface irrigation in real-time, combining a kinematic wave model and a Simplex optimization technique that minimizes the sum of squares of differences between the measured and simulated advance by fitting the three parameters of the modified Kostiakov equation. Azevedo et al., (1992) developed another computer model called SIRTOM (surface irrigation real time optimization model) to estimate the infiltration parameters in real time from advance data. They used a one-dimensional optimization technique called the Brent method to obtain the parameters k and fo of the Kostiakov-Lewis equation. The parameter a was determined by the two-point method.
The major drawback of the above models is that they are data intensive and difficult to operate. The IPE model also requires the final infiltration parameter (f
1 2 3 4 5 6 7 8 9 10
11 12 13 14 15 16 17
18
19 20 21 22 23 24
25
26 27 28 29 30 31 32
o) to be measured separately which is time consuming and difficult to measure accurately. The quest to extract the maximum information on soil infiltration from a minimum possible quantity of field advance data is of enormous importance, particularly for the automation of surface irrigation using real time control (Oyonarte et al., 2002). The greatest limitation of the most of the existing infiltration methods is that they are data intensive and none of them is entirely suitable for use in real time control (Khatri and Smith, 2005b). The high data requirement is a major hindrance to the implementation of any form of real-time control.
To over-come this problem a new approach to prediction of infiltration in real-time (REIP) that uses a model infiltration curve and a scaling technique was developed by .Khatri and Smith (2006). The method requires minimum field data, inflow and only one advance point measured around the mid length of the furrow. The testing of the method using data from two selected fields having very different infiltration characteristics has shown quite reliable results for prediction of infiltration characteristics. The method has potential for use in real time control.
The work reported in this paper is the second part of a study directed at the development of a simple and practical real-time control system for surface irrigation. The feasibility of the proposed system is assessed through simulation of the irrigation performance, using the scaled infiltration parameters given by the proposed method and those estimated from full advance data. The gains in irrigation performance possible from adoption of the real time control strategy are demonstrated.
2. Description of the proposed system
The proposed real-time control system involves:
• measurement or estimation of the inflow to each furrow or group of furrows,
• measurement of the advance at one point approximately mid way down the furrow,
• estimation of the infiltration characteristic for the furrow or group of furrows using the
scaling technique of Khatri and Smith (2006),
1 2 3 4 5 6 7 8 9 10 11 12 13 14 15 16 17 18 19 20 21 22 23 24 25 26 27 28 29 30
The actual measurement, simulation and control would preferably be automated but could be undertaken manually with very little capital investment on the part of the farmer.
A necessary precursor to application of the system is the determination of the shape of the infiltration characteristic (model infiltration curve) for the particular field or soil type. This is best done from a comprehensive evaluation of one or more furrows from the field, involving measurements of the inflow, advance and where possible runoff, with the infiltration curve determined using a model such as INFILT (McClymont and Smith, 1996) or IPARM (Gillies and Smith, 2005). The preferred (constant) furrow inflow rate is also determined at this stage although it may be altered over time as experience with operation of the system is accumulated.
The underlying hypothesis for the method is that the shape of the infiltration characteristic for a particular field or soil is relatively constant despite variations in the magnitudes of the infiltration rate or depth of infiltration. These spatial and temporal variations are accommodated by scaling the infiltration curve, where the scaling is determined from the measured advance point and the volume balance equation. The method of scaling is as described by Khatri and Smith (2006) and is summarized below. Any infiltration equation can be used however for consistency with available simulation models the present study employs the Kostiakov-Lewis equation:
(1)
τ
τ o
a f
k
I = +
where I is the cumulative infiltration (m3 /m), a, k, and fo are the fitted parameters, and
τ is the infiltration time (min).
In this method a scaling factor (Fs) is determined for each furrow or event from a re-arrangement of the volume balance model (as used by Elliot and Walker (1982)):
r tx f x kt
x A t
Q F
o a
z
o y o s
+ + − =
1 σ
σ
(2)
31
where Qo is the inflow rate for the corresponding furrow (m3/min), 1
2 3 4 5 6
Ao is the cross-sectional area of the flow at U/S end of furrow (m2) (determined by any appropriate method),
a, k, fo are the infiltration parameters for the model furrow,
σy is a surface shape factor taken to be a constant (0.77),
σz is the sub-surface shape factor for the model furrow, defined as:
(
)
(
a)(
r)
a r a
z + +
+ − + =
1 1
1 1
σ 7
8 9 10 11 12 13 14 15 16
17
18 19 20 21 22 23 24 25 26 27 28 29 30 31
r is the exponent from power curve advance function for the model curve,
and
r pt x=
t (min) is the time for the advance to reach the distance x (m) for the corresponding furrow.
This scaling factor (Fs) is then applied in conjunction with the Kostiakov–Lewis infiltration model to scale the infiltration parameters for each furrow:
(3) m
s a a =
(4) m
s s Fk k =
(5) om
s os F f
f =
where as, ks, fos are the scaled infiltration parameters for a furrow, Fs is the scaling factor for the corresponding furrow, and am, km, fom are the infiltration parameters for the model furrow.
For the proposed real time control system the infiltration estimates are required in sufficient time to allow selection and application of optimum times to cut-off while the irrigation event is under way. To achieve this, the advance times (t0.5) taken at or near the mid-point down the furrow/field (x0.5) are used in equation 2.
3. Analysis
1 2 3 4 5 6 7 8 9 10 11 12 13 14 15 16 17 18 19 20 21 22 23 24 25 26 27 28 29 30 31 32 33
Two very different fields with a total of 44 furrow irrigation events conducted by growers using their usual practices were selected for analysis, 27 furrow irrigation events for field T and 17 furrow irrigation events for field C. These fields were selected from the different farms across the cotton growing areas of southern Queensland for which irrigation water balance and irrigation advance data have been collected. The basis for selection was the relatively large number of events for each field.
Data collected for each event included:
• furrow inflow and outflow rates;
• irrigation advance (advance times for various points along the furrow including the time for the advance to reach the end of the furrow);
• physical characteristics of the furrow (length, slope, cross section shape).
The flow rate and irrigation advance were measured using the IRRIMATETM suite of tools developed by the National Centre for Irrigation in Agriculture (NCEA), as described by Dalton et al. (2001). The data sets are summarized in Tables 1 and 2.
The actual infiltration parameters and the scaled parameters for each furrow/event from the two fields, given by the INFILT software (McClymont and Smith, 1996) and the method of Khatri and Smith (2006), respectively, have been taken from the previous paper (Khatri and Smith, 2006).
3.2 Simulation methodology
SIRMOD (Surface Irrigation Simulation, Evaluation and Design)
To test the proposed real-time control system, simulations were performed for the two fields using the actual (INFILT) and the scaled infiltration parameters in the simulation model SIRMOD (Walker, 2001). These SIRMOD simulations were used to compare the irrigation performance (application efficiency Ea, requirement or storage efficiency Er, and distribution uniformity DU) of the actual irrigations, recipe approaches to irrigation performance improvement, and the simple real time control strategy.
1 2 3 4 5 6 7 8 9 10 11 12 13 14 15 16 17 18 19 20 21 22 23 24 25 26 27 28 29 30 31 32 33 34
efficiency. The input data required for the simulation component of the model include field length, slope, infiltration characteristics, target application depth, flow rate, Manning n and furrow geometry. The model output includes a detailed advance-recession trajectory, distribution of infiltrated water, volume balance, runoff hydrograph, water distribution uniformity, and the water application and requirement efficiencies. The ability of the SIRMOD to evaluate the irrigation performance of furrows and borders has been well documented (for example, McClymont et al., 1996).
The three performance measures used in the evaluation have their usual meanings.
Application efficiency Ea is defined as the ratio of volume of water stored in the root zone during irrigation to volume of water delivered in the field during that irrigation and usually expressed as a percentage.
Requirement (or storage) efficiency Er is a measure of the adequacy of the irrigation. It is defined as the ratio of water stored in the root zone during irrigation to water required (the deficit) in the root zone prior to irrigation.
Uniformity describes the spatial distribution of water over the field. The performance measure used in this paper, distribution uniformity DU, is defined as the average of the lowest 25% of infiltrated depths of water divided by the average infiltrated depth of water over the whole field.
Model strategies
To perform the simulations, six (6) irrigation strategies were framed to test the proposed system and to demonstrate the achievable gains in irrigation performance. The model strategies adopted are:
Strategy 1. Is the actual irrigation simulated using the actual infiltration parameters (INFILT a, k, fo), actual inflow (Qo) and actual cut-off time (tco) as recorded under usual farm practices.
1 2 3 4 5 6 7 8 9 10 11 12 13 14 15 16 17 18 19 20 21 22 23 24 25 26 27 28 29 30 31 32 33
Strategy 3. Optimisation of the actual irrigation. In this case each irrigation event was optimized by using the INFILT parameters and varying the inflow and cut-off time to obtain maximum application efficiency (Ea). This strategy also indicates the best over all flow rate.
Strategy 4a. A simple recipe for performance improvement, simulated using the INFILT parameters, actual inflow but with the cut-off time fixed equal to 90% of the advance time.
Strategy 4b. An alternative recipe, simulated using the INFILT parameters, a fixed inflow as selected from strategy 3 and cut-off time equal to 90% of the advance time.
Strategy 5. A simple practical real time control strategy in which the scaled infiltration parameters were used with a fixed inflow while varying/optimizing only the cut-off time to achieve the best irrigation.
Strategy 6. Simulation of the actual result of the real time control strategy (5), using the INFILT parameters and the same inflow and cut-off time as used in strategy 5.
4. Results and Discussion
4.1 Advance trajectories
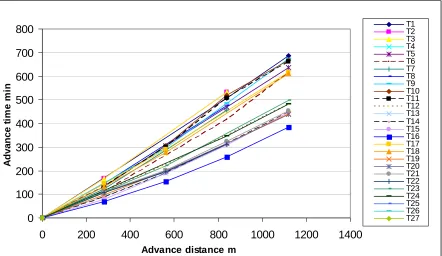
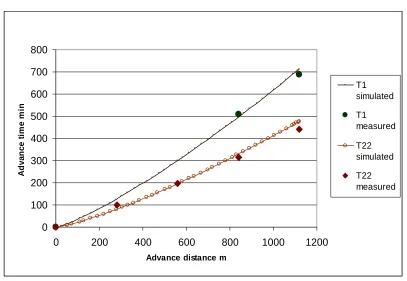
The previous paper (Khatri and Smith, 2006) demonstrated that the scaled infiltration was able to reproduce the measured advance curves when applied in the same volume balance model that was used to generate the infiltration parameters. This ability was confirmed by the SIRMOD simulations. The measured and simulated advance curves for field T are presented in Figures 1 and 2 respectively. From these curves it can be seen that the scaled infiltration has reproduced advance trajectories of similar form to the measured trajectories. As expected, the advance trajectories pass through the advance point selected for the infiltration scaling, for example, in the case of data sets T1 and T22 as shown in Figure 3, but exhibit some small divergence by the end of the field.
The trend line analysis (Fig 4) for the advance times at the end-points shows a strong correlation between the final measured and the simulated advance times, giving:
1 2 3 4 5 6 7 8 9 10 11 12 13 14 15 16 17 18 19 20 21 22 23 24 25 26 27 28 29 30 31 32 33 34
This close correlation and excellent reproduction of advance curves by SIRMOD simulations confirms the potential of the scaled infiltration for the purpose of real-time control.
4.2 Irrigation Performance
The summary of simulated irrigation performance results obtained for the model strategies are shown in Tables 3 and 4 for fields 1 and 2 respectively. The results obtained under each of the model strategies are discussed below.
Strategies 1 & 2 (Actual irrigation - usual farm management)
From the summary of simulation results for field T (Table 3) it is evident that the over all mean irrigation performance (application efficiency and storage efficiency) of the actual irrigations (strategies 1 and 2) was reasonable (<75%), with a mean application efficiency Ea of 77% and storage efficiency Er 91%. However, application efficiencies were shown to be highly variable from 50 to 95%. Similarly in case of field C the application efficiencies showed considerable variation from 16 to 57%, but this field showed a poorer performance (Table 4) with an over all mean application efficiency of 37% and storage efficiency of 97%.
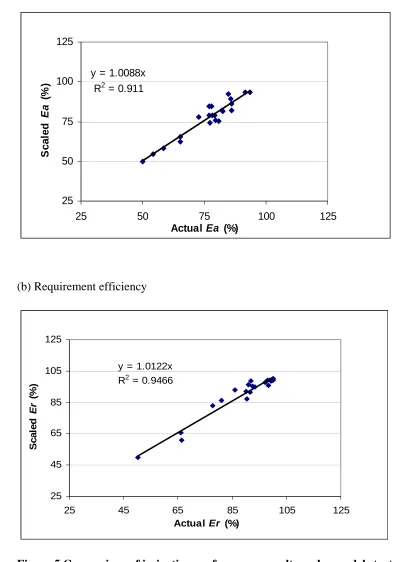
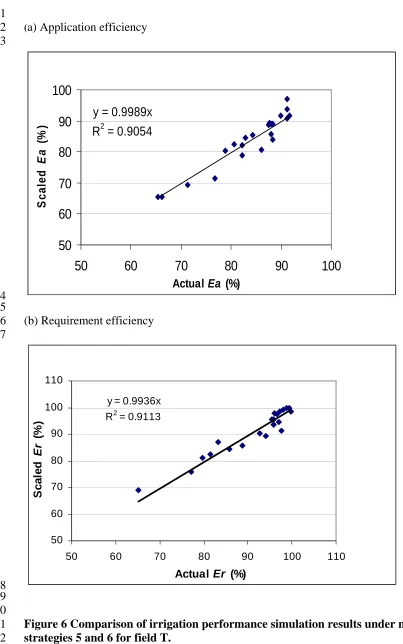
For all of the irrigation events, the simulated performance using the scaled infiltration (strategy 2) was similar statistically to the actual performance (strategy 1) for each field as shown for field T in Figures 5 and 6, respectively. The results summarized in Tables 3 and 4 also confirm that the overall mean performance obtained for each field under strategies 1 and 2 is almost identical, reflecting the ability of the scaled infiltration parameters to reproduce the actual irrigations.
Strategy3 (Perfect Control and Management)
1 2 3 4 5 6 7 8 9 10 11 12 13 14 15 16 17 18 19 20 21 22 23 24 25 26 27 28 29 30 31 32 33 34
Strategy 4 a & b (Simple Recipe Management)
Under strategy 4a a simple recipe management was applied where the cut-off time was fixed equal to 90% of the advance time. The performance was improved but in many events the advance did not reach the end of the field. To overcome this, strategy 4b was applied, using all the same parameters as in strategy 4a except that the inflow rate was increased to 6.5 l/s.
The simulation results (Table 3) revealed that performance was raised for field T, the application efficiency was improved in most events but showed great variation from 50% to 100% with a mean of 80%. Some furrows still faced an incomplete advance. The simple recipe management showed poorer results in case of field C, under both strategies 4a and 4b. The advance was unable reach the end of the field for many of the furrows and yet the field was shown to have low application efficiencies, varying from 15% to 47% with an overall mean of 34% (Table 4). Field C poses substantial problems for the irrigation manager because of the extreme variation in the infiltration characteristic across the field, hence its poor response to recipe management.
Strategies 5 & 6 (Real-time Control)
From Tables 3 and 4 it is evident that the simple real time control strategy (5) predicts improved performance (Ea and Er) for both fields. For field T the means of the performance measures are Ea 82.1% and Er 90.2%, with mean Ea of 70.3% and Er 82.7% for field C.
1 2 3 4 5 6 7 8 9 10 11 12 13 14 15 16 17 18 19 20 21 22 23 24 25 26 27 28 29 30 31 32 33 34
4.3 Water savings from real-time control
The performance simulation results (Tables 3 and 4) show there is considerable opportunity to improve the irrigation performance obtained under usual farm practices (strategy 1). The recipe management strategies (4a & b) were shown to raise the performance for field T but for some furrows the advance failed to reach the end of the field. However, the recipe management could not bring a simultaneous improvement in the three irrigation performance measures for field C. When the real time control (strategy 5) was applied the overall mean irrigation performance was improved for both fields. A highly significant improvement in irrigation performance was noted in case of field C, with application efficiency increasing from 37% to 70% as shown in Table 4, along with acceptable uniformity and storage efficiency. It is evident from these results that the simple real-time control system does have potential to bring significant gains in irrigation performance, with the additional benefit of reducing the volume of water applied per irrigation and deep drainage volumes, thus reducing the potential for environmental harm.
Table 6 presents the total volumes of water applied to the 44 furrows at fields T and C under usual farm management and real-time control. It can be seen from the table that the volume of water applied to the 44 furrows at fields T and C was reduced from 7341 m3 under usual farm management to 5071 m3 under real-time control. This indicates the substantial potential savings of 2270 m3 (2.270 Ml) of volume of water per irrigation, which is a significant loss of water to the grower. For Queensland cotton growers usually applying 4 to 6 irrigations annually this represents an annual water saving of 1.283 to 1.924 Ml/ha that can be used beneficially to grow more crop, clearly indicating the substantial benefits that are achievable in the irrigation industry by implementing simple real time control.
5. Conclusions
A simple practical system for real-time control of furrow irrigation that varies only the time to cut-off is proposed. To evaluate the method, the SIRMOD model was used to simulate the irrigation performance for two fields, for a range of irrigation strategies using both the scaled and the actual infiltration parameters. One of the strategies included in the simulations was the proposed real-time control strategy.
1 2 3 4 5 6 7 8 9 10 11 12 13 14 15 16 17 18 19 20 21 22 23 24 25 26 27 28 29 30 31 32 33
• the measured advance curves and measured irrigation performance were able to be
reproduced with sufficient accuracy using the scaled infiltration parameters,
• the simple real-time control strategy is feasible and has the potential to bring
significant improvements in irrigation performance over that achieved under simple recipe management or current farmer management, and
• substantial reductions in the total volume of water applied per irrigation are achievable, that could be used beneficially to grow a greater area of crop.
References
Azevedo, C.A.V., Merkley, G.P. and Walker, W.R., 1996. Surface irrigation real-time optimization model (SIRTOM). Proceedings of Computers in Agriculture Conference, Cancun Mexico, 11-14 June 1996, ASAE, 872-884.
Camecho, E., Lucena, C.P., Canas, J.R. and Alcaide, M., 1997. Model for management and control of furrow irrigation in real-time. Journal of Irrigation and Drainage Engineering, 123(4): 264-269.
Dalton, P., Raine, S.R. and Broadfoot, K., 2001. Best management practices for maximising whole farm irrigation efficiency in the Australian cotton industry. Final report to the Cotton Research and Development Corporation, National Centre for Engineering in Agriculture Report 179707/2, USQ, Toowoomba.
Elliott, R.L. and Walker W.R., 1982. Field evaluation of furrow infiltration and advance functions. Trans of the ASAE 25(2): 396-400.
Gillies, M.H. and Smith, R.J., 2005. Infiltration parameters from surface irrigation advance and runoff data. Irrigation Science 24(1):25-35.
1 2 3 4 5 6 7 8 9 10 11 12 13 14 15 16 17 18 19 20 21 22 23 24 25 26 27 28 29 30 31 32 33
Khatri, K.L. and Smith, R.J., 2005b. Evaluation of methods for determining infiltration parameters from irrigation advance data. Irrigation and Drainage, 54: 467-482.
Khatri, K.L. and Smith, R.J., 2006. Real-time prediction of soil infiltration characteristics for management of furrow irrigation. Irrigation ScienceDOI 10.1007/s00271-006-0032-1.
McClymont, D.J. and Smith, R.J., 1996. Infiltration parameters from optimization on furrow irrigation advance data. Irrigation Science, 17(1): 15-22.
McClymont, D.J., Raine, S.R. and Smith, R.J., 1996. The prediction of furrow irrigation performance using the surface irrigation model SIRMOD. Irrigation Australia 1996, Irrigation Association of Australia, Adelaide, May 1996.
Oyonarte, N.A., Mateos, L. and Palomo, M.J., 2002. Infiltration variability in furrow irrigation. Journal of Irrigation and Drainage Engineering, 128(1): 26-33.
Raine, S.R., McClymont, D.J. and Smith, R.J., 1997. The development of guidelines for surface irrigation in areas with variable infiltration. Proceedings of Australian Society of Sugercane Technologists 1997: 293-301.
Shafique, M.S. and Skogerboe, G.V., 1983. Impact of seasonal infiltration function variation on furrow irrigation performance. In: Advances in infiltration, Proceedings of National Conf. on Advances in Infiltration, 292-301.ASAE, St. Joseph, MI, USA.
Smith, D.L. and Duke, H. R., 1984. Prediction of irrigation advance rates in real time. ASAE paper No. 84-2590. American Society of Agric. Engineers St. Joseph, Mich.
Walker, W.R., and Busman, J.D., 1990. Real-time estimation of furrow infiltration. Journal of Irrigation and Drainage Engineering, 116(3): 299-318.
Table 1 Summary of data sets for field T 1
2
Furrow Length (m)
Cross-sectional area (m2)
Flow rate (m3/min)
Advance time (min)
T1 1120 0.050 0.3036 688
T2 840 0.050 0.3036 531
T3 840 0.0262 0.3036 531
T4 1120 0.050 0.3036 635
T5 1120 0.0262 0.3378 635
T6 1120 0.0262 0.3378 615
T7 840 0.0262 0.3546 457
T8 840 0.0262 0.3504 476
T9 1120 0.0262 0.3504 673
T10 1120 0.0262 0.3504 667
T11 1120 0.0262 0.3504 662
T12 1120 0.0262 0.3216 483
T13 840 0.0262 0.3216 316
T14 1120 0.0262 0.3216 446
T15 1120 0.0262 0.3216 448
T16 1120 0.0262 0.3678 383
T17 840 0.0262 0.3678 199
T18 840 0.0262 0.3678 195
T19 840 0.0262 0.3678 192
T20 1120 0.0262 0.2382 616
T21 1120 0.0262 0.2382 612
T22 1120 0.0262 0.4122 440
T23 1120 0.0262 0.4134 439
T24 1120 0.0262 0.3462 455
T25 840 0.0262 0.4272 312
T26 1120 0.0262 0.3876 498
T27 1120 0.0262 0.3876 481
Table 2 Summary of data sets for field C 1
2
Furrow Length (m)
Cross-sectional area (m2)
Flow rate (m3/min)
Advance time (min)
C1 240 0.038 0.0498 273
C2 240 0.038 0.0498 307
C3 240 0.038 0.0498 336
C4 240 0.038 0.0498 427
C5 240 0.038 0.3126 277
C6 240 0.038 0.3126 367
C7 240 0.038 0.1566 238
C8 240 0.038 0.1566 246
C9 240 0.038 0.1566 210
C10 180 0.038 0.2244 186
C11 240 0.038 0.4752 109
C12 240 0.038 0.1134 164
C13 240 0.038 0.2286 126
C14 180 0.038 0.27 144
C15 240 0.038 0.27 189
C16 180 0.038 0.27 124
C17 240 0.038 0.27 171
Table 3 Summary of irrigation performance under different modeling strategies for field T. 1
2 3 4 5 6 7 8
9 10 11 12 13 14
Management/Model strategies Ea (%) Er (%) DU (%)
Strategy 1 Actual irrigation 77.6 91.3 93.4
Strategy 2 Scaled infiltration 77.3 90.6 91.7
Strategy 3 Perfect management 90.2 90.1 94.0
Strategy 4a Simple recipe management ** 81.3 86.6 82.2
Strategy 4b Simple recipe management 80.5 88.6 84.5
Strategy 5 Real-time control (scaled infiltration) 82.1 90.2 92.2
Strategy 5 Real-time control (actual infiltration) 82.7 90.2 92.5
** Under this strategy the advance failed to reach the end of the field for six furrows
Table 4 Summary of irrigation performance under different modeling strategies for field C.
Management/Model strategies Ea (%) Er (%) DU (%)
Strategy 1 Actual irrigation 38.0 97.9 80.2
Strategy 2 Scaled infiltration 38.2 96.9 83.9
Strategy 3 Perfect management 72.1 95.9 92.5
Strategy 4a Simple recipe management ** 68.5 79.5 72.2
Strategy 4b Simple recipe management 34.4 88.6 86.6
Strategy 5 Real-time control (scaled infiltration) 70.3 82.7 88.5
Strategy 5 Real-time control (actual infiltration) 70.2 82.2 90.7
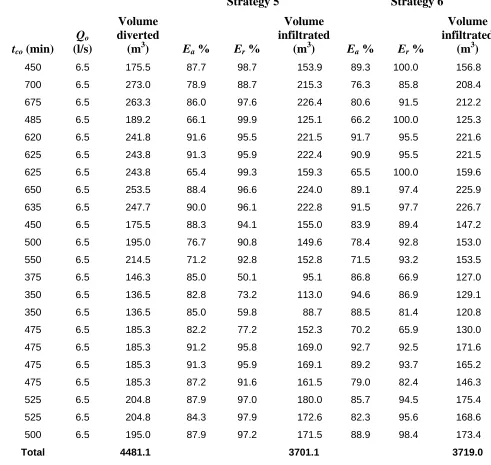
Table 5 Volume of water applied and individual irrigation performance for field T under real time control strategies 5 & 6.
1 2 3
4 5 6 7 8 9
Strategy 5 Strategy 6
tco (min) Qo (l/s)
Volume diverted
(m3) Ea % Er %
Volume infiltrated
(m3) Ea % Er %
Volume infiltrated
(m3)
450 6.5 175.5 87.7 98.7 153.9 89.3 100.0 156.8
700 6.5 273.0 78.9 88.7 215.3 76.3 85.8 208.4
675 6.5 263.3 86.0 97.6 226.4 80.6 91.5 212.2
485 6.5 189.2 66.1 99.9 125.1 66.2 100.0 125.3
620 6.5 241.8 91.6 95.5 221.5 91.7 95.5 221.6
625 6.5 243.8 91.3 95.9 222.4 90.9 95.5 221.5
625 6.5 243.8 65.4 99.3 159.3 65.5 100.0 159.6
650 6.5 253.5 88.4 96.6 224.0 89.1 97.4 225.9
635 6.5 247.7 90.0 96.1 222.8 91.5 97.7 226.7
450 6.5 175.5 88.3 94.1 155.0 83.9 89.4 147.2
500 6.5 195.0 76.7 90.8 149.6 78.4 92.8 153.0
550 6.5 214.5 71.2 92.8 152.8 71.5 93.2 153.5
375 6.5 146.3 85.0 50.1 95.1 86.8 66.9 127.0
350 6.5 136.5 82.8 73.2 113.0 94.6 86.9 129.1
350 6.5 136.5 85.0 59.8 88.7 88.5 81.4 120.8
475 6.5 185.3 82.2 77.2 152.3 70.2 65.9 130.0
475 6.5 185.3 91.2 95.8 169.0 92.7 92.5 171.6
475 6.5 185.3 91.3 95.9 169.1 89.2 93.7 165.2
475 6.5 185.3 87.2 91.6 161.5 79.0 82.4 146.3
525 6.5 204.8 87.9 97.0 180.0 85.7 94.5 175.4
525 6.5 204.8 84.3 97.9 172.6 82.3 95.6 168.6
500 6.5 195.0 87.9 97.2 171.5 88.9 98.4 173.4
Total 4481.1 3701.1 3719.0
Table 6 Summary of volumes of water applied to fields T and C under usual farm management and real time control.
Field
Water applied under usual farm
management (m3)
Water applied under real time control (m3)
Water savings due to real time control (m3)
Field T 5850 4481 1369
Field C 1491 590 901
0 100 200 300 400 500 600 700 800
0 200 400 600 800 1000 1200 1400
Advance distance m
A
d
van
ce
t
im
e
m
in
T1 T2 T3 T4 T5 T6 T7 T8 T9 T10 T11 T12 T13 T14 T15 T16 T17 T18 T19 T20 T21 T22 T23 T24 T25 T26 T27
[image:19.595.78.520.75.331.2]1 2 3 4 5 6
Figure 1 Measured advance curves for field T
0 100 200 300 400 500 600 700 800
0 200 400 600 800 1000 1200 1400
advance distance m
A
d
va
n
c
e ti
m
e
m
in
[image:19.595.54.522.211.715.2]7 8 9 10 11 12 13
1 2
0 100 200 300 400 500 600 700 800
0 200 400 600 800 1000 1200
Advance distance m
Ad
van
ce
t
im
e
m
in
T1 simulated
T1 measured
T22 simulated
T22 measured
[image:20.595.71.478.87.368.2]3 4 5 6 7 8 9
Figure 3 Comparison of measured and simulated advance trajectories for selected furrows
y = 0.9559x
R2 = 0.9459
100 300 500 700 900
100 300 500 700 900
Measured advance time min
S
im
u
la
te
d
a
d
van
ce t
ime m
in
[image:20.595.75.485.438.717.2]10 11 12 13 14
1 2 3 4
(a) Application efficiency
y = 1.0088x R2 = 0.911
25 50 75 100 125
25 50 75 100 125
Actual Ea (%)
S
cal
ed
Ea
(%
)
5 6 7 8 9 10
(b) Requirement efficiency
y = 1.0122x R2 = 0.9466
25 45 65 85 105 125
25 45 65 85 105 125
Actual Er (%)
Sc
a
le
d
Er
(%
)
[image:21.595.55.450.112.674.2]11 12 13 14 15 16 17 18
1 2 3
(a) Application efficiency
y = 0.9989x R2 = 0.9054
50
60
70
80
90
100
50
60
70
80
90
100
Actual Ea (%)
S
cal
ed
Ea
(%
)
4 5 6 7
(b) Requirement efficiency
y = 0.9936x
R2 = 0.9113
50 60 70 80 90 100 110
50 60 70 80 90 100 110
Actual Er (%)
S
cal
ed
Er
(%
)
[image:22.595.48.451.66.710.2]8 9 10 11 12 13 14 15 16