ClimateXChange is Scotland’s Centre of Expertise on Climate Change, providing independent advice, research and analysis to support the Scottish Government as it develops and implements policies on adapting to the changing climate and the transition to a low carbon society.
www.climatexchange.org.uk
Energy efficiency policy analysis with TIMES
Assessment of energy efficiency modelling
approaches and their potential impact on policy
Christian Calvillo, Karen Turner, Ragne Low, Peter McGregor, Keith BellOctober 2018
Executive summary
This report looks at different approaches to modelling energy efficiency within TIMES, the whole energy system modelling framework used by the Scottish Government to inform energy and climate change policy decisions. The approach taken can affect the results significantly, potentially affecting policy decisions. The research examines the implications of these different approaches and discusses best practice in order to inform energy efficiency policy. The main objectives for this report are:
1. To identify different approaches for energy efficiency scenario modelling in TIMES, and provide an assessment of strengths and limitations of each modelling approach.
2. To give recommendations on how to use TIMES effectively for energy efficiency policy analysis.
To achieve this, the UK TIMES model is used to implement six different energy efficiency scenarios for residential heating (i.e. reducing the energy use for heat demand of the residential buildings, via the implementation of different user constraints, while still meeting end user requirements), following different modelling approaches and replicating scenarios available in the literature. The results of these scenarios are analysed and compared against a ‘business-as-usual’ base scenario.
The main findings include:
• Energy efficiency scenarios which are, in theory, equivalent produced different results in terms of technology mix, energy use, CO2 emissions and costs. This suggests that the modelling approach taken
can significantly impact the outcomes of the model, potentially translating to very different policies.
• Pre-existing user-defined constraints within the model could limit or bias the policy solutions resulting from modelling runs. In this study, user constraints (not related to the analysed energy efficiency scenarios) were limiting the implementation of energy conservation technologies so the energy efficiency target could not be reached solely by using such alternatives.
• Some scenarios can provide better insight to informing policy as they more accurately reflect the impact of energy efficiency improvements in real life.
• There is no single energy efficiency scenario which is superior to the others, as each focuses on different policy targets which could come into conflict with each other. For example, the results of some scenarios prioritise energy efficiency improvements whereas others prioritise cost reduction or emission reductions. Policy makers should understand the compromises involved in using each of these scenarios and prioritise certain indicators over others.
The expected next steps in this research are;
i) to analyse energy efficiency scenarios in tandem with other types of scenarios, assessing if energy efficiency measures alone can deliver the relevant decarbonisation targets or if other measures are also required;
ii) to perform energy efficiency scenario analysis using TIMES and Computable General Equilibrium (CGE) economic models, with the objective of analysing the impact of energy efficiency measures in the wider economy as well as in the energy system.
www.climatexchange.org.uk P a g e | 2
Contents
Executive summary ... 1
1. Introduction ... 3
2. Literature review ... 6
3. The TIMES model - a brief description ... 14
4. Scenarios and case studies ... 17
5. Results ... 25
6. Results discussion and policy implications ... 53
7. Concluding remarks ... 58
References ... 60
Appendix A – Formulation and detailed description of the energy efficiency scenarios ... 62
Appendix B – Complementary results ... 66
www.climatexchange.org.uk P a g e | 3
1. Introduction
1.1 Background
In 2018 the Scottish Government published the Climate Change Plan for meeting its greenhouse gas emission reduction targets from 2017-2032 (Scottish Government, 2018a). The document sets out the Scottish Government’s vision and ambitions to tackle climate change and decarbonise the Scottish economy. In addition to the Climate Change Plan, the Scottish Energy Strategy, published in 2017 (Scottish Government, 2017a), presents the Government’s plans for the transition to a highly decarbonised energy system. Meanwhile the Energy Efficient Scotland Route Map (EES, Scottish Government, 2018b) sets out the Scottish Government’s plans to reduce energy demand, decarbonise the heating of Scotland’s built environment and tackle fuel poverty in a way that is socially and
economically sustainable, reflecting the Government’s designation of energy efficiency as a National Infrastructure Priority.
The main milestones set in the Climate Change Plan for energy efficiency are:
• “Where technically feasible by 2020, 60% of walls will be insulated and 70% of lofts will have at
least 200mm of insulation in the residential sector.
• By 2032, 35% of domestic buildings’ heat will be supplied using low carbon technologies
(including electrification of heating), where technically feasible, and the buildings will be insulated to the maximum appropriate level.
• By 2032, 70% of non-domestic buildings’ heat and cooling will be supplied using low carbon heat
technologies.
• By 2032, improvements to the building fabric of domestic buildings will result in a 15% reduction
in domestic heat demand.
• By 2032, improvements to the building fabric of non-domestic buildings will result in a 20% reduction in non-domestic heat demand.” (Scottish Government, 2018a).
Meeting these targets will require a transition of all buildings: homes, commercial properties and the public sector in Scotland to be near zero carbon by the middle of this century.
The Scottish Government’s Climate Change Plan and its related policies draw significantly on the results of applications of the Scottish TIMES model. TIMES is a whole energy system modelling approach that is a widely used tool for informing climate change and energy policies, with applications all around the world (Calvillo et al., 2017; Connolly et al., 2010). In the Climate Change Plan, the Scottish TIMES model is used to find least-cost ways of achieving emission reductions, also assessing how effort is best shared across different sectors of the Scottish economy. In effect, TIMES allows the development of a least cost pathway for Scotland’s energy system in meeting climate change targets (Scottish Government, 2018a).
1.2 Limitations and considerations of energy efficiency modelling and analysis with
TIMES
The literature examined for this report suggests that there are certain limitations and considerations that should be taken into account when analysing energy efficiency scenarios with TIMES. Some of the key issues in energy efficiency analysis with TIMES are explored below.
1.2.1 Issue 1 – Energy efficiency impact analysis with TIMES only addresses technology substitution
Energy efficiency is mainly represented in TIMES via technology substitution, which involves using a more efficient technology or process to produce the same energy service. However, final energy service demands are exogenous to the model, so that they do not reflect the elasticity of demand1. Moreover,
besides cost, other typical motivations for technology change are not directly modelled in TIMES. For
1 A certain price elasticity on end user demand can be implemented in TIMES. However, this is a feature that is
www.climatexchange.org.uk P a g e | 4
instance, consumer perception and preferences are not endogenous variables of the model, and other economic effects, such as change on disposable income due to energy efficiency or growth or
contraction in different sectors of the economy that, in turn, affect energy service demand in these sectors, are not considered2.
These characteristics limit the capability of TIMES to model and analyse the impacts of a broader range of energy efficiency actions on the wider economy and on energy user and supplier behaviour. (See Calvillo et al., 2017, for further discussion of these limitations). Whilst this issue is not the focus of the current report, it warrants further study.
1.2.2 Issue 2 – The user must choose how to test specific policies or targets with TIMES – The ‘what if…’ (Intervention driven) vs the ‘how to…’ (Goal driven) question
The TIMES model can be used to analyse a great variety of scenarios. However, two main types of approaches are normally used for informing policy:
1. Test a previously defined policy in the TIMES model to explore its potential impact. This is the ‘what if’ question, where the policy makers have an idea of the type of policies they intend to implement and analyse the impact of their implementation using TIMES. For instance, the ‘what if we set a carbon tax?’ question could be analysed by setting a cost (charge) for CO2 emissions in
TIMES. The results of such a scenario could then be used to inform the policy formation process. 2. Set up targets in TIMES and analyse the results to identify potential policies that could be
implemented to achieve the desired target. This is the ‘how to’ question, which differs from the previous approach as specific policies are not implemented in TIMES (intervention driven). Instead, the overall outcome or final policy target is specified in a scenario, allowing the model to decide the least-cost way to achieve it (goal driven). This approach is commonly used in
decarbonisation scenarios. For example, the ‘how (the least cost way) to reduce emissions in the transport sector by 20%’ question can be set in TIMES with a constraint on total emissions for this sector. The results can then be analysed and the resultant simulated changes in technology use could help to design policies supporting certain types of vehicles or fuels.
The first approach is more straightforward, as a specific policy is tested in the TIMES model and the results are used to see if the policy is likely to perform as expected or not. The second approach is useful for complex problems where the solutions (in terms of technology mix) are not always evident. Note that both of these approaches could be used effectively to inform policy and they could complement each other.
This study considers energy efficiency scenarios following the second approach, analysing how the precise way in which energy efficiency scenarios are implemented in TIMES (mainly through the use of constraints) could impact the results, and consequently, how the modeller’s chosen approach could lead to different policy recommendations. Accordingly, this study focuses on issues around modelling energy efficiency and not on specific policy options or actions.
1.2.3 Issue 3 – Different approaches to modelling energy efficiency are possible in TIMES There are several potential approaches to modelling energy efficiency scenarios in TIMES and numerous examples of this can be found in the literature. (See Section 2 for a literature review). For instance, energy efficiency improvements could be induced in the TIMES model by implementing a constraint in gas or electricity use, thereby promoting the change to more energy efficient technologies. Alternatively, the energy efficiency representation in TIMES could be improved by setting minimum levels of energy conservation technologies (passive technologies that do not require an input fuel), such as wall and loft insulation. Both approaches (among others) could achieve the same energy efficiency objective but the means of achieving it could differ importantly. This study addresses this modelling
2 The economy is typically taken to be exogenous in this and other types of models. The potential problem with this
www.climatexchange.org.uk P a g e | 5
issue, analysing the implications of selecting different energy efficiency modelling approaches on the results obtained with TIMES.
1.3 Scope and objectives of this study
There are several potential approaches to modelling energy efficiency scenarios in TIMES and numerous related research works can be found in the literature. However, from our initial review, we found that the analysis tended to lack depth or fail to follow through to cover all the implications of energy efficiency policies. Moreover, best practices for using TIMES to inform energy efficiency policy have not been directly assessed in the literature.
Therefore, the main objectives for this report are:
1. To identify different approaches for energy efficiency scenario modelling in TIMES, and provide an assessment of strengths and limitations of such modelling approaches.
2. To give recommendations on how to use TIMES effectively for energy efficiency policy analysis. This report seeks to support policy makers in analysing and designing the best energy efficiency policy measures, with the assistance of TIMES. In the Scottish context, the insights from this research could inform the modelling of energy efficiency scenarios in TIMES to help design policies which most effectively meet the objectives of the Scottish Government’s Energy Efficient Scotland programme. To achieve this, and in the absence of direct access to the Scottish TIMES, the UK TIMES model is used to implement six different energy efficiency scenarios for residential heating, following different modelling approaches and replicating scenarios available in the literature. The results of these scenarios are analysed and compared against a ‘business-as-usual’ base scenario. The differences and potential limitations of the scenarios are further analysed, and their implications for informing energy efficiency policy are discussed.
The rest of the report is organised as follows;
• Section 2 presents a brief literature review of TIMES research related to energy efficiency.
• Section 3 gives a brief overview of the TIMES model.
• Section 4 presents the scenarios and the methodology used in this study, including a description of the base scenario.
• Section 5 presents the results of the different energy efficiency scenarios.
• Section 6 explains and discusses the results, remarking on the potential limitations and drawbacks of the energy efficiency modelling approaches that are analysed.
www.climatexchange.org.uk P a g e | 6
2. Literature review
The TIMES modelling framework has been used to inform energy and climate change policies in a number of countries and regions around the world. The type and scope of the studies varies, but most consider energy efficiency in their findings to varying extents. However, very few include explicit energy efficiency scenarios and/or direct analysis of energy efficiency improvements. This section reviews studies using TIMES that consider energy efficiency, classifying them into:
• Studies that mention energy efficiency as part of the strategies to achieve their outcomes but do not assess it.
• Studies that indirectly assess energy efficiency, considered as an outcome of other non-energy-efficiency scenarios.
• Studies that directly assess energy efficiency, implementing energy efficiency scenarios3.
Note that the aim of this section is not to provide a comprehensive review of the literature but rather to highlight, by reference to a limited number of examples, some of the different approaches to the treatment of energy efficiency in studies using TIMES.
Moreover, note that energy efficiency can be interpreted as using less energy to produce the same amount of a service, or as producing more service output with the same energy input (IEA, 2014). In this study, as end user demands in TIMES are mainly static and exogenous to the model, energy efficiency is considered as reducing the amount of energy input to produce the same energy service (as reflected in fixed end user demand). See section 3.1 for a description of residential end-user demands in TIMES.
3 This category includes studies that claim to have energy efficiency scenarios, even if those scenarios do not
www.climatexchange.org.uk P a g e | 7
Table 1. Summary of energy efficiency related research works using TIMES. Energy efficiency
Ref TIMES version Focus Mentioned Indirectly
assessed Directly assessed Energy efficiency scenario type Weilong et al.
(2014) China TIMES CCS technology role on decarbonisation x Decarbonisation targets (emission constraints) Simoes et al.
(2015) TIMES_PT (Portugal) sensitivity analysis of different assumptions x Relaxing technology adoption Cayla and Maïzi
(2015) France TIMES Residential technology adoption patterns x N/A
Dai and Mischke
(2014) TIAM global Decarbonisation scenarios with a soft-linking approach x N/A Fortes et al. (2014) TIMES_PT
(Portugal) Decarbonisation scenarios with a soft-linking approach x Decarbonisation policies, carbon tax, support to renewables (minimum shares) Arndt et al. (2016) SATIM (South
Africa) Decarbonisation scenarios with a soft-linking approach x Decarbonisation policies, carbon tax, relaxation of import restrictions Føyn et al. (2011) TIAM global Potential of a world with 100% renewables x Decarbonisation targets (emission constraints and emission
taxes) Deane et al.
(2015a) Irish TIMES Analysis of electrification of heating x Technology adoption scenarios
Labriet et al. (2015) TIAM World Decarbonisation scenarios with a
soft-linking approach x Decarbonisation targets (emission constraints)
Blesl et al. (2007) German TIMES Energy efficiency on all sectors x energy use constraints and emission constraints Shi et al. (2016) China TIMES Energy efficiency in building sector x forcing technology adoption, demand projection changes Fais et al. (2016) UKTM Role of industry on decarbonisation x energy use constraints, share of renewables and emission
constraints Rosnes et al.
www.climatexchange.org.uk P a g e | 8
2.1 Studies that mention energy efficiency but do not assess it
TIMES-based analysis has been widely used to investigate decarbonisation scenarios, the effects of energy policies in different sectors and the impact of certain technologies. For instance, Weilong et al. (2014) use the China TIMES model to analyse the role of Carbon Capture and Storage (CCS) in China’s power sector, and conclude that, under a rigorous carbon mitigation scenario, there should be a widespread deployment of CCS technologies, nuclear and renewable energy in China’s power sector. In this study the authors implement decarbonisation scenarios based on emission constraints. Energy efficiency, understood as technological change is mentioned as part of the strategies to achieve the emission
reduction objectives, but it is not actively measured or further discussed (see Section 3 for a brief description of TIMES and how energy efficiency is approached in the model).
Simoes et al. (2015) present their analysis of how specific assumptions influence the outcomes of climate policy scenarios. Using the TIMES_PT (Portugal) version, this study assesses the uncertainty of the results dependent on the exogenous assumptions made in TIMES. The study considers seven scenarios, including: Baseline, High technology
efficiency, High demand, Low renewable electricity, Low hydro availability, High hydro availability and High oil price. The authors conclude that assumptions relating to
socioeconomic development (macro-economic and population growth) had the greatest impact, with up to 9% change of the Baseline scenario emissions in 2020. Assumptions on end-use technology deployment presented a 2.5% change from the Baseline scenario, and the availability and price of energy resources (hydro availability and oil prices) did not represent important variations on GHG emissions (less than 2% of the Baseline scenario emissions in 2020).
Note that this study of Simoes et al. (2015) focuses mainly on changes to CO2 emissions, so
whilst final energy use and share of renewables are mentioned, efficiency gains (as a reduction of energy use) are not explicitly assessed. In addition, the energy efficiency scenario used in this study involved changes in the potential penetration of end-use efficient technologies. This scenario removes the limits on the degree of penetration of more efficient and renewable technologies (removing technology adoption constraints – see Section 3 for more details on energy efficiency modelling in TIMES). However, it is important to note that relaxing technology adoption constraints does not necessarily translate into the adoption of more efficient technologies as the most cost-effective options could be less efficient
technologies that use cheaper input fuels. Moreover, the relaxation of these constraints could result in very abrupt or unrealistic technology changes.
A different modelling approach is presented in Cayla and Maïzi (2015), where the TIMES France model framework is modified to take household behaviour and heterogeneity into account (in the form of household daily energy consumption and equipment purchasing behaviour). The authors state that in current TIMES models this is not adequately modelled as they represent energy demand by a single mean or representative household. Results show that in the mean household model (original), only one technology is diffused at each time period. Therefore, the results obtained may seem unrealistic, as from one time period to the next we observe a 100% market share reversal of gas boilers to heat pumps.
www.climatexchange.org.uk P a g e | 9
There are many papers analysing climate change policies following a soft-linking4 approach
with TIMES and computable general equilibrium models (CGE)5. For example, in Dai and
Mischke (2014) the global TIAM model is modified to introduce three sub-regions of China (East, Central, and West), and is linked to the global Asia-Pacific Integrated
Modelling/Computable General Equilibrium (AIM/CGE) model. The analysis is mainly a soft-linking exercise, and explores different energy and economic development scenarios up to 2050. The authors conclude that, mainly due to changes in the economy, Chinese energy consumption and emissions will decrease during that period, while important regional differences within China continue to exist. The study mentions energy efficiency briefly but does not measure it.
A similar example is presented in Arndt et al. (2016). In this study, the South African TIMES model (SATIM) is coupled to the South African General Equilibrium (SAGE) model. The soft-linking process consisted of SATIM computing a power plant investment plan based on forecasted electricity demand and fossil fuel prices from SAGE. SAGE replicates the power plant mix and associated electricity price from SATIM, and then revises its electricity demand and fuel price forecasts. The three analysed scenarios are: a carbon tax, liberalization of import supply restrictions (to exploit regional hydropower potential), and a combined policy where both carbon taxes and import liberalization are implemented. The authors conclude that a hydropower based energy strategy could be a potentially inexpensive approach to decarbonizing the South African economy. In this case, energy efficiency is also mentioned in the strategy but is not measured.
Different energy policy scenarios in Portugal are analysed in Fortes et al., (2014), using a soft-linking platform with TIMES and GEM-E3 (General Equilibrium Model for Economy, Energy, Environment) models. Three policy scenarios for decarbonisation are considered and energy efficiency is mentioned as part of the strategies but it is not explicitly
implemented in the scenarios or assessed as part of the results. The outcomes of this soft-linking exercise show that TIMES is very sensitive to energy service price changes, generating a wide range of results. On the contrary, the soft-linking framework partially offsets the increase or decrease in energy costs from the policy scenarios (reducing uncertainty).
2.2 Studies that indirectly assess energy efficiency, considered as an
outcome of other non-energy-efficiency scenarios
In addition to the studies that mention energy efficiency but do not assess it, other studies allow indirect assessment of energy efficiency via other reported results (such as changes in final energy consumption). An example of this can be found in Føyn et al. (2011), presenting a global climate change analysis using the TIAM global energy system model. The focus of this study is to test if it is possible to reach a global 100% renewable energy system with the existing model database. Three decarbonisation scenarios are analysed, including emission constraints and carbon taxes, and final energy use is assessed, indirectly including energy efficiency in the results (measured as a resulting reduction on total energy use, which contributes in reaching the decarbonisation scenarios). The main conclusion is that the
4 Soft-linking refers to the process in which two models communicate ‘off-line’. The two models run
independently, and interact by passing some of the outputs of one model to the other. This process is usually iterative, and it is repeated until a convergence criterion is met.
5 The modelling details of how do the reviewed papers perform the soft-linking between models falls
www.climatexchange.org.uk P a g e | 10
climate change target of 2ºC is feasible, but expensive. Also, in scenarios with high economic growth it will be hard to reach a 100% renewable system.
Soft-linking approaches, indirectly assessing energy efficiency, can also be found in the literature. For instance, Deane et al. (2015) explores the impacts of increased electrification of residential heating on the power system and associated emissions from the residential sector. In particular, the study assesses how many houses can be served with 1000MW of heat pumps (HP), and how the power system will be affected by this. The soft-linking setting uses the Irish-TIMES model to assess the full energy system of Ireland under the technology adoption scenario. Then, PLEXOS (a power system model) is used to examine the impact and technical appropriateness (of the technology mix produced with TIMES) for the
electrification of heating requirement for the year 2020. Finally, the ArDEM (housing stock) model is used to accurately assess how many households can be served by the new technologies. The outcomes of this study suggest that electrification reaches a level of approximately 914 ktoe (10.6 TWh) by 2020, representing the heating requirements of approximately 817000 dwellings (according to TIMES) or between 270000 and 340000, depending on the energy efficiency performance of the households (according to ArDEM). The authors remark on the important difference in estimates between the models,
concluding that relying solely on energy systems models may lead to an overestimation of the extent of electrification of residential heating. Even though energy efficiency
improvement is not explicitly measured, it is indirectly assessed as part of the results. In Labriet et al. (2015), the authors present a soft-linking methodology for TIAM-WORLD model and GEMINI-E3 (global multi-regional CGE model). The TIAM-WORLD receives sector economic production data (macro-drivers, such as GDP or industrial outputs) from GEMINI-E3 to recalculate energy service demands, while GEMINI-E3 model receives data from TIAM-WORLD on energy and CO2 prices, energy mix and capital consumption. The
study analyses 2 decarbonisation scenarios based on sectoral and regional emission constraints, and the authors conclude that the inter-sectoral effects of climate policies have little effect on overall aggregated sectoral emissions, as the sectoral emissions difference between TIAM-WORLD used in a standalone manner and the coupled models is smaller than 5%. Note that, similar to the abovementioned studies, energy efficiency is not explicitly implemented on the analysed decarbonisation scenarios. However, the sectoral energy efficiency improvements as a reduction of energy use are included in the reported results.
2.3 Studies that directly assess energy efficiency, implementing energy
efficiency scenarios
Finally, we review examples of studies that implement energy efficiency scenarios as part of their analysis. Blesl et al. (2007) is an example of energy efficiency focused analysis, where TIMES is used to analyse the impacts of efficiency improvement measures on the German energy system, measuring energy savings, technological development, emissions and costs. Six energy efficiency scenarios are considered, five of them are modelled by limiting the fuel consumption of all technologies in a single sector: road transport, residential, service, industrial and power sectors, and the sixth scenario combines the measures for all sectors. Results of these energy efficiency scenarios show that the transport sector presents the most expensive CO2 reduction, mainly using bio-fuels and methanol to achieve the efficiency
targets. On the other hand, the residential sector offers the largest relative benefits of CO2
reduction and cost savings, mainly through substitution of conventional gas or oil boilers by condensing gas boilers. An additional scenario is also considered, which assumes the CO2
emissions in the combined efficiency measures scenario as the target. In other words, this case does not implement the sectoral input fuel constraints of the energy efficiency
www.climatexchange.org.uk P a g e | 11
service demands in these sectors is lower), relative to the previous energy efficiency scenarios. The authors conclude that the same amount of CO2 reduction is possible at a
lower cost, when there is higher flexibility on the sectoral efficiency targets. These results also suggest that the sectoral approach taken to modelling energy efficiency could significantly affect the model results and might lead to impractical solutions.
A TIMES modelling extension is presented in Fais et al. (2016), where the UK TIMES model is modified to incorporate a process-oriented modelling approach for the industrial sector. The scope of this analysis is to assess the potential contribution of UK industry to system wide targets on energy efficiency, renewable energy and emission reduction. The authors propose 5 scenarios: base case, emission reduction, emission reduction + minimum renewable shares, emission reduction + energy efficiency, and emission reductions + minimum renewable shares + energy efficiency. The energy efficiency scenarios implement a linear reduction of final energy use of 0.9% per year. However, due to lack of detail in the paper, it is not clear how these scenarios are modelled in TIMES; according to the authors’ description, it could be assumed that it is something similar to the approach used in Blesl et al. (2007), that is limiting the fuel consumption of all technologies in a single sector. The authors conclude that with this new process-oriented modelling approach, the contribution of industry to decarbonisation of the energy system has clearly increased in comparison with previous reported outcomes.
Shi et al. (2016) present a different energy efficiency modelling approach. Using the China version of TIMES, the authors analyse the impact of technical progress (improving energy efficiency) and the use of renewable energy in the Chinese building sector. The study considers four scenarios with different levels of insulation improvement and domestic renewable technology penetration (such as solar heaters) in the building stock. Unlike the studies described above, these scenarios include energy efficiency measures implicitly in their demand projections, reducing directly the demand for heating services in TIMES, instead of using constraints. The authors conclude that renewable energy sources, such as PV, and ambitious energy efficiency standards will be necessary to maintain a low level of direct carbon emissions in China’s building sector up to 2050.
Another study focusing on energy efficiency in the residential sector is proposed in Rosnes et al., (2017). The focus of the study is to implement an energy efficiency scenario where the residential heating service demand is reduced by 27% by 2030 (in comparison with 2010) using two different models – the TIMES-Norway and the CGE model SNoW (Statistics Norway World model). Then, the results of both models are analysed and compared. The energy efficiency scenario in TIMES is modelled by imposing the adoption of energy conservation technologies (such as thermal insulation and building retrofitting) in order to reduce by 27% the use of energy for heating. The authors remark that, as expected, the target reduction was achieved by the models in very different ways. In SNoW by reducing demand and by technology substitution in TIMES. Rosnes et al., (2017) also remark that energy service demands are exogenous in TIMES, precluding any potential demand changes, and the CGE model does not have the level of technology detail available in TIMES. The authors conclude that, considering the strengths, limitations and different model scopes, policy makers should not rely on a single tool to inform the energy policy making process.
2.4 Summary and discussion of findings
www.climatexchange.org.uk P a g e | 12
From the studies reviewed that measure energy efficiency improvements, most cases report them as a by-product of other type of scenarios, such as emission reduction, renewable energy penetration or technology adoption cases. Only a few studies explicitly consider energy efficiency scenarios, in most cases in combination with other type of scenarios such as emission reduction targets.
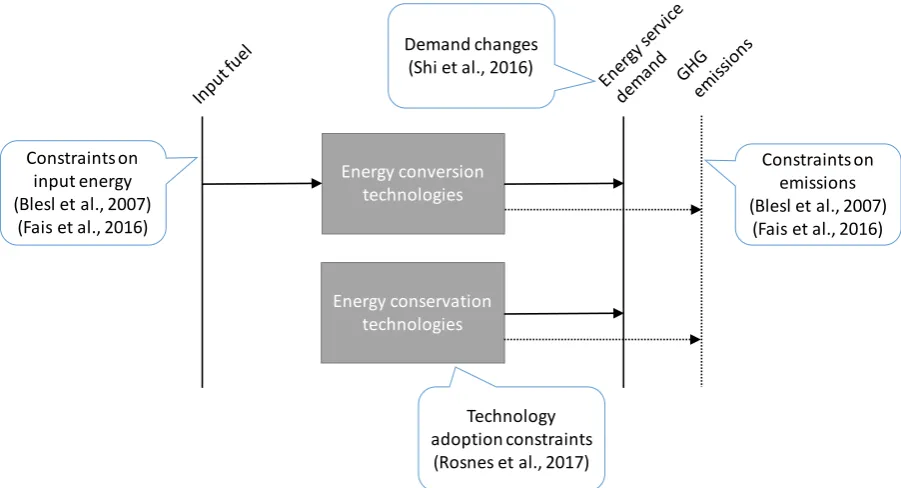
Moreover, the studies that explicitly implement energy efficiency scenarios have taken significantly different approaches. Figure 1 shows how energy service demand is met in TIMES, and how different scenarios have been applied in the reviewed examples that explicitly consider energy efficiency. In TIMES, energy service demands can be met with energy conversion technologies and with energy conservation technologies (see Figure 1). For instance, residential space heating demand could be met by using a gas boiler (energy conversion technology) and/or by improving wall insulation (energy conservation6
[image:12.595.72.523.271.515.2]technology). Note that this a simple generic description, and not all demand can be met by energy conservation technologies.
Figure 1. Energy efficiency scenario approach diagram of examples found in the literature.
The study presented in Blesl et al. (2007) approaches energy efficiency with total energy use constraints (reducing the energy input required to meet the same demand), and with
emission constraints, which is not directly implementing energy efficiency but could also produce improvements in this area. A similar approach is taken in Fais et al. (2016), implementing a combination of energy efficiency scenarios (energy use constraints) with emission constraints and minimum shares of renewable sources. These approaches implementing input fuel constraints could be effective in achieving overall energy efficiency improvements. Alternatively, if the final goal is to decarbonise the energy system, an emission reduction constraint could achieve more cost-effective solutions, indirectly driving energy efficiency. However, the results should be analysed with caution as these
approaches might place unrealistic burdens on certain sectors, obliged to make most of the
6 Energy conservation is, by definition, not energy efficiency. However, due to the way energy
efficiency improvements are measured in TIMES, energy conservation technologies are considered in this study as a proxy of energy efficiency investments.
Energy conversion technologies
Energy conservation technologies
Constraints on input energy (Blesl et al., 2007)
(Fais et al., 2016)
Technology adoption constraints (Rosnes et al., 2017) Demand changes
(Shi et al., 2016)
Constraints on emissions (Blesl et al., 2007)
www.climatexchange.org.uk P a g e | 13
energy efficiency improvements, or they might be over reliant on a limited number of technologies instead of a more realistic mix.
Conversely, Shi et al. (2016) implement their energy efficiency scenarios by adjusting their demand projections. However, it is not clear if the cost to achieve this demand reduction is considered, and how this affects the results produced with TIMES. This suggests that by exogenously making demand adjustments, much of the impact on the energy system is taken out of the model, potentially leading to unrealistic technology adoption scenarios. Rosnes et al., (2017) take a different approach in their energy efficiency scenarios, implementing minimum technology adoption constraints (imposing energy conservation technologies). Certainly this approach produces energy efficiency improvements as less heat production will be required, but it is not clear what happens with the other technologies and the model might decide to change to a less efficient system that uses cheaper input fuels.
www.climatexchange.org.uk P a g e | 14
3. The TIMES model - a brief description
This section presents a brief description of the TIMES model, to assist the reader in gaining general understanding of the model. A more detailed description of the model can be found in Calvillo et al. (2017) and formal documentation can be found in Loulou et al. (2004, 2005). TIMES (The Integrated MARKAL-EFOM System) is an energy system-wide bottom-up model, which uses linear-programming to find a least-cost provision of energy to meet specified energy service demands, according to a number of user constraints (such as limits on GHG emissions, levels of technology adoption, etc.).
TIMES considers all the processes of the energy system. From the extraction of primary resources to the end use of energy services, the model considers all the processes that transform, transport, distribute and convert energy to supply energy services. Figure 2 shows how TIMES models the energy system. The inputs, or exogenous variables of the model, are the data of the supply and demand side (end-use service demand). The former is composed of the primary energy resources and imports availability (block 1), and the latter corresponds to energy service demands (block 6). Note that the energy demands drive the energy system in the model and are structured by sectors: residential, commercial,
agricultural, transport and industrial (“IEA-ETSAP | Times”). The outputs of the model, or endogenous variables, include emissions and waste (block 7), energy losses associated with the various conversion and energy transport processes (block 8), technology capacity
planning (investment decisions) and different economic variables (block 9), including energy prices, costs, profits, etc. Additionally, energy flows (energy carrier variables) are also endogenous to the model, while the technology and processes’ techno-economic parameters (costs, discount rates, efficiencies, and other technical constraints) are exogenous.
Figure 2. Modelling of the energy system in TIMES (Calvillo et al., 2017).
All the items depicted in Figure 2 are modelled in TIMES as three elements: Technologies (also called processes), Commodities, and Commodity flows. The commodities are all the energy carriers (e.g. electricity or coal), energy services (e.g. heating or transportation of heavy goods), materials, monetary flows (e.g. costs), and emissions (e.g. CO2 or NOx). The
Technologies or processes are representations of physical devices that transform
commodities into other commodities, including energy conversion technologies (e.g. a boiler or a light bulb) and other processes, such as: extraction, production, transport, and
transmission and distribution of commodities. Lastly, commodity flows represent an input or an output of a process. Commodities could be used in different processes (e.g. electricity or
1 2 3 4 5 6
7 Production/ extraction/ transport Energy conversion technologies Transmission & distribution Energy service demand End use energy conversion Emissions and waste 8 Energy losses 9 Capacity and economic variables Energy carrier variables between processes are endogenous
Techno-economic parameters are exogenous Primary
resources and imports
Exogenous variables
Processes modelled in TIMES
www.climatexchange.org.uk P a g e | 15
gas). Commodity flows are attached to a particular process. For example, Gas is the
commodity and the commodity flow is the amount of gas used in a gas boiler (see Figure 3).
Figure 3. Example of processes, commodities and commodities flows in TIMES. Note that the technologies and/or processes in TIMES are modelled using different exogenous techno-economic parameters. These parameters define the types of
commodities used as inputs and outputs, the performance characteristics, and the costs of the process and/or technologies. Examples of these parameters include: technology investment costs per capacity unit, operation and maintenance costs, discount rates, operational efficiency, technology lifespan, and emissions per unit of production.
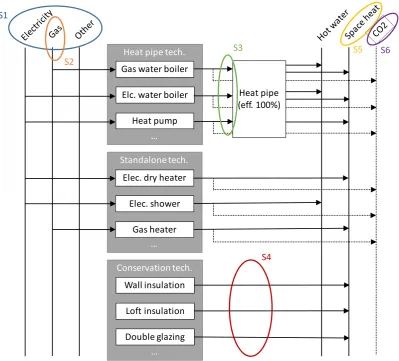
3.1 Residential heating modelling in TIMES
Figure 4 shows the residential heating modelling approach used in TIMES. Residential heating is an energy service demand modelled as two demand commodities: domestic hot water and domestic space heat (right-hand side of Figure 4). The domestic hot water demand in TIMES can be met with energy conversion technologies, such as water boilers, that transform energy carriers (e.g. electricity, gas, oil, etc.) into the required service. The domestic space heating demand in TIMES could use the same energy conversion
technologies as used for the hot water demand, but it can also partly be met with energy conservation technologies, which are passive elements that reduce the need for space heating demand (e.g. insulation materials, smart thermostats, etc.). As demands are mainly static in TIMES (i.e. they are exogenous user-defined parameters that cannot be modified endogenously by the model), these energy conservation measures are modelled as a technology that also produces that service, indirectly reducing that demand, but without an input fuel (see the lower middle block of technologies in Figure 4).
Note that there is a distinction between energy conversion technologies in TIMES, based on how they deliver the energy services. They can be classified in two groups.
The first group is heat pipe technologies, which are those technologies that use pipes to transport hot water (or some other fluid) to its end use. For example, a gas boiler heats up water which then goes through the household pipes to the tap or shower for domestic hot water, or to the radiators for space heating.
The second group is formed by standalone technologies (second block of technologies in Figure 4). These technologies differ from the previous group because they do not need a residential pipe network to deliver the end user demand. For instance, dry electric heaters or electric showers.
For modelling purposes, the main difference between these two groups is that heat pipe technologies have an intermediate process before the service demand, transforming the output of the energy conversion technology into the two energy services (i.e. heat pipe technologies can be used to supply both domestic hot water and space heating), while the standalone technologies are normally used for one of the two services (i.e. one technology is
Gas boiler
(process)
Gas
(commodity)
(commodity)
Heat
CO2
(commodity)
1kWh of Gas
(com. flow)
0.8kWh of Heat
(com. flow)
www.climatexchange.org.uk P a g e | 16
used for space heating and a different one is used for domestic hot water). Note that these types of technologies could be used in a complementary fashion, as in many cases there could be a combination of both heat pipes and standalone technologies. For instance, having a gas boiler and an electric shower.
3.1.1 Figure 4. Residential heating modelling in TIMES.
Heat pipe tech.
…
Gas water boiler Elc. water boiler
Heat pump
Standalone tech.
…
Elec. dry heater Elec. shower
Heat pipe (eff. 100%)
Conservation tech.
…
Wall insulation Loft insulation Double glazing
www.climatexchange.org.uk P a g e | 17
4. Scenarios and case studies
This section describes the energy efficiency scenarios used in this study to assess the impacts of the different modelling approaches. It also presents the methodology used to compare and analyse the scenarios, including a description of the base scenario that is used as a benchmark.
4.1 The UKTM model and the base scenario
The UK TIMES model (UKTM) is used in this study to analyse the different energy efficiency scenarios7, and the outputs are compared with a ‘business-as-usual’ base scenario. Note
that this base scenario follows a least-cost pathway, according to the data and modelling constraints set in UKTM and this base scenario, and it does not consider emission reduction targets. So, this scenario does not intend to provide the most probable or practical picture of the UK energy system in 2050, but to serve as a benchmark to assess the different energy efficiency modelling approaches.
This model differs from other TIMES versions, especially in the input data used, which should reflect the characteristics of the country or region modelled. However, the general structure of different country models will be similar. Thus, the insights obtained here are very likely to be of general use and are likely to be applicable to other TIMES models.
UK TIMES is a very large model with thousands of variables, parameters and constraints. For the sake of brevity, only data and variables related to the residential modelling and heating demand in the base scenario are presented here. (See UCL, (2014) for more information on the UK TIMES model). Figure 5 shows the energy service demand projections for the residential sector in the UKTM base scenario. The residential service demands (in PJ) are: space heating for existing houses (RHEA), space heating for new houses (RHNA), hot water for existing houses (RWEA), hot water for new houses (RWNA), cooking hobs (RCH), cooking ovens (RCO), cooking other (RCE, including kettles,
microwaves, etc.), wet appliances (REW, including washing machine, driers and
dishwasher), consumer electronics (REA, including TV, hi-fi, game console, etc.), computers (RECP), refrigerators (RECR), freezers (RECF) and other demands (REO). Note heating related demands are separated into two types of residential houses: existing and new. New housing demands are projected to grow in time (new houses being built), whereas exiting housing demand has a decreasing projection (old houses are not used anymore and/or demolished). This differentiation is made as not all technologies apply to both types of housing. For instance, in UKTM energy conservation technologies can only be applied to existing houses as the new houses are assumed already to be more energy efficient, so no extra building envelope technologies are required. Also, some technologies might have special constraints and/or requirements according to the type of housing. An example of this is district heating which is considered to be cheaper to implement on new houses than on existing ones.
Figure 5 shows that the largest demand corresponds to space heating (RHEA in yellow with ‘o’ marker and RHNA in purple with ‘∗’ marker), followed by domestic hot water demand (RWEA in green with ‘□’ marker and RWNA in cyan with ‘x’ marker). Other energy service demands are considerably smaller.
www.climatexchange.org.uk P a g e | 18
Figure 5. Residential energy service demand projections in UKTM – Base scenario. Figure 6 shows the total energy use for residential heating purposes in the base scenario. In the UKTM model, residential demand is organised in two groups: existing aggregated houses (labelled ‘EA’ in Figure 6), which represent the combined energy service demands for all existing houses in the UK by the start of the baseline year (2010), and new
aggregated houses (labelled ‘NA’ in Figure 6). It can be seen that EA demand decreases in time (blue line with ‘o’ marker in Figure 6), as existing houses are replaced by new houses, so NA demand increases (red line with ‘∗’ marker) accordingly. The sum of both groups of houses is the total residential heating demand in this base scenario (solid yellow line). The energy efficiency target applied in this study is expressed in terms of the total energy used for heat in the residential sector. It is illustrated with the pale purple dashed line in Figure 6, and it is applied for all scenarios (described in detail in Section 4.2). The resulting energy use value of this target is computed as 10% less than the total energy consumption value in 2010. Note that this target has been arbitrarily selected for this study and does not represent any particular policy target. However, this analysis could be adjusted to any other energy efficiency target.
2010 2015 2020 2025 2030 2035 2040 2045 2050
year
0 100 200 300 400 500 600 700 800 900 1000
Energy (Pj)
www.climatexchange.org.uk P a g e | 19
Figure 6. Aggregated residential heat energy use – Base scenario.
Figure 7 shows the fuel mix to meet the residential heating demand in the base scenario – which has the objective of meeting energy service demand at least cost with no emissions constraints – in different years. Looking at the figure it is clear that the main input fuel for heating is gas, starting with around 85% of total energy consumption in 2010 and increasing up to around 90% in 2030 and 2050. Other important fuels in 2010 (see Figure 7.a) are oil (OIL 7.4%), electricity (ELC 5.3%) and small shares of coal (COA 1.7%) and biomass (BIO 0.4%). By 2030 (see Figure 7.b) oil and coal have disappeared and are mainly replaced by electricity (ELC 9.9%). Lastly, 2050 maintains a similar pattern of fuel mix to 2030 with very minor variations (see Figure 7.c).
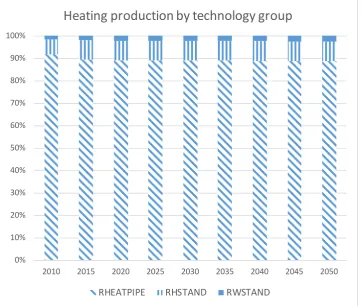
As described in Section 3.1, heating and domestic hot water production technologies in TIMES can be grouped in two types: heat pipe and stand alone, and the stand alone normally produce one of the two services (i.e. heating or domestic hot water). Figure 8 shows the shares of each technology group in the base scenario. It can be seen that for the entire time horizon, most heating technologies are of the heat pipe type (around 90%, diagonal bars pattern in Figure 8) and just a small share are standalone (around 10%), which are mainly used for heating (vertical bars and solid patterns in Figure 8).
2010 2015 2020 2025 2030 2035 2040 2045 2050
year
0 200 400 600 800 1000 1200 1400 1600
Energy (Pj)
www.climatexchange.org.uk P a g e | 20
Figure 7. Residential heating energy consumption by fuel in 2010, 2030 and 2050 – Base scenario.
COA 1.7% ELC 5.4%
GAS 85.1%
BIO 0.4% OIL 7.5%
HYG 0.0%
a) Residential heating energy consumption by fuel 2010
COA ELC GAS BIO OIL HYG
COA 0.0% ELC
9.9%
GAS 89.5% BIO
0.6%
OIL 0.0% 0.0%HYG
b) Residential heating energy consumption by fuel 2030
COA ELC GAS BIO OIL HYG
COA 0.0% ELC
9.5%
GAS 90.2% BIO
0.3%
OIL 0.0% 0.0%HYG
c) Residential heating energy consumption by fuel 2050
www.climatexchange.org.uk P a g e | 21
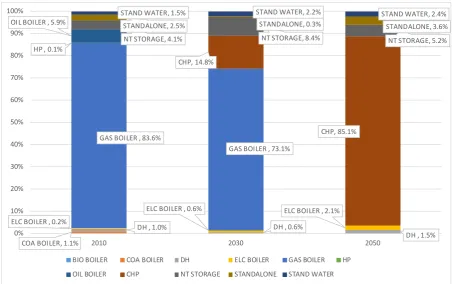
Figure 8. Residential heating energy production by technology group – Base scenario Figure 9 shows the technology production mix. In 2010 (Figure 9), the technology with the largest penetration is the gas boiler (83.6%), with the oil boiler in second place (5.9%). Other technologies are also present but with considerably smaller penetration levels: electric night storage (labelled ‘NT storage’, 4.1%), standalone heater (labelled ‘Standalone’, 2.5%), standalone water heater (labelled ‘Stand Water’, 1.5%), coal boiler (1.1%), district heating (1.0%), electric boiler (0.2%) and heat pumps (HP, 0.1%). In 2030 (middle column in Figure 9) an important change appears, as the oil and coal boilers, HP and partly gas boilers are replaced with gas-fired combined heat and power systems (CHP, 14.8%) but gas boilers remain the main technology with 73.1%. By 2050 (right column in Figure 9) the CHP increasing trend continued and it now fully replaces gas boilers, reaching 85.1% of technology penetration. The technology mix is complemented with electric boilers (2.1%) and district heating (1.5%).
These shares correspond to the fuel mix shown in Figure 7, where gas is the main input fuel, so the main technology used in this base scenario is the gas boiler and CHP (a heat pipe technology).
0% 10% 20% 30% 40% 50% 60% 70% 80% 90% 100%
2010 2015 2020 2025 2030 2035 2040 2045 2050
Heating production by technology group
www.climatexchange.org.uk P a g e | 22
Figure 9. Residential heating production by technology in 2010, 2030 and 2050 – Base scenario.
Figure 10. CO2 emissions per sector – Base scenario.
Figure 10 shows the evolution of CO2 emission production per sector in the base scenario.
The figure shows that the transport sector (TRA, pink line with ‘x’ marker in Figure 10) is the largest generator of CO2 emissions. In 2010, the second largest emission contributor is the
electricity sector (ELC, light green line with ‘o’ marker), but this sector decarbonises gradually up to 2030, after which the emissions remain stable. The residential (orange line with ‘∗’ marker) and industrial (light blue line with ‘□’ marker) sectors follow as the third and
COA BOILER, 1.1%
DH , 1.0% DH , 0.6%
DH , 1.5% ELC BOILER , 0.2%
ELC BOILER , 0.6% ELC BOILER , 2.1% GAS BOILER , 83.6%
GAS BOILER , 73.1% HP , 0.1%
OIL BOILER , 5.9%
CHP, 14.8%
CHP, 85.1%
NT STORAGE, 4.1% NT STORAGE, 8.4% NT STORAGE, 5.2%
STANDALONE, 2.5% STANDALONE, 0.3% STANDALONE, 3.6%
STAND WATER, 1.5% STAND WATER, 2.2% STAND WATER, 2.4%
0% 10% 20% 30% 40% 50% 60% 70% 80% 90% 100%
2010 2030 2050
BIO BOILER COA BOILER DH ELC BOILER GAS BOILER HP OIL BOILER CHP NT STORAGE STANDALONE STAND WATER
2010 2015 2020 2025 2030 2035 2040 2045 2050
year -2 0 2 4 6 8 10 12 14 16 18 CO 2 emissions (TCO 2 e) 104
[image:22.595.89.492.405.660.2]www.climatexchange.org.uk P a g e | 23
fourth largest producers of CO2, with a mainly steady amount of emissions up to 2050. Other
sectors also contribute on the total emissions, but their share is considerably smaller than the main four CO2 producer sectors.
4.2 Energy efficiency scenarios
In TIMES, energy efficiency measures are mainly implemented by technology substitution, involving switching a process or technology for a more efficient one. Moreover, there are energy conservation technologies modelled in TIMES that would simulate energy efficiency measures. For the case of heating, energy conservation measures could be smart control systems or building envelope technologies, such as loft or wall insulation.
Many types of scenarios can be modelled and analysed in TIMES. Unfortunately, the creation of energy efficiency scenarios is not straightforward: it is not possible just to set a 10% energy efficiency constraint. Therefore, and as described in Section 2, energy efficiency scenarios have been modelled in a variety of ways, the choice among which is likely to affect the outcomes.
In this study, six different energy efficiency scenarios for residential heating are proposed, with the objective of analysing the implications of the chosen modelling approach for TIMES outcomes. All scenarios are modelled with the objective of increasing energy efficiency in residential heating (space heat demand) by 10%, relative to 2010 levels, from 2030 and up to 2050, i.e. reducing the total energy required to meet residential space and water heat demand. So the TIMES model is run for the time horizon covering from 2010 to 2050, but the residential energy constraints only apply from the year 2030 onwards. Note that as the end-service demand is static in TIMES, simulating energy efficiency requires a reduction in the use of energy input in the model (commodities on the left-hand side of Figure 11) to produce the same service (on the right-hand side of the Figure). In TIMES, the reduction in energy use can be achieved by technology changes (see Section 3.1). Other types of changes in energy efficiency (such as those motivated by user behaviour or the wider economy) are not considered here.
The energy efficiency scenarios (for residential heating) are:
• Scenario 1 – the imposition of a constraint on all input fuels.
• Scenario 2 – the imposition of an input fuel constraint on gas alone.
• Scenario 3 – the imposition of a constraint on the production of heat pipe technologies.
• Scenario 4 – the imposition of a minimum energy conservation technology adoption level.
• Scenario 5 – exogenous demand reduction of space heat energy services.
• Scenario 6 – the imposition of a constraint on CO2 emissions.
www.climatexchange.org.uk P a g e | 24
Figure 11. Summary of energy efficiency scenarios for this study.
Note that this study analyses these energy efficiency scenarios in isolation, without
combining any other types of scenarios or changes (whether policy-induced or not). This is done to facilitate comparison between scenarios, so the simulation results can then be entirely attributed to the changes in energy efficiency modelling under consideration (subject to the existing configuration of UKTM).
The technical detail of the energy efficiency scenarios considered in this study can be found in Appendix A.
Heat pipe tech.
…
Gas water boiler
Elc. water boiler
Heat pump
Standalone tech.
…
Elec. dry heater
Elec. shower
Heat pipe (eff. 100%)
Conservation tech.
…
Wall insulation
Loft insulation
Double glazing Gas heater S1
S2
S3 S5
S4
www.climatexchange.org.uk P a g e | 25
5. Results
TIMES produces a very large quantity of results for the whole energy system. For the sake of brevity, only results related to residential heating energy use, technology changes, CO2
emissions and total costs are reviewed here. Appendix B extends the results of these scenarios, including other relevant metrics such as imports, exports, changes in electricity and gas shadow prices (marginal costs), etc.
5.1 Scenario 1 results - input fuels constraint
This section presents the results of scenario 1 (S1), which implements a constraint on total fuel consumption for residential heating from 2030. The input fuels constraint scenario is similar to the one presented by Blesl et al. (2007). In this scenario the maximum total
amount of input energy for residential heating processes (in petajoules ‘PJ’) is set from 2030 onwards to be 10% less than that in the base case at 2010.
By reducing the use of fuels for heating technologies, the effects of this constraint are likely to include more implementation of energy conservation measures than in the base case, which reduce the need for input fuels. Also, the constraint set in this scenario limits the sum of all energy types, so that changes to more efficient technologies are likely to occur. That is, there are likely to be switches to technologies that produce more units of heating services per unit of input energy (e.g. heat pumps), regardless of the fuel type. (See Appendix A.1 for more details on this scenario).
Key results in S1:
• The technology mix for residential heating in 2050 includes gas boilers (54.1%), CHP (32.5%), standalone technologies (11.5%), HP (1.5%) and others (0.5%), which is significantly different from the base scenario (CHP 85.1%, standalone 11.2%, Elc boiler 2.1%, DH 1.5%).
• Energy conservation technology “production”8 is 21.91% larger than the base scenario.
• Residential gas and electricity consumption is reduced and the overall fuel use for heating (accumulated total from 2010 to 2050) is reduced by 4.71% relative to the base scenario.
• The total CO2 emission production is reduced slightly (-0.15%) and the total system cost increases by 0.08%, relative to the base scenario.
Figures 12 and 13 show the heating technology production from 2010 to 2050 for existing and new houses, respectively. In both figures, the results for the base scenario are in solid lines and the results for S1 are in dashed lines. For existing houses, there is an important change in this scenario on the use of gas boilers (blue line with ‘□’ marker in Figure 12) and combined heat and power systems (CHP, dark red lines with ‘△’ marker in Figure 12). It can be seen in Figure 12 that in the base scenario there is a replacement between these two technologies, starting around 2025. However, in S1 the transition between these two technologies stops around year 2035, and gas boilers stay as the main heating technology with CHP remaining as the second most important technology.
8 It may be recalled that ‘energy conservation technology’ is modelled as a source of energy that
www.climatexchange.org.uk P a g e | 26
Figure 12. Production of residential heating technologies in existing houses for the base scenario and S1.
A similar pattern occurs for the heating technologies in new houses (Figure 13). In the base scenario, Gas boilers (blue line with ‘□’ marker) production increases steadily, reaching a peak at 2035. Then gas boiler production is replaced by CHP and, to a lesser degree, with other technologies such as standalone heaters (purple line with ‘◁’ marker) and district heating (dark green line with ‘∗’ marker). In S1, the gas boiler continues on an increasing trend up to 2045, replacing most of the CHP production in the base scenario. Other technologies complement heating production but to a considerably smaller degree.
Figure 13. Production of residential heating technologies in new houses for the base scenario and S1.
2010 2015 2020 2025 2030 2035 2040 2045 2050
year 0 100 200 300 400 500 600 700 800 900 1000 Energy (Pj)
BIO BOILER Base BIO BOILER S1 COA BOILER Base COA BOILER S1 DH HEAT Base DH HEAT S1 ELC BOILER Base ELC BOILER S1 GAS BOILER Base GAS BOILER S1 HP Base HP S1 OIL BOILER Base OIL BOILER S1 STR CHP Base STR CHP S1 NT STOR Base NT STOR S1 STANDALONE Base STANDALONE S1 STAND WATER Base STAND WATER S1
2015 2020 2025 2030 2035 2040 2045 2050
year 0 20 40 60 80 100 120 140 160 180 200 Energy (Pj)
www.climatexchange.org.uk P a g e | 27
Figure 14 shows the share of residential heating technologies in S1 at 2050. These shares are considerably different from those in the base scenario (see Figure 9 left-most column), where CHP exhibited the largest share. S1 presents a wider technology mix, where gas boilers are the main heating technology with 54.1%, and CHP is the second most important technology with 32.5%. Standalone technologies (including night storage and standalone water and space heaters) with 11.5% and heat pumps (HP, 1.5%) complement the heating production.
These figures show interesting changes on technology adoption. CHP is potentially more efficient than the gas boiler, producing more total output in two energy vectors (heat and electricity) from a single energy carrier (gas in this case). However, the implemented constraint applies to heating production only, so the results show that the CHP requires more input to produce heat than the gas boiler (not taking into account the electricity production for other demands).
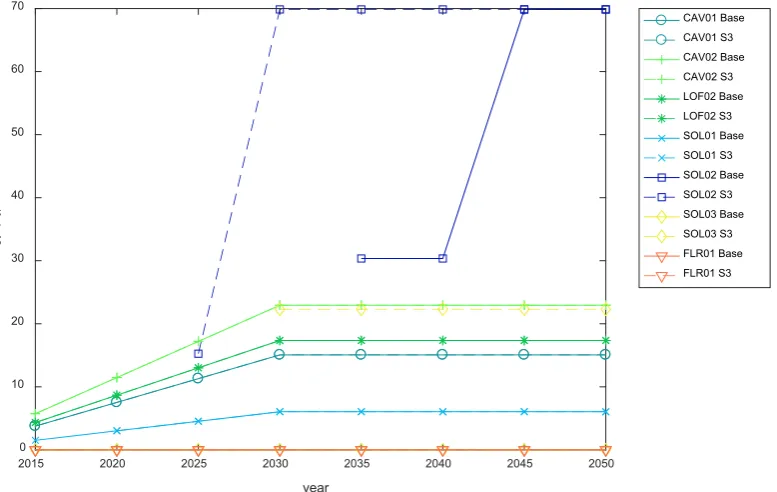
Figure 14. Residential heat production shares by technology type at 2050 – S1. Figure 15 shows energy conservation technologies production from 2010 to 2050. These technologies include different types of cavity wall insulation (CAV), loft insulation (LOF), solid wall insulation (SOL) and floor insulation (FLR). In the base scenario, several energy
conservation technologies, including CAV, LOF and SOL01, increase steadily up to 2030, and then remain constant. SOL02 (a second type of solid wall insulation, solid dark blue line with ‘□’ marker) starts to be implemented in 2035 and reaches a maximum level in 2045. In S1, the CAV, LOF and SOL01 technologies remain unchanged. SOL02 (dashed dark blue line with ‘□’ marker) implementation starts earlier than the base scenario and reaches the same maximum level by 2035. Lastly, SOL03 technology (third type of solid wall insulation, dashed yellow line with ‘♢’ marker) appears in 2045 and increases in 2050. The total energy conservation production in S1 is 21.91% greater than in the base scenario.
Note that the SOL03 technology did not appear in the base scenario. This suggests that other cheaper energy conservation technologies (CAV, LOF, SOL01 and SOL02
technologies) have reached their maximum capacity set in TIMES9. So in order to get extra
9 Most technologies modelled in TIMES present technology adoption constraints that limit the
maximum or minimum capacity and/or production, and the adoption rate. These types of constraints are implemented to replicate to some extent the consumer adoption profiles or supply chain capacity, avoiding dramatic or unrealistic technology shifts (e.g. a 100% change from one technology to another in a single year).
0.0% 0.0% 0.2% 0.3% GAS BOILER ,
54.1%
HP , 1.5% 0.0%
CHP, 32.5% NT STORAGE,
7.0% STANDALONE,
1.4% STAND WATER,
3.1%
www.climatexchange.org.uk P a g e | 28
energy conservation capacity SOL03 is implemented, despite being more expensive than other technologies.
Figure 15. Production of energy conservation technologies for the base scenario and S1.
Figure 16. Fuel use for residential heating for the base scenario and S1.
Figure 16 shows the fuel use for residential heat from 2010 to 2050. Gas use presents the largest reduction in absolute values (orange lines with ‘∗’ marker). The second largest fuel is electricity (light green lines with ‘+’ marker), but the reduction for this fuel is negligible. The use of other fuels such as biomass also change, but their reduction in absolute values is
2015 2020 2025 2030 2035 2040 2045 2050
year
0 10 20 30 40 50 60 70
Energy (Pj)
CAV01 Base CAV01 S1 CAV02 Base CAV02 S1 LOF02 Base LOF02 S1 SOL01 Base SOL01 S1 SOL02 Base SOL02 S1 SOL03 Base SOL03 S1 FLR01 Base FLR01 S1
2010 2015 2020 2025 2030 2035 2040 2045 2050
year
0 500 1000 1500
Energy (Pj)
www.climatexchange.org.uk P a g e | 29
considerably smaller. The total fuel use change in S1 is -4.71% (considering the total sum from 2010 to 2050), most of which relates to gas use.
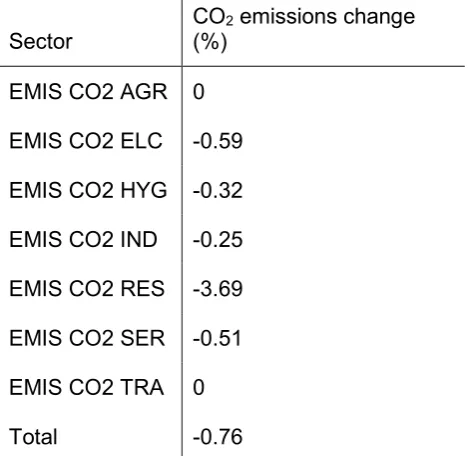
Table 2 shows the cumulative sectoral CO2 emission changes in S1. As expected, the
residential sector presents the largest reduction (-3.69%) caused by the decrease in gas consumption. However, the power sector (ELC) increases its emissions by 2.66%. This increment is caused by the “extra” electricity coming from the distribution network for
residential use, making up for the lower electricity production from the CHP technology (see Figures 12 and 13). Total CO2 emissions are reduced very slightly (-0.15%).
Table 2. Cumulative sectorial CO2 emission changes in S1 relative to base scenario.
Sector CO(%) 2 emissions change EMIS CO2 AGR 0
EMIS CO2 ELC 2.66 EMIS CO2 HYG -0.32 EMIS CO2 IND -0.27 EMIS CO2 RES -3.69 EMIS CO2 SER -0.44 EMIS CO2 TRA 0
Total -0.15
Lastly, the cost increase for S1 in comparison with the base scenario is 0.08%. This is caused by the more constrained problem, making the model invest in more expensive technologies and energy conservation measures. Note that the total cost refers to the whole system costs from 2010 to 2050, so even a very small relative change (e.g. 0.01%) can represent changes of several billion pounds.
5.2 Scenario 2 results - gas input constraint
This section presents the results of scenario 2 (S2), which implements a constraint on gas consumption for residential heating, starting from 2030. S2 is similar to S1, with the
difference that the constraint only applies to the gas energy input for heating, rather than to all energy carriers (see S2 in Figure 11). This scenario is motivated by the heavy reliance on gas for heating in the UK (around 85% in the considered base scenario at 2010, see Figure 7a). Therefore a policy that tries to reduce gas consumption is likely to be easier to
implement than a policy that affects all energy fuels.
Similar to S1, this scenario is likely to produce higher levels of energy conservation
technology implementation and, as this constraint applies only to gas, a greater increase in electricity-based technologies seems likely to occur (see Appendix A.2 for more details on this scenario).
www.climatexchange.org.uk P a g e | 30
• The technology mix for residential heating in 2050 includes CHP (77.2%), standalone technologies (11.5%), electric boilers (7.3%), DH (2.8%) and gas boilers (1.3%). This technology mix is considerably different to the one in S1 (S1: gas boilers 54.1%, CHP 32.5%, standalone 11.5%, HP 1.5% and others 0.5%).
• Energy conservation technology “production” is 23.72% larger than the base scenario.
• The constraint on gas use in this scenario reduces the residential gas consumption, but electricity use increases. The overall fuel use for heating is reduced by 2.92% relative to the base scenario. Most of this reduction is attributed to gas.
• Total CO2 emission production is increased by 0.2% and the total system cost increases by 0.06%, relative to the base scenario. The solution of this scenario seems to be more cost effective than that of S1. However, it increases overall emissions, suggesting that just reducing gas use in the residential sector might not help in achieving CO2 emissions targets, as emissions are transferred to other sectors, especially the hydrogen and electricity sectors.
Figure 17 shows the heating technology production from 2010 to 2050 for existing houses. Once again, the results for the base scenario are represented in solid lines and the results for the current scenario, S2, are in dashed lines. In comparison with S1, the change in the use of gas boilers (dashed blue line with ‘□’ marker) and CHP systems (dashed dark red line lines with ‘△’ marker) is considerably smaller for S2. It can be seen in Figure 17 that the gas boiler and CHP production for S2 follow the same pattern as the base scenario, but with a small decrement in total production (around 2% for gas boilers and less than 1% for CHP), and an increment of around 7% on total production for night storage heaters (pink lines with ‘▷’ marker).
Figure 17. Production of residential heating technologies in existing houses for the base scenario and S2.
2010 2015 2020 2025 2030 2035 2040 2045 2050
year 0 100 200 300 400 500 600 700 800 900 1000 Energy (Pj)