A Case Study of Nepalese Cooperatives
by
Dan B. Karki
A sub-thesis submitted in partial fulfilment of the requirements for the degree of Master
of Agricultural Development Economics in the Australian National University
Except where otherwise indicated, this sub-thesis is my own work.
Dan B. Karki
First of all , I would like to acknowledge my gratitude and
indebtedness to my supervlsor, Dr Dharam Pal Chaudhri of the Development Studies Centre, ANU. Throughout the course of this work he gave
willingly of his valuable time and vast experience, made numerous
suggestions and excellent motivation; without his guidance this piece of work would not have been possible. I am very grateful to Dr D.M.
Etherington and Dr M. Saad of the M.A.D.E. Programme for always encouraging me in my studies. I would like to acknowledge my thanks to the
Agricultural Development Bank, Nepal (the Chairman, General Manager and Deputy General Manager) for nominating me and providing me with leave for this award to carry out my studies at ANU.
Data required for this thesis were kindly made available by the Research and Planning Division of the ADB/N.
to all my friends in that division.
My heartfelt thanks goes
I express my Slncere thanks to the Australian Government through the Australian Development AssistarceBureau for glvlng me a financial award to conduct my study.
Thanks to Mrs Bridget Boucher who tirelessly corrected my English throughout the period; even if she was very busy in her own work she
always kept open her door for me. I am also grateful to the staff of the Computer Centre for their help with computer prograrnrnlng and to Mrs Daphne
Boucher who typed the final draft.
Indra Basnet who agreed to take over my family burden while I was away for study; to my friends Saroj Gyawali and Ambika who always encouraged me and insisted on me working hard; and to all my other friends and relatives who have directly or indirectly helped me to complete this study, and made my stay in Australia so happy.
All errors and shortcomings ln this study are due to my own faults , and are therefore so~ely my own responsibility.
Cooperatives in rural Nepal originated in recent years, after the enactment of the Cooperative Society Act 1959, to enable the member farmers to have access to credit, goods and inputs to improve their pro-ductive capacity and level-of living.
These cooperatives have been operating under different names such as Primary Agricultural Cooperative Society, Supervised Multipurpose Cooperative Society and Sajha Society. Sajha is the Nepalese word for cooperative, and lS used in this study to denote those cooperatives introduced since May, 1976 under the Sajha Program, In 30 selected districts of the country as a part of the Rural Development Program to provide access to credit, agricultural input supply, marketing outlay and banking facility in rural areas.
The main objective of this study is to evaluate the performance of the Sajha Program; a number of indicators have been devised and have been statistically tested according to the hypotheses proposed for the study. Non-parametric (sign test and chi-square test) and parametric
(paired t-test and analysis of variance) techniques have been used to analyse the performance of the Sajha.
But the Sajhas In the Hills are as efficient as those of the Plains ln conducting all their business operations. The larger farmers have
benefited more from the Sajha credit, their representation in the Advisory Committee is greater and default rates among them are higher than those of small farmers.
Sajhas are appropriate tools for rural credit as an institution but a larger share of the benefits has gone to the larger farmers. If the small farmers are to benefit from Sajha credit, a larger percentage
of agricultural lending should be allocated to these groups. Representation from these groups should be included in the decision making body.
The terms and conditions of present lending procedures should be suitably modified. Loan collection in kind marketing through the
Sajha with storage facilities, making Sajha free from Panchayat politics, higher interest rates for rural savlngs with banking facilities, continuous education to members and higher incentives to the staff seem to be
ACKNOWLEDGEMENTS
ABSTRACT
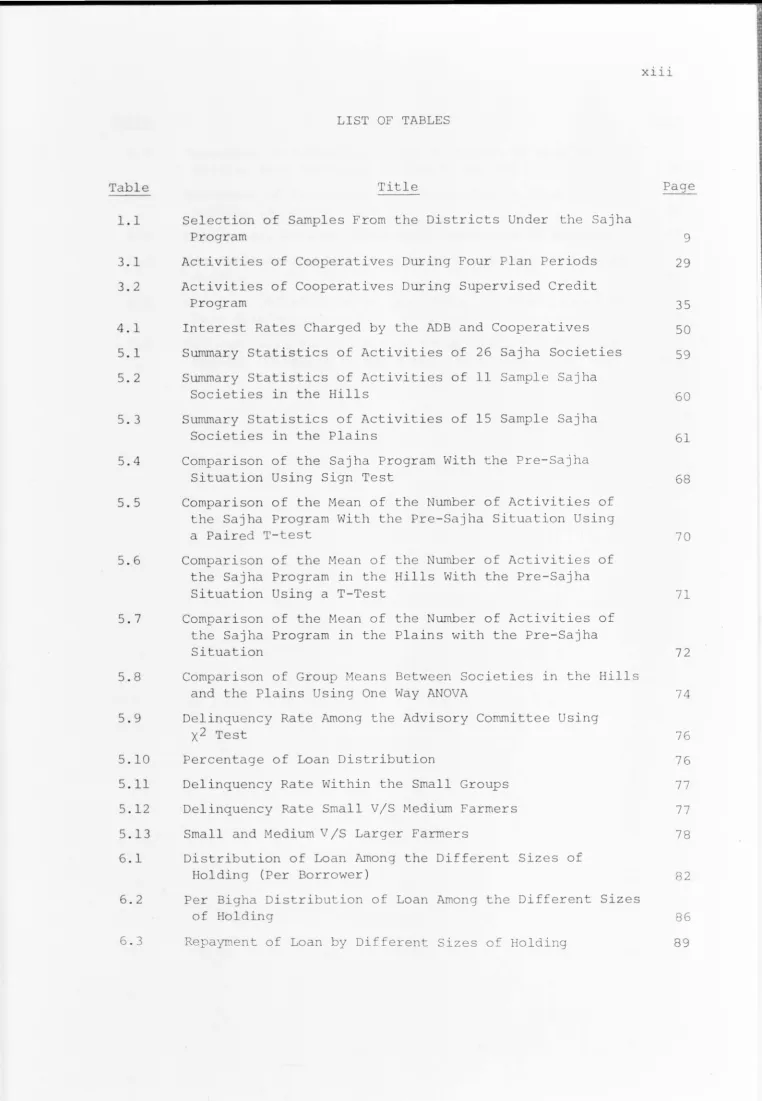
LIST OF TABLES
LIST OF FIGURES
LIST OF APPENDICES
GLOSSARY OF ABBREVIATIONS
CHAPTER
1
2
INTRODUCTION, OBJECTIVES AND THE PROBLEMS 1.1
1.2 1. 3 1.4
The Aim of the Study The Problems
Hypotheses
Measuring Efficiency 1.4.1 Membership 1.4.2
1.4.3
Area and Household Coverage Share Capital
1. 4.4 Loan Outstanding 1. 4.5 Overdues
1. 4. 6 Financial Turnover 1.4.7 Profit and Loss 1.5 The Data and Its Source
1.5.1 Data Source
1 .5.2 The Data and Its Limitation 1.6 Organization of the Study
STATISTICAL MEASURES OF EFFICIENCY 2.1 Technique of Analysis
2.1.1 Non-parametric Tests 2.1. 2 The Sign Test
2.1.3 The ~est Procedure 2.1.4 The Hypotheses
3
2.1.5 Limitation of the Sign Test 2.2 Chi-square Test
2.2.1 Test Procedures 2.3 Simple Parametric Tests
2.3.1 Comparison of the Sample Means 2.3.2 The Test
2.4 Analysis of Variance
2.4.1 Comparison of Sajhas Between the Hills and
14 14 14 16 16 17 17
the Plains 17
2.4.2 The Test 18
2.4.3 Interpretation 20
2.5 Coefficient of Variation
2.6 Summary
COOPERATIVES IN NEPALESE AGRICULTURE 3.1 Cooperative Defined
3.2
3.3
3.1.1 The Concept of the Cooperative Movement 3.1.2 Definition of Cooperative Principles
3.1.3 Cooperatives for Agricultural Development Ideology of the Cooperative Movement
3.2.1 The Cooperative Enterprise School 3.2.2 The Cooperative Commonwealth School 3.2 .3 The Socialist Cooperative School Agricultural Cooperatives In the Nepalese 3.3.1 Credit System
3.3.2 History of Cooperation In Nepalese Agriculture
Economy
3.3.3 The Modern Cooperative Movement in Nepal
20 21 22 22 22 23 23 24 24 24 25 25 25 26 27
3.4 The Cooperative Movement During Four Plan Periods 29 3.4.1 The First Plan 1956-1961
3.4.2 The Second Plan 1962-1965 3.4.3 The Third Plan 1966-1970
3.4.4 The Fourth Plan 1971-1975 - Supervised Credit Program
3.4.5 Organization and Operation of Supervised Cooperatives
3.4.6 Operational Procedures
3.4.7 Achievements of Supervised Cooperative Program
3.5 The Fifth Plan and the Sajha Program 3.5.1 Organization of the Sajha Program 3.5.2 The District Level Organization
3.5.3 The Central Sajha Development Committee 3.6 Sununary
34 34 36 37 41 41 4 THE ROLE OF THE COOPERATIVE SYSTEM IN NEPALESE
AGRICULTURE 43
5
4.1 The Demand for Agricultural Credit Services 4.1.1 Purpose of Borrowing
4.1.2 Supply of Agricultural Inputs
4.1. 3 The Commission Rate and its Payments 4.1.4 Marketing
43 43 44 45 46 4.2 Institutional Relationship for Cooperative Credit 46
4.2.1 Supervision of Loans 4.2.2 Accounts Auditing 4.3 Terms and Conditions
4.3.1 Interest Rates 4.4 · Institutional Supports
4.4.1 Agricultural Extension Service at Present 51 4.4.2 District Coordinating Committee 52
4.4 . 3 The Implementation Team 52
4.4.4 Education of Cooperative Members 53
4.4.5 Present Arrangements 54
4.5 The Supply of Cooperative Credit 4.5.1 Rural Savings
4.5.2 Urban Savings
4.5.3 Banking Facilities 4.6 Summary
SAJHA EFFICIENCY INDICATORS: STATISTICAL RESULTS 5.1 The Sample
5.1.1 Change ln Area Coverage
-6
7
8
5. 2
5.1.2 Change ln Household Coverage 5.1.3 Change ln Membership
5.1.4 Change ln Share Capital
5.1.5 Change ln Loan Outstanding and Delinquency 5.1.6 Change ln Financial Turnover
5.1.7 Change ln Profit and Losses
Comparison of the Sajha Program with the Pre-Sajha Situation
5.2.1 The Comparison of Means of the Number of Activities
5.3 Comparison of the Activities Between the Sajhas ln
62 63 63 64 65 66 66 67
the Hills and the Plains 73
5.4 Repayment and Delinquency Among the Committee Members
5. 5 Summary
SAJHA CREDIT AND THE SMALL FARMERS
6.1 Farm Size and the Distribution of Loan
6.1.1 Distribution of Loan on Different Sizes of
73 75
79
79
Holding 80
6.1.2 Credit Needs and Farm Size 81
6.1.3 Distribution of Loan per Unit Area 85
6.1.4 Repayment of Loans and Farm Size 88
6.1.5 Non-repayment and the Farm Size 92
6. 2 Summary
WORKING OF THE SAJHA PROGRAM: SOME OPINIONS
7.1 Working of the Sajha Program: Opinions on Operational Procedures
7.1.1 Attitudes of the Member Farmers Towards the Sajhas
7.2 Attitudes of Non-Borrowers Towards the Sajhas
7.3 Managerial Experience and the Sajha Program
7.4 Summary
SUMMARY AND CONCLUSIONS
8.1 The Sajha Program
8.2 8. 3
8.4
APPENDICES BIBLIOGRAPHY
Performance of the Sajha Program
Statistical Results a . Area Coverage b. Membership c . Share Capital
d. Lending and Delinquency
e . Financial Turnover
f . Profit and Losses
Conclusion and Policy Implications
*
* *
120
121
122
122
122
122
123
123
J-26
129
Table Title
1.1 Selection of Samples From the Districts Under the Sajha
3.1 3. 2
4.1 5.1 5. 2
5. 3
5
.
4
5. 5
5. 6
Program
Activities of Cooperatives During Four Plan Periods Activities of Cooperatives During Supervised Credit
Program
Interest Rates Charged by the ADB and Cooperatives
Summary Stati stics of Activities of 26 Sajha Societies Summary Statistics of Activities of 11 Sample Sajha
Societies in the Hills
Summary Statistics of Activities of 15 Sample Sajha Societies In the Plains
Comparison of the Sajha Program With the Pre-Sajha Situation Using Sign Test
Comparison of the Mean of the Number of Activities of the Sajha Program With the Pre-Sajha Situation Using a Paired T-test
Comparison of the Mean of the Number of Activities of the Sajha Program in the Hills With the Pre-Sajha Situation Using aT-Test
5. 7 Comparison of the Mean of the Number of Activities of
5.8
5.9
5.10 5.11 5.12 5.13 6.1
6. 2
6.3
the Sajha Program in the Plains with the Pre-Sajha Situation
Comparison of Group Means Between Societies In the Hills and the Plains Using One Way AN OVA
Delinquency Rate Among the Advisory Committee Using X2 Test
Percentage of Loan Distribution
Delinquency Rate within the Small Groups Delinquency Rate Small VIS Medium Farmers Small and Medium VIS Larger Farmers
Distribution of Loan Among the Different Sizes of Holding (Per Borrower)
Per Bigha Distribution of Loan Among the Different Sizes of Holding
Repayment of Loan by Different Sizes of Holding
[image:13.824.38.800.0.1101.2]6.4
6. 5
6.6 6.7
6.8
6.9
Repayment of Production Loans According to Size of Holding (Per Borrower) in Sample Society
Repayment of Investment Loan According to Size of Holding in Sample Society
Delinquency of Loan Among Different Sizes of Holding Per Bigha Delinquency of Loan Among Different Sizes of
Holding
Per Cent Distribution of Loan Among Different Sizes of Farm Holding
Per Cent Delinquency of Loan Among Different Sizes of Holding by Region in the Sample Societies
91
91 93
96
99
Figure
3.1
Title
Integration of Services From Various Institutions Under the Sajha Program
3. 2 Flow of Services From Different Agencies to Cooperatives
6.1
6.2
6. 3
6.4
6. 5
6. 6
6.7
6 .8
6. 9
6.10
6.11
7.1
7.2
7. 3
7
.
4
and Farmers
Distribution of Loan Among Different Sizes of Farm Holding In the Sample, 1978
Distribution of Loan per Unit Area Among Different Sizes of Farm Holding in the Sample, 1978
Repayment of Loan From Different Sizes of Farm Holding (in the Sample) ,1978
Delinquency of Loan Among Different Sizes of Farm Holding
Delinquency of Loan per Unit Area per Borrower Among Different Sizes of Farm Holding
Per Cent Distribution of Total Loan per Society Among Different Sizes of Farm Holding
Per Cent Distribution of Total Loan per Society Among Different Sizes of Farm Holding In the Hills
Per Cent Distribution of Total Loan per Society Among Different Sizes of Farm Holding In the Plains
Per Cent Delinquency of Loan Among Different Sizes of Farm Holding
Per Cent Delinquency of Loan Among Different Sizes of Farm Holding in the Hills
Per Cent Delinquency of Loan Among Different Sizes of Farm Holding in the Plains
Attitude of Members Towards the Sajha
Attitudes of Non- Borrowers Towards the Sajha
Experience of Sajha Managers and the Sajha
Experience of Sajha Managers and the Sajha
Page 39 40 83 87 90 94 97 100 101 102 104
105
106
108
I I I
114
Appendix 1
2
3
4
Title Questionnaire
Coupon
Map Showing the Location of the Primary Sub-Branch Offices of the Agricultural Development Bank
Definition of Terms
Page
129 143
AC AEO AES ADB ADO AIC ALO AS Bin COO
Coeff.Var.
Coop. CR DADO DCC DCO 010 DL EAPD FAO FTO GOP Ha HHC HMG HYV IADP
IBRD
JT
JTA
Kg
LF
Area Coverage
Agricultural Extension Office, Nepal
Agricultural Extension Service
Agricultural Development Bank, Nepal
Agricultural Development Office,
Agricultural Inputs Corporation,
Assistant Loan Officer
Animal Science
Binomial Distribution
Chief District Officer
Coefficient of Variation
Cooperative
Critical Region
Nepal
Nepal
District Agricultural Development Officer
District Coordinating Committee
District Cooperative Office, Nepal
District Irrigation Office
Delinquent Loan
Economic Analysis and .Planning Division
Food and Agriculture Organization
Financial Turnover
Gross Domestic Product
Hectare
Household Coverage
His Majesty's Government, Nepal
High Yielding Varieties
,
Intensive Agricultural Development Program
International Bank for Rural Development
Junior Technician
Junior Technical Assistant
Kilogram
M
MF
MT MVP NDL No. NRs SC SD SF 2
X
Mean
Medium Farmers Medium Term Loan
Marginal Value Product Non-delinquent Loan Number
Nepalese Rupees Share Capital
Standard Deviation Small Farmer
Chi-square
Conversions
1 Bigha
=
0.67 hectares1 hectare = 1.6 Bighas(approx.) 1 Ropani = 0.052 hectares
Exchange Rate 1978-79
1.1 The Aim of the Study
The main aim of this study is to determine the performance of Sajha (Cooperative) societiesl under the Sajha Program which was intro-duced on May 6, 1976 in 30 selected districts under the management of the Agricultural Development Bank of Nepal (ADB/N). The study is based on a comparison of two periods, 1975 being the base year (before the program)
and an average of the two years 1976 and 1977 (after the program).
The study also examines in retrospect the performance of the
co-operative movement In Nepal. Measuring rods for evaluating the
per-formance of the Sajha Societies are developed to test the proposed
hypotheses regarding the efficiency of the cooperatives. 1.2 The Problems
This study particularly seeks to assess the performance of the Sajha Program which has been in operation since 1976. This study tries to identify the performance constraints in various activities along with
the credit function of cooperative societies and the management aspects
which determine their economic viability and efficiency.
Activity comparisons are made among the Sajhas in different
regions (Hills/Plains) and their potential for performing various credit functions and the reasons for activity variation In different lines of business are examined.
1 Sajha is the Nepalese word for cooperative. However, in this study,
This study may provide a benchmark, against which measures of change can be undertaken in future.
1.3 Hypotheses
The maln hypotheses that are examined in this study are: a. the introduction of the supervised Sajha Program
has improved the functions of the Sajha Societies;
b. improved functioning has led to a greater use of credit, profitability and financial turnover of the societies;
c. Sajhas in different regions (Hills/Plains) with
different lines of activities differ In their efficiency due to:
(1) an uneven rate of growth; and
(2) large and uneconomic infrastructure.
d. the dominance of larger (wealthier) and influential members in the advisory committee has Lenefitted them more than the average members; and
e. default rates are higher among these dominant groups than the average farmers within the
committee. 1.4 Measuring Efficiency
The efficiency measures developed in this study of Sajha Societies
refer to the strategies of the program in financing the combination of
imput factors and service facilities to the farmers, to yield returns
are optimal for the cooperative activities, but these decisions are only
to be made if there exists a clear system of targets or aims. The
efficiency of an organization system can be defined as the extent to which
its target has been attained (Dulfer 1974).
The objectives of the Sajha Program are to provide benefits to
the medium and small farmers with credit services, input supplies and
marketing facilities and to create capital through savings and share capital
to finance the agricultural sector through the cooperatives.
The efficiency of the Sajhas is judged principally by their
servlces to the member farmers. In order to measure the performance of
the Sajha Program the following indicators have been proposed as efficiency
indicators: membership, area and household coverage, share capital, loan
outstanding, overdues, financial turnover, and profit and loss.
1.4.1 Membership
In the present situation of Nepal , the economic efficiency of the
cooperative organization depends upon the scale of operation. The scale
of operation determines the economic viability and the efficiency of
business operations. The scale of operation is a function of the number
of member clients, and the type and quality of services provided by the
society. An lncrease in the number of members causes an increase in share
capital which lS an indicator of the active participation of the farmers
In the program. This greater share capital allows an increase in business
activity, resulting In an increase in the income of the society through the
higher volume of business. Membership varies with the type of society,
the area coverage and the range of business activities undertaken by the
society, and also according to the policy within the legal framework of
from being members who own more than 10 Bighasl (6.7 ha) of. land. Non farmers are ineligible. An increase in membership can also take place with the amalgamation of existing non-viable cooperatives into viable units . At least one member from each household is expected to join the Sajha if the Sajha services are to be provided to the entire farm
population. An increase in membership is also expected with an increase In household coverage in the farm population . Therefore membership can be considered one of the necessary but not sufficient conditions for the growth of the society.
1.4.2 Area and Househol£ ~overage
Area coverage is influenced by the type of society (single/multi-purpose) and the existing policy of a country. All the Sajhas are multi-purpose in function and cover a large area depending upon the distance to the headquarters. However, government policy is to cover not more than
2
two Panchayats under one society. If the society covers a larger area of operation, membership may be increased but the quality of serVlces pro-vided by the society tends to be poor and Vlce versa.
In the Sajha Program, emphasis has been placed on benefitting small and medium farmers; physical coverage of area (Panchayats) has no significance if the Sajha is not active in providing new loans and other services to the member farmers. The most effective coverage is to render its services to all the households. One feature of the Sajha Program is that all individuals who contributed to the compulsory savings during the land reform program (1963-1966) have been enrolled as members without any restriction on the size of their holding. In spite of this, the services of the Sajhas may not have reached more than a limited number of households.
1 1 Bigha = 0.67 hectares. This restriction did not apply to those who contributed to compulsory savings during the land reform program of
1963-66.
Therefore a reduction in the area of operation and an lncrease In household 1
coverage have been selected among t he criteria for assessing the performance of the Sajha Program in this study.
1.4. 3 Share Capital
Principally share capital lS the maln source of finance to the cooperatives. The Cooperative Act provides that no member can hold more
than 1/ 5 of the total share capital except the government. The government
can relax these ceilings depending upon the financial situation of the 2
society. The value of one share is Rs 50.00 payable in five instalments.
In the Sajha Program all the compulsory savings collect ed during the land reform program have been transferred into the share capital of the societies concerned. A drastic increase in share capital lS expected. 3 Three
principle means of increasing share capital have been adopted in Nepalese cooperatives:
a . government contribution to share capital;
b. l inking share holding to borrowing; and
c. encouraging the collection of share capi tal from members through motivation.
Except for a subsidy in the salaries of the cooperative managers, the
Government of Nepal has not contributed to the share capital of agricultural societies.
Borrowings are linked with the purchase of shares. Farmer s
seeking credit services through the cooperatives must purchase at l east one share of Rs 50. 00; they may be given an option to pay In five instalments.
The contributors to the compulsory savings need not buy a new shar e if the
1 The Sajha Program aims to cover all the households under the Sajha in its area of operation. In the pre-Sajha situation the Cooperative Soci ety had t o cover many Panchayat s. The strategy adopted under the new Program i s to cover less area with more households , so as to provide
bett er services to the member farmer s . This i s to be achieved by a
r educt ion in the area coverage and an increase in the household coverage. 2 Cooperative Societ y Act 1959 .
US$l
=
NRs 12. 5. Throughout t his thesi s Rs r efers to Nepal ese Rupees. 3 The total amount of compulsory savings so far col lected throughout the1.4.4 Loan Outstanding
The volume of loan outstanding indicates the efficiency of the
credit function of the society. The Sajha usually extends short term
(6-18 month) loans for the production of cereal grains and cash crops (rice,
wheat, maize and jute, sugar cane, tobacco, oilseed, cardamon and ginger),
and medium term loans maturing at 2-3 years (for livestock, bullocks,
sprayers, small implements, construction of barns and retting ponds) .
The demand for short term credit depends upon the stage of
agricultural development and the types of crop grown in the area of
operation. If the farmers are producing at subsistence level along
traditional lines, the requirement for loan is expected to be less than In
areas where farmers are making use of improved methods of cultivation;
this is reflected in a hi gher rate of loan outstanding (M.S. 1970) . The limiting factor on the supply side lS the rate of interest charged, the
availability of inputs on time, the source of funds (share capital and
borrowings) and government policy towards agriculture. In societies
where agricultural infrastructure (marketing outlays, extension serVlces,
etc .) is well developed, a higher participation rate is anticipated, and
consequently a higher rate of outstanding loans per member. Active
par-ticipation is linked to a higher turnover indicating that the services of
the society are effective.
The volume of loan also depends upon the terms and conditions of
loans. Short term loans are generally advanced against standing crops
while medi um term loans ar e gr anted agai nst tangible security. Most of
1 The rural savings progr am was compulsory to al l cul t ivators, despite thei r size of holdings . Al l the farmers con ribut ing to compul sory savings in
the Panchayats are member s including t he ol d members. However, the increa~
in member ship per Sajha Society was 228 members of a t otal of 519 member s
per Sajha Soci et y.
3 (Cont 'd)
The r eport f rom ADB shows t hat approximately Rs 60 million have been
transferred i nto the shar e capi tal of the Sajha Societi es . The increase
of share capi tal per society i n the sample was found t o be Rs 115,700.
On the basi s of t hi s aver age , t he total share capital amounted to
the medium term loans are not within the reach of the small farmers due to restrictions on the amount and type of their security. The credit limits per unit area are worked out on the basis of recommended doses of inputs, and
labour charges according to the requirements of the farmers at the existing local price. Credit lS extended both in cash and kind. Labour charges and purchase of draft animals are extended in cash while inputs are in kind.
1.4.5 Overdues
The efficiency of the Sajha can also be measured through non repayments on time. When a society's level of overdues are high the
institution can no longer render effective services, because the members are violating the rules of cooperative principles. The overdue position has been viewed as the proportion of non repayment (on time) to the total loan outstanding at the end of the fiscal year.
1.4.6 Financial Turnover
Besides providing credit to members, financial turnover refers to the buying and selling of production factors, consumer goods and the
marketing of agricultural produce. Lending operations in Nepal are seasonal so the Sajha has to conduct other business activities to cover its costs while rendering services to the members. Depending upon the agricultural infrastructure and storage facilities the financial turnover per society can be high or low in a glven year. The financial turnover determines the effective demand for the cooperative serVlces. Sajhas having a higher financial turnover can earn more income to survive In the long run than Sajhas having a lower financial turnover. This again
1.4. 7 Profit and Loss
One of the measures of viability of a Sajha is its net profit
over the year, although profit making lS not one of the objectives of the
cooperative principle; its motivation lS towards serVlces to the members.
If the societies are to surVlve In the long run they must operate at least
at the break-even point (where expenses equal income). Profit alone does
not indicate cooperative efficiency.
None of the above indicators In isolation indicates cooperative
1
efficiency but a combination of them should indicate the performance of
the Sajha Program for evaluation purposes.
1.5 The Data and its Source
The analysis in this thesis is conducted with the objective of
evaluating the performance of the Sajha Program after two years of
imple-2
mentation. A sample of 30 cooperatives have been selected and stratified,
11 representing the Hills , 15 from the Plains and 4 Unions performing only
supply functions in the Plains. The sample covers 58% of the area under
the Sajha Program and 5.5% of the total Sajhas in the 30 selected districts.
A copy of the survey questionnaire used in this study is attached in
Appendix 1.
The stratified sample represents 10 Sajhas from the Eastern reglon,
11 from the Central and 9 from the Far Western reglon covering 8 zones and
14 districts, as presented in Table 1.1.
1. 5.1 Data Source
Records and documents In the Sajha Societies (as prescribed by the
ADB and Cooperative Department), periodic reports, and audit reports
1 No weightage has been placed on any individual indicator, however, as
this study i s concerned with credit, priority has been given to the
distribu ion of credit, and the profit indicator has least preference,
because the cooperative principle as such is not motivated towards profit making.
2 Ori ginally the survey was planned by the Agricultural Development Bank
of Nepal . However, the project was abandoned after data collection.
TABLE 1.1
SELECTION OF SAMPLES FROM THE DISTRICTS
UNDER THE SAJHA PROGRAM
Districts Districts Number Selected
Region Zones
Under of
(Political)
Sajha Cooper- Zone Districts No of
atives Coop.
Eastern 3 16 7 132 3 4 10
Central 3 19 11 219 3 5 11
Western 3 23 6 105
Far Western 5 17 6 87 2 5 9
Total 14 75 30 543 8 14 30
Source: Research and Planning Division ADB/N, 1978.
approved by the registrar were used as well as loan records from the
district level, ADB branches and sub-branches and records from the district
level cooperative office.
A questionnaire was developed In the central office of the ADB and
tested. The final survey was carried out in the field and was conducted
by the officer level staff of the ADB.
1.5.2 The Data and its Limitations
The data under study is not a time serles as i t covers only a
three year period which may not be representative enough to evaluate the
program. But the sample covers 5.5% of the total Sajhas and covers more
or less the entire country, so i t should give some indication of the
efficiency measures of the Sajhas' performance.
1.6 Organization of the Study
This study is presented In eight chapters. The first is a general
[image:27.816.19.786.43.1118.2]limitations of the data and the efficiency indicators. The second chapter
deals with the statistical measures of efficiency stating the techniques of analysis and their applicability to the hypotheses.
Chapter 3 deals with cooperative principles and their relevance to Nepalese cooperatives followed by operational procedures and the
organizational structure of the Sajhas.
Chapter 4 looks at the role of the cooperative system in Nepalese agriculture, the aspects of demand and suppl y of credit from institutional sources and terms and conditions.
Chapter 5 expl ains the Sajha efficiency indicators and the details of the statistical results. Chapter 6 examines Sajha credit and farm size looking at the distributi on of loan on different sizes of farm holding,
repayments and overdue aspects.
Chapter 7 analyses the working of the Sajhas, the oplnlons and experiences of borrowing members, non borrowers and the Sajha employees.
CHAPTER 2
STATISTICAL MEASURES OF EFFICIENCY
This chapter provides details of the statistical measures adopted for studying the performance of the Sajha Program.
As mentioned in Chapter 1, the main objective of the Sajha Program is to increase the availability of credit for improved farming practices especially to small and medium farmers.
2.1 Techniques of Analysis
Basically nonparametric techniques have been used to analyse the performance of the Sajha Program at the first stage of analysis. This will indicate whether or not a change has occurred in the post-Sajha situation compared to pre-Sajha. Then the magnitude of change has been determined using a parametric technique to compare the means of the Sajha Program with pre-Sajha conditions. Differences in the kinds of activity undertaken by
the Sajhas located in the Hills and those in the Plains have been determined by group mean comparison using analysis of variance.
2.1.1 Nonparametric Tests
The first two hypotheses (as indicated in Section 1.3) that ' the
introduction of the Supervised Sajha Program has improved the credit function of the Sajha Societies'; and that 'improved functioning has led to greater
use of credit, profitability and the financial turnover of the Sajha
Societies', are examined using the sign test. The sign test has been chosen for the following two reasons: (i) the study uses ordinal measures
slgns rather than quantitative measures; and (ii) the study wishes to establish that these two conditions (before and after) are different without making any assumption about the form of distribution in their activities (performance).
2.1.2 The Sign Test
The observations of performance indicators (as discussed in Section
1.4) for 26 multipurpose Sajhas and 4 district unions have been taken
in-dependently. The regional variability in their performance is assumed to
exist due to an uneven rate of growth, large and uneconomlC infrastructure and management factors. But again these can be assumed to be normally
distributed; some Sajhas have a larger volume of transactions, and some are
poor in all their operations, but when an average of the performance of each Sajha is taken, conceptually i t has the same effect as standardization
within a glven period of the year under consideration.
2.1.3 The Test Procedure (for details see Sidney Siegel 1956,
p .68-75)
then,
P (~X.)
l
T - Bin(n,p) n P (Z:SXi + .5-2)
~ ~
/npq
a. 2
n
P(Z~~-l
+
.5-2) a.=
=/npq n ~-l + .5-2
/npq
a.
=
2
2
h
=
n-
£
where, np = mean
npq = standard deviation
q = (l-p)
P = probability of improvement In the functions (activities)
where,
of the Sajha = .5
= .025 (for two tailed probabi l i ty)
= -1.96 from the binomial distribution table T = number of observed + s
X. = activities of the Sajha
l
£
= lower limit of CRh = upper limit of CR
CR = critical region, l.e., region of rejection.
2.1.4 The Hypotheses
Ho; P (XA. >XB. ) = P (XA. <XB . ) = . 5
l l l l
HI; P (XA. >XB. )
:I
P (XB. <XA. )l l l l
XA. = "Activities of the Sajhas after the Program
l
XB. = Activities of the Sajhas before the Program l
The direction of the difference has been made by noting the slgns (plus or
minus) and the matched palrs have been dropped from the number of observations.
An increase In the activities of the Sajha has an equal chance of
occurring as a decrease in their activities to the binomial distribution of
p=.5, hence the test lS two tailed (XA.>XB. = .5 and XA.<XB = .5).
l l l i
The extreme values from CR are accepted so the region of rejection
2.1.5 Limitation of the Sign Test
The sign test is the mildest test among the statistical measures,
since we are asslgnlng only signs (+ or -) to the performance of the Sajha
despite the existence of a nominal change or a large change. We can not
be sure of its significance even if the results are positive.
2.2 Chi-square Test
The last two hypotheses (as indicated in Section 1.3) namely that
'the larger and more influential members of the advisor y committee.
have been benefitted more than the smaller and medium farmers', and that
' the default rates are higher among the dominant groups than the smaller
and medium farmers', are studied using the Chi-square test.
In the Sajha Program no special election is held for the Advisory
Committee Board, which is the decision making body for the day to day
operation of the Sajha. All the members of the local Panchayaty Politics
are ex-officio members of the Advisory Committee.
2. 2.1 Test Procedures
The loans outstanding against members of the Advisory Committee
have been classified as nondelinquent and delinquent (overdue). Members
of the Advisory Committee have been further categorised into three groups
according to the size of their holdings as a basis for distinguishing small,
1
medium and larger farmers. The category of the holdings is 0-4 Bighas2,
4-10 Bighas and above 10 Bighas , t o define small , medium and larger farmers
respectively.
1 Throughout the study the size of the holdings has been classified as
0-2 Bigha 2-4 Bigha 4-10 Bigha and above 10 Bigha but in this analysis
0-2 Bigha and 2-4 Bigha have been combined to 0-4 Bigha and the other two are analysed as such to define small, medium and larger farmers.
The total number of advisory committee members recorded in the 30 sample societies was 90, out of which 36 are large and the rest are medium and small having the size of their farm holdings less than 10 Bighas.
2.2.2 The Test (Sidney Siegel 1956)
k 2
2 r O lJ ..
-
E .. lJ) X = L: L: (E .. i=l j=l lJ
RxC E .. =
lJ N
2 2
(r-l) (c-l)
CR is X >X 1j (ex) = .05
u
=where, 0.. = Observed amount of delinquent and nondelinquent loans lJ
1 'f' d ' h .th h .th 1 c aSSl le In t e l row of t e J co umn.
E .. = Expected amount of delinquent and nondelinquent loans lJ
.th
of the .th column.
In l row J
r k
L: L: = Sum of all rows (r) and all columns (k) . i=l j=l
R = Row total.
C = Column total.
N = Grand total.
= Degrees of freedom.
ex = CI l evel.
A Chi-square test has been conducted to determine the significant difference between the groups of members on default rates who are hence violating the cooperative principles.
2. 3 Simple Parametric Tests
To overcome the magnitude of change in the performance of the
Sajhas, two parametric tests, namely paired t-test and the analysis of
variance, have been used to determine the significance of the activities. The data has been arranged pairwise (before and after), and a comparison
of means has been conducted uSlng the t-test (also known as the correlated
t-test) for equality and inequality of the means.
The main interest of this study is to evaluate the difference in
an activity between the post-Sajha and pre-Sajha situations and to establish
a statistical significance between two periods.
2. 3.1 Comparison of the Sample Means (For details see, Nie, Hull, Jenkins, Karin and Bent 1975, pp.268-70)
The study wishes to show that the mean of the number of activities
of the Sajhas after the Program is larger than the pre-Sajha means. The
group means are the basis of comparison which have been estimated by the
sample means, so the direction of the test is one tailed. The two tailed
probability has been divided by two to convert i t to one tailed (Nie, Hull
et al 1975) . occurred.
Hypothesis;
A negative sign is expected for t-values if an increase has
Ho; ~l ~2
HI·
11 > 11' ~l ~2
where, ~l = mean of number of activities of the Sajhas after the
program.
~2 = mean of number of activities of the Sajhas before the
where,
2.3.2 The Test
Sp -di
-td Xl -X 2 -Sd n l n 2 2 S2 2 2
Sp
=
(nl-l) Sl + (n2-l)S2
-
-
-di
=
X -X 1 2- Xl _X2
td
=
( ) with tnl +n2 -2 d.f.
-Sd
-
I
2 22l:xl x2 Sd
=
Sl+S2-n-l / n
2 1 - 2
S
=
l: (x. -x)n-l l
-
-X
l _X2
/
Ho -2t
=
-
tnl +n2 Sp/l 1
-
+
n
l n2
CR
is
T>tn +n -2 (a)1 2
=
Pooled estimate of t.=
Mean difference.=
t value of the difference.=
Mean of number of activities before the=
Mean of number of activities after the=
Standard deviation of the difference.=
Number of Sajhas before the Program.=
Number of Sajhas after the Program.=
Standard deviation.2.4 Analysis of Variance
Program.
Program.
2.4.1 Comparison of Sajhas Between the Hills and the Plains
The third hypothesis proposed in Section 1.3 is that 'the Sajha
Societies in different regions (Hills/Plains) with different lines of
activities differ in their efficiency due to: (i) uneven rate of growth;
An analysis of varlance technique has been conducted for eleven
societies in the Hi lls and fifteen societies in the Plains. The activities
~ave been computed by subtracting the performance of the pre-Sajha from the
post- Sajha situation.
The group mean of the number of activities is the basis of
comparlson. The actual testing has been done by computing the F-ratio
(between-group mean square/within-group mean square). The test is
particul arly sel ected t o det ermine whether or not the mean of the activities
of the Sajhas in the Hills di ffers signi ficantly from the mean of the
activities of the Sajhas i n the Plains.
2.4.2 The Test
Y.
=
~+
a.+
e . l=
1,2, ... ,26lJ J lJ
J
=
1,2l: . n . ~ .
=
JJ J
nJ=
26E.n. J J
E.l:.Y.
l J l J
m
=
E.n .
J J
a.
=
~. -~J J
where, ~
=
The grand mean in both the regions.a .
=
The effect of the Sajha Program.J
e . .
=
A random error.lJ
~.
=
Mean of theJ Hills and mean of the Plains.
m
=
Sample mean.l:m2) TSS = l:m
l + l:m2 + { n
l + n2
CSS = ( l:m l ) 2 + (l:m 2) 2 -
{
(l:ml + l:m2) 2 }RSS = EMS =
CMS =
F =
n
l n2
TSS
-
CSS RSS d.f.ml +d.f.m2 CSS
-d.f .
CMS EMS
n
l +n2-l
ANOVA TABLE (Analysis of Variance Table)
Source d.f. SS
Between groups r-l RSS
Within groups nl-r CSS
r
Total l: nl-r
i=l
where, m
l = Mean of number of activities m
2 = Mean of number of activities TSS = Total sum of squares.
RSS = Regression sum of squares.
CSS = Column sum of squares.
ESS = Error sum of squares.
CMS = Column mean square.
d.f. = Degrees of freedom.
In In
MS F-ratio
RSS/r-l
CSS/ni-r RSS/r-l CSS/ni-r
2.4.3 Interpretation
If the computed F-value is greater than the tabulated value
(F-ratio) then the null hypothesis that the two means are equal lS rejected
and the alternative hypothesis Hl is accepted. 2.5 Coefficient of Variation
This study also wishes to compare the variation In the distribution
of loans, repayments and overdues within the groups (for different Slzes
of farm holding) as a percentage of the means. This is also known as the
coefficient of variation which has been computed as: (Croxton & Cowden 1964, pp. 222-5).
S
V
= -
x 100X
where, V
=
Coefficient of variation.S
=
Standard deviation.X
=
Mean.This is particularly selected because the standard deviation is not
directly comparable between the groups (for different sizes of farm holding) . The coefficient of variation indicates the size of variation within as well as between the groups. The coefficient of variation has been compared for different groups which differ with respect to mean or standard
deviation or both.
We are interested to know whether or not relative distribution (of loans, r epayments and overdues) and the size of variation occurs within
the groups. The amount of loans, repayments and overdues on different
2.4.3 Interpretation
If the computed F-value lS greater than the tabulated value
(F-ratio) then the null hypothesis that the two means are equal lS rejected
and the alternative hypothesis Hl lS accepted. 2. 5 Coefficient of Variation
This study also wishes to compare the variation In the distribution
of loans, repayments and overdues within the groups (for different sizes of farm holding) as a percentage of the means. This is also known as the
coefficient of variation which has been computed as : (Croxton & Cowden 1964, pp. 222-5).
S
V
= -
x 100X
where, V
=
Coefficient of variation. S Standard deviation.X = Mean.
This is particul arly selected because the standard deviation is not
directly comparable between the groups (for different sizes of farm holding) .
The coefficient of variation indicates the size of variation within as well as between the groups. The coefficient of variation has been compared for different groups which differ with respect to mean or standard
deviation or both.
We are interested to know whether or not relative distribution (of loans, repayments and overdues) and the size of variation occurs within
the groups. The amount of loans, repayments and overdues on different
and default rates of member farmers among different Slzes of farm holding
and are compared by setting up a measure of relative dispersion. 2. 6 Summary
To determine whether or not a change has occurred with the
intro-duction of the Sajhas, the first two hypotheses that ' the introduction of the Supervised Sajha Program has improved the credit function of the Sajha
Societies' and that ' improved functioning has led to a greater use of credit, profitability and the financial turnover ' are tested by using a slgn test.
Then to determi ne the magnitude of the change and its significance,
a comparlson of means using a paired t-test has been conducted for the
analysis.
For the third hypothesis proposed that 'the Sajha Societies In different regions with different lines of activities differ in their
efficiency' (i.e., to determine the regional variability), a group mean
comparison using an analysis of variance has been conducted.
To determine the disparity between the small and medium farmers and the large farmers in their access to credit and the default rates
among the larger farmers the fourth and fifth hypotheses that 'the larger
farmers and the influential members dominate the Advisory Committee to their own benefit and the default rates are higher among these dominant
groups' are tested by using a Chi-square test.
The variations within the groups as the percentage of the means
are tested by comparing the Coefficient of Variation to determine whether
or not variation occurs within the groups.
CHAPTER 3
COOPERATIVES IN NEPALESE AGRICULTURE
In this chapter an attempt is made to examine some aspects of
cooperative principles, their relevance to Nepalese conditions, and their
social and economic organisation.
3.1 Cooperative Defined
There have always been instances in the history of human society, as Helm (1968) states, where individuals have corne together to achieve
certain aims in cooperati on with others. These cornmon efforts were usually directed to fulfilling certain temporary needs.
The word cooperative, as defined in the Encyclopaedia Metropolitana, lS derived from the Latin word, coparare which simply means working together for some cornmon purpose (Holyoake 1875, p .l) .
3.1.1 The Concept of the Cooperative Movement
The rise and expansion of the modern cooperative has its roots in the far-reaching economic, social and political changes which took place
in Europe In the late 18th century and all through the 19th century,
especially in the Industrial Revolution and the liberation of the peasantry from the feudalistic system (Helm 1968, pp.1-3).
In spite of these favourable conditions, the cooperative movement would not have grown so fast if i t had not been for a group of dedicated, philanthropist politicians, churchmen and civil servants who promoted
co-operation by instilling a general enthusiasm for its ideals or by showing
the way through practical examples, like Mahatma Gandhi in Indian
In England people like Robert Owen and William King applied the
methods of cooperation to a consumer movement, the first successful
venture being the Rochdale Pioneers. This movement subsequently spread
allover the world.
3.1. 2 Definition of Cooperative Principles
As Helm (1968, p.3) states:
' .. . the modern cooperative is very difficult to define
because of wide variation in its functions, the
flexibility in its organisation, easy adaptability to
a variety of different purposes and widely diverging
economic and social systems. Therefore the
definition of cooperative principles that should
govern its operation and organisation has been
difficult to define. '
Different people have expressed their Vlews on cooperative
principles on the basis of social and economlC needs as follows:
a cooperative society is an organisation for the
purpose of joint trading, originating among the weak
and conducted always in an unselfish spirit on such
terms that all who are prepared to assume the duties
of membership, share in its rewards in proportion to
the degree in which they make use of their association'
(Fary 1908 cited in Tyagi1968, p .4).
' ... a cooperative is a form of organisation where the
persons voluntarily associate together as human beings
on the basis of equality for the promotion of economic
interest of themselves' (Hubert Calverts 1926 cited in
Hough 1966, p.4l).
'Self help made effective by organisation is
co-operation ' (Sir H. Plunkett 1928, cited in Hough 1966,
p.4l) .
3.1. 3 Cooperatives for Agricultural Development
The agricultural cooperative movement started in Germany in the
form of credit, supply and marketing as initiated by Raiffeisen in 18491
1 Raiffeisen ' s principles are: (i) open membership; (ii) democratic control; (iii) limited interest on shares; (iv) patronage rebates; (v) goods be sold at current market price in cash; (vi) neutrality
of race, religion, etc.; (vii) continuous education to members; and
(Digby 1949, Ch.VI; Abraham 1973, p .2). In India the British Colonial
government introduced the cooperative system in 1904 after intensive study
of the Rallfeisen and Luzzati credit soci ety from where i t spread allover
Asia (Abraham 1973, p .2). The definition used in this study is that of
the FAO (Duler 1974, p .S) :
'Cooperatives of agricultural producers or workers which
serve agricultural production and marketing in the rural
areas and are registered as cooperative societies in the
l egal sense '
3. 2 Ideology of the Cooperative Movement
In spite of these controversies as to the definition of cooperative
principles, the concept of cooperation can be cl assified into three main
schools of thought (Helm 1968 , pp. 3-S).
3. 2.1 The Cooperative Enterprise School
This is also cal led the pacemakers or cooperative yardstick
school: i t is based on a voluntary association of independent units.
The primary objective of the cooperative soci ety is the advancement of the
members' economic interests, and the protection and maintenance of the
economlc independence of the small entrepreneurs and farmers by balancing
economlc weakness through the pooling of resources and thus achieving
economies of scale.
It is apparent that cooperatives are out to improve their
individual economic position ln a competitive situation.
3.2. 2 The Cooperative Commonwealth School
In addition to what we have discussed in Section 3.2.1 the long
term objective of cooperatives is to eliminate the competitive capitalistic
system and replace i t by an economic system based on mutual cooperation:
3.2.3 The Socialist Cooperative School
This is the most recent school of thought based on
Marxist-Leninist theory, according to which cooperation can be an important step in socialist progress. In this school, a cooperative 1S defined as an economic and social organization of the working people, serving not only
the interest of the members, but also of social progress, which promotes, safeguards and realises the interests and aspirations of the working
people.
As cooperatives desperately struggle to promote their respective
schools of thought only a few like Prof. W. Preus and Bernhard Lavergue have subscribed to more liberal views that cooperatives include 'free
cooperatives which determine their own economic policy as well as state operated cooperatives with fixed economic targets under overall government planning' (Helm 1968, pp.3-5).
3.3 Agricultural Cooperatives 1n the Nepalese Economy
Nepalese agriculture is predominantly a traditional subsistence
sector consisting of small and fragmented holdings with a low level of
productivity. This sector contributes 65.03% to GOP, provides employment
for 94.4% of the people and is the main source of foreign exchange (HMG.
Agricultural Statistics of Nepal 1977).
3. 3.1 Credit System
The main source of credit to rural people is still non-institutional sources, such as relatives, landlords and private moneylenders, etc. with the exception of relatives, these creditors are like parasites and exploit the people with exorbitantly high rates of interest along with discounts
d ' f 1
an gl ts.
1 It is believed that rural people in Nepal are are born, brought up and die in debt and then their future generations.
heavily in debt. They
The majority of farmers are illiterate and ignorant, no documents
of the exact amounts transacted are kept, land is offered as a collateral
against loans and would eventually fall into the hands of the creditors.
The annual interest is added to the principle amount and is thus
ac-cumulated, which compels the borrowers to dispose of their land to the
lenders.
The formal lending institutions are of very recent orlgln In
Nepal, emerging as a result of the land reform program in 1963. They
include the Agricultural Development Bank and the primary agricultural
cooperative societies of today.
It is believed that the majority of small and medium farmers have
not benefitted from the existence of these formal institutions because
tangible assets are required as a security for loan which small farmers
cannot offer. Moreover credit from formal sources involves delay and
the completion of many formalities which is a difficult task for illiterate
small farmers (FAO 1966, pp.1-15).
3.3.2 History of Cooperation In Nepalese Agriculture
Cooperation in the form of mutual help has a long history in the
rural community since time immemorial. The system of group farming is
1
known as Manka-Jya and Parma - a system of exchange of labour and pooling
of farm resources to work together (Sinha 1964, p.3; Prabasi 1966, p.37).
A religious grain store for the mobilisation of deposits in the Hills is
known as Dharam Bhakari (Grainbank). A donation of grain is made
vol-untarily according to the capacity of the members . The objective of the
grainbank is probably for famine relief or welfare in the time of natural
calamities.
1 The exchange of labour and farm resources in KathmanduValley among some
of the farming ethnic community is known as Manka-Jya while a similar
A traditional system of cooperation known as Dhikuri (a cash bank)
In some of the north-west districts is formed by a group of people within
the community for business purposes. Each member contributes a certain
amount of money to a common fund, the members borrow from the fund when
they need to for business with an interest of 10-15% per annum. The main
organizer enJoys the facility of 3-5% commission from the interest earned
by the Dhikuri (Sinha 1964, pp.1-3) .
3.3. 3 The Modern Cooperative Movement in Nepal
The cooperative along modern lines started in 1953 (Prabasi 1966,
p.41) when flood affected and landless people were resettled in the Rapti
1
Valley to reclaim the large forest area for cultivation. A decision to
organize cooperative societies as a matter of state policy was undertaken
in 1956 (Sinha 1964, Ch.2, p.4) after the cooperative department had been
set up in 1954.
The importance of cooperatives arose when the settlers had a
dearth of factor inputs to cultivate the fallow land. Cooperatives were
set up as a government intervention program to provide credit and input
supplies to the settlers. While introducing the cooperative system in
-the initial period, the main problems were the absence of cooperative law,
lack of financial institutions and lack of trained personnel in the
co-operative field.
A small development fund was created by the Treasury for financing
the settlers through cooperatives (Prabasi 1966, pp.41-42). The first
cooperative society of the Raiffeisen model was organized in the Rapti
Valley with an executive order issued by HMG In 1956 authorising the
organization, registration and operational procedures (Sinha 1964, p.5).
The first Cooperative Society Act was enacted in 1959 (Sinha
1964, p.5) , the features of the Act being as follows:
a . At least 10 persons should form a cooperative
society, the objective being to lmprove the
d ' , h 1
economlC con ltlons of t e members.
b. The liability of the society would depend upon
the nature of the work it intends to undertake.
If the society is a primary credit society, the
liability is unlimited, but if it lS
multi-purpose the liability lS limited.
c. Members wil l have one vote irrespective of the
number of shares purchased.
d. The society would be exempt from stamp duty,
registration fees and income tax.
e. A reserve fund would set aside 25% from the net
profit.
f. A society will be liquidated if two-thirds of
its members apply for i t or total members are
less than 25 or if the society is considered to
be mismanaged.
g. There is a provision for arbitration if disputes
arise between the societies or among themselves.
h. The government can participate in the share capital up to 51 per cent.
J
.
Debentures can be floated by a society to attract capital.k. A society should be registered under the Cooperative Act; powers regarding promotion, organization, supervision, registration and
settlement of disputes are glven to the Registrar.
The Act envisages the formation of cooperative societies for the promotion of thrift, self-help and mutual aid among persons having limited capital and engaged in agriculture.
3.4 The Cooperative Movement During Four Plan Periods 3. 4.1 The First Plan 1956-1961
The first legislation carne into existence in 1959. The highlights of its achievement are presented in Table 3.1 below. The achievements are
TABLE 3.1
ACTIVITIES OF COOPERATIVES DURING FOUR PLAN PERIODS
,s.No. Activities 1956-61 1961-62 1962-65 1966-70 Total 1956-70 1 Total No. of Societies T 4500 T n.a. T 2200 'T' n. a. T n.a.
A 378 A 203 A 542 A 360 A 1483 2 Total Membership 11059 4825 13916 27916 57538 3 Share Capital (Rs 000) 363 124 1177 838 4101 4 Loan Advanced (Rs 000) 1957 989 1162 n.a. 4108
5 Average Member/Society 29 24 26 77 39
6 Av. Share Capital/
Society Rs 24 26 84 30 71
7 Loan Advanced/Member Rs177 205 84 n.a. 71 Notes: T
=
targetA
=
actualn.a.