Ecology and Evolution. 2017;7:9661–9675. www.ecolevol.org
|
9661 Received: 9 February 2017|
Revised: 17 August 2017|
Accepted: 16 September 2017DOI: 10.1002/ece3.3491
O R I G I N A L R E S E A R C H
Quantifying resilience of multiple ecosystem services and
biodiversity in a temperate forest landscape
Elena Cantarello
1|
Adrian C. Newton
1|
Philip A. Martin
1|
Paul M. Evans
1|
Arjan Gosal
1|
Melissa S. Lucash
2This is an open access article under the terms of the Creative Commons Attribution License, which permits use, distribution and reproduction in any medium, provided the original work is properly cited.
© 2017 The Authors. Ecology and Evolution published by John Wiley & Sons Ltd.
1Department of Life and Environmental
Sciences, Bournemouth University, Poole, UK
2Department of Environmental Science and
Management, SRTC B1-04D, Portland State University, Portland, OR, USA
Correspondence
Elena Cantarello, Department of Life and Environmental Sciences, Bournemouth University, Poole, UK.
Email: [email protected]
Funding information
This research is funded by NERC via the Biodiversity & Ecosystem Service Sustainability (BESS) program. Project ref. NE/K01322X/1. The opinions and views expressed here do not necessarily represent those of the main BESS program and its directorate.
Abstract
Resilience is increasingly being considered as a new paradigm of forest management among scientists, practitioners, and policymakers. However, metrics of resilience to environmental change are lacking. Faced with novel disturbances, forests may be able to sustain existing ecosystem services and biodiversity by exhibiting resilience, or alternatively these attributes may undergo either a linear or nonlinear decline. Here we provide a novel quantitative approach for assessing forest resilience that focuses on three components of resilience, namely resistance, recovery, and net change, using a spatially explicit model of forest dynamics. Under the pulse set scenarios, we explored the resilience of nine ecosystem services and four biodiversity measures following a one- off disturbance applied to an increasing percentage of forest area. Under the pulse + press set scenarios, the six disturbance intensities explored during the pulse set were followed by a continuous disturbance. We detected thresholds in net change under pulse + press scenarios for the majority of the ecosystem services and biodiver-sity measures, which started to decline sharply when disturbance affected >40% of the landscape. Thresholds in net change were not observed under the pulse scenarios, with the exception of timber volume and ground flora species richness. Thresholds were most pronounced for aboveground biomass, timber volume with respect to the ecosystem services, and ectomycorrhizal fungi and ground flora species richness with respect to the biodiversity measures. Synthesis and applications. The approach pre-sented here illustrates how the multidimensionality of stability research in ecology can be addressed and how forest resilience can be estimated in practice. Managers should adopt specific management actions to support each of the three components of resil-ience separately, as these may respond differently to disturbance. In addition, man-agement interventions aiming to deliver resilience should incorporate an assessment of both pulse and press disturbances to ensure detection of threshold responses to disturbance, so that appropriate management interventions can be identified.
K E Y W O R D S
1
|
INTRODUCTION
Forests have evolved in the presence of natural disturbances, such as drought, windstorms, wildfire, insect, and disease outbreaks (Greenberg & Collins, 2015; Walker, 1999). However, the increasing frequency, extent, and severity of disturbances are altering forest communities outside the ranges within which they have evolved and adapted (Usbeck et al., 2010; Weed, Ayres, & Hicke, 2013). As a result of the current high rate of global environmental change, the intensi-fication of forest disturbances is likely to continue, which may inhibit the ability of species to keep pace through their evolutionary adapta-tion processes (Trumbore, Brando, & Hartmann, 2015). As a result, the future of global forests, their associated biodiversity, and the provision of ecosystem services to human society are uncertain (Trumbore et al., 2015). These services include provisioning (e.g., timber), regulating (e.g., carbon sequestration), supporting (e.g., nutrient cycling), and cul-tural (e.g., recreation) benefits (MEA 2005). When expressed in mone-tary units, these combined services have been estimated to be worth 5,264 and 3,013 international $/ha/year in tropical and temperate forests, respectively (de Groot et al., 2012). Forests also contain more than 80% of terrestrial species, providing an important source of bio-diversity worldwide (FAO 2012). If species are not able to adapt to the intensified disturbances that are widely occurring, the maintenance of biodiversity and the sustainable provisioning of ecosystem services to society could be undermined (Lindner et al., 2010).
Recent research has focused on understanding the trajectory of forest system responses to disturbances, including the role of thresh-olds and changes in ecological state (Allen, Breshears, & McDowell, 2015). Millar and Stephenson (2015) theorized four patterns of forest response to cumulative disturbances: Response (1) corresponds to a resilient forest, able to sustain existing ecosystem services and where no thresholds are reached; response (2) and (3) both represent a forest crossing a threshold, leading to the conversion to a new forest type. Under (2), the forest is still able to sustain primary ecosystem services, whereas under (3) the changes are substantial enough that ecosystem service delivery declines. Response (4) corresponds to a forest that following the crossing of a threshold transforms to a nonforest type, losing forest function and its capacity to deliver most forest ecosystem services. Given that disturbances are spatially explicit processes play-ing a key role in forest ecosystem dynamics, landscape approaches are required to determine whether there are abrupt thresholds or more subtle changes in these systems and to evaluate the trajectory of forest recovery (Seidl et al., 2011; Trumbore et al., 2015). Following a disturbance, some forest functions such as photosynthesis and tran-spiration can recover within a decade, whereas it can take >100 years for biomass and biodiversity to recover (Martin, Newton, & Bullock, 2013; Spake, Ezard, Martin, Newton, & Doncaster, 2015; Trumbore et al., 2015). If we can anticipate an approaching forest transition, guidance can be provided on how management can be adapted so that biodiversity and ecosystem service delivery is maintained.
One response strategy to intensified disturbances is to enhance ecosystem resilience, which has been the focus of recent literature (Biggs et al., 2012), and environmental policy (Newton, 2016; Newton
& Cantarello, 2015). Resilience is intuitively understood as the abil-ity of an ecosystem to withstand or tolerate a perturbation. However, the precise definition of resilience in an ecological context has been the focus of substantial debate (Newton & Cantarello, 2015). Many different definitions have been proposed, including engineering re-silience (the time required for a system to return to an equilibrium point following a disturbance event; Pimm, 1984) and ecological re-silience (the amount of disturbance that a system can absorb before transitioning to another stable state; Brand & Jax, 2007). Promoting resilience through forest management is particularly relevant in the context of intensified disturbances, because the stochastic nature of such disturbances makes them difficult to predict (Seidl, 2014). In ad-dition, disturbances do not act in separation, but can interact in ways that increase their impact. For example, warmer temperatures are expected to amplify the occurrence of pest species, and interactions with drought can further accelerate tree mortality in insect- damaged trees (Dale et al., 2001).
Despite the emerging importance of resilience as a new paradigm of forest ecosystem management among scientists, practitioners, and policymakers (Millar & Stephenson, 2015; Newton & Cantarello, 2015; Seidl, Spies, Peterson, Stephens, & Hicke, 2016), theoretical discussions of resilience concepts still greatly outpace their practical application (Biggs et al., 2012). This can be attributed to knowledge gaps regarding the underlying mechanisms, and the difficulties in measuring resilience in ways that are appropriate for informing man-agement (Biggs et al., 2012; Reyer et al., 2015). Recent research has identified some approaches that can potentially be used to measure resilience. Methods include rapid assessment approaches (Nemec et al., 2014), the quantification of functional diversity and response di-versity (Angeler et al., 2014), discontinuity approaches (Nash, Graham, Jennings, Wilson, & Bellwood, 2016), and thresholds analysis (Standish et al., 2014). However, very few studies have proposed quantifiable metrics, and even in these cases (Nash et al., 2016), they are largely limited to freshwater and marine ecosystems. Potential ways forward for terrestrial ecosystems such as forests include assessment of differ-ent elemdiffer-ents of resilience, such as resistance and recovery (Newton & Cantarello, 2015; Nimmo, Mac Nally, Cunningham, Haslem, & Bennett, 2015), which should be standardized and compared across systems and fields of research (Hodgson, McDonald, & Hosken, 2015). Measures of resilience should also take into account the spatial and temporal components of disturbances, which are rarely considered (Allen et al., 2016).
are resistant to pulse and press disturbances; (2) to what extent forest ecosystem services and biodiversity recover from pulse and press dis-turbances; (3) whether perturbed forest ecosystem services and bio-diversity are able to persist over time; and (4) whether there are any thresholds observed in loss of ecosystem service provision and biodi-versity when disturbance intensifies over time. Specifically, we tested the hypothesis that all three components of resilience were correlated with each other.
2
|
MATERIALS AND METHODS
2.1
|
Study area
The New Forest National Park is located in southern England (UK; 50°52′00″N 1°34′00″W) and extends over 57,100 ha (Newton, 2010). Its exceptional importance for nature conservation is reflected in its many designations, ranging from national- scale legislation (e.g., Site of Special Scientific Interest—SSSI), to global- scale designations (Cantarello, Green, & Westerhoff, 2010). The Park is also one of the most visited in Britain with over 13 million day visits each year (Forestry Commission 2008). The vegetation is composed of ancient pasture- woodlands, lowland heathland, valley mire communities, acid grassland, the network of rivers and streams, and permanent and temporary ponds. Nowhere else in lowland England do these habitats occur together and at such a large scale (Cantarello et al., 2010). The unique character of the New Forest is strongly dependent on its his-tory as a medieval Royal hunting reserve and the long- term survival of a traditional commoning system, with large populations of deer and free- roaming livestock (principally ponies and cattle) interacting with the processes of ecological succession (Newton, Cantarello, Tejedor, & Myers, 2013). The New Forest has been remarkably resilient as a socio- ecological system having withstood profound political and socioeconomic changes in society over the last 900 years (Newton, 2011); however, some woodland elements of this system are cur-rently undergoing major changes in structure and composition (Martin et al., 2015). Possible causes of dieback have been attributed to the co- occurrence of multiple stressors, such as droughts and novel path-ogenic fungi (Martin et al., 2015).
Our research focused on the broadleaved woodlands of the National Park, which are highly valued for their biodiversity, recre-ational opportunities and amenities (Newton, 2010), and managed with the dual purposes of (1) conserving and enhancing the natural beauty, wildlife, and cultural heritage and (2) promoting opportuni-ties for the understanding and enjoyment of the special qualiopportuni-ties of the Park by the public, as set out by the Environmental Act 1995. Management decision making plays a crucial part in meeting the dual statutory purposes. These woodlands were identified by selecting the SSSI management units with >50% of the basal area represented by broadleaved species and comprised 6,909 ha (Appendix S1). They in-clude ancient pasture- woodlands originating in the 18th century or earlier, shaped by the presence of grazing and traditional pollarding of trees (Peterken, Spencer, & Field, 1996), and “enclosed” woodlands that historically have been managed for timber production and have
at times been protected by stock fences. In addition to their ability to provide timber, today enclosed woodlands are increasingly rec-ognized for their nature conservation and recreation value (Forestry Commission 2008). The tree biomass is dominated by Quercus robur
(47%) and Fagus sylvatica (33%), with an understorey of Ilex aquifolium
(9%) and an admixture of Betula pendula (4.5%), Crataegus monogyna
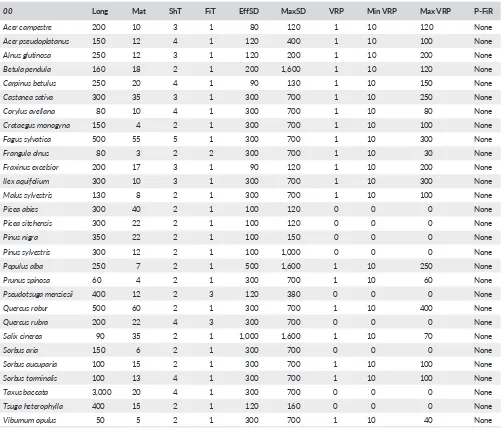
(1.3%), and Taxus baccata (0.9%). Details of the species characteris-tics found in the broadleaved woodlands were based on Newton et al. (2013) (Table 1). The main soil types are surface water gleys (84%), ground water gleys (9%), brown earths (7%), and podzols (0.2%) based on the National Soil Resources Institute (2007) and Pyatt et al. (2003). The local climate is temperate oceanic with a mean (±SD) annual pre-cipitation of 832 ± 150 mm and mean (±SD) annual temperature of 10.17 ± 0.64°C between 1957 and 2014 (Met Office 2015).
2.2
|
Study design
Two main sets of scenarios were developed to explore the impact of increasing disturbance on the provisioning of ecosystem ser-vices and biodiversity: “pulse” and “pulse+press” sets. Under the pulse set, forest dynamics following a one- off disturbance, such as a windthrow event or pathogen attack, were explored using an increasing percentage area to which the disturbance was applied (0%, 20%, 40%, 60%, 80%, and 100%). The disturbance commenced after 5 years of the simulation and lasted for 1 year, randomly re-moving the dominant tree species with > 10 cm diameter at breast height (dbh). Under the pulse + press set, the six disturbance inten-sities explored during the pulse set were followed by a continuous disturbance, simulating the current levels of browsing of trees by livestock and deer (Newton et al., 2013). In total, 12 scenarios were simulated and each scenario was replicated three times, owing to the stochastic nature of disturbance events. Due to the low vari-ation between the three replicates for each scenario, AGB of each replicate was less than ±5% of the mean of replicates at the end of the simulation. Scenarios were developed over a time frame rel-evant to decision making (100 years; Forestry Commission 2016) and were run at a 50- m resolution (or cell size).
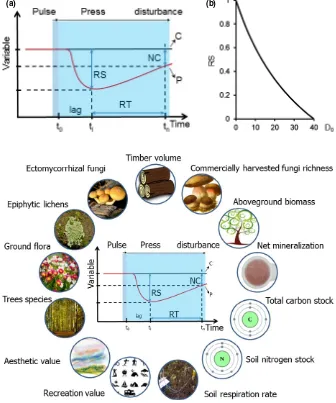
Three properties of resilience were calculated, following Nimmo et al. (2015): resistance, recovery time, and net change. Resistance was measured as the magnitude of change of each variable (i.e., eco-system service or biodiversity measure) caused by the disturbance, using the index proposed by Orwin and Wardle (2004):
where D0 is the difference between the control variable (C) at time t0, and the disturbed variable (P) after a one- off disturbance has occurred (i.e., end of year 5; Figure 1a). The index was bounded by 0 and +1, with a value of +1 showing maximum resistance and lower values showing less resistance. In those cases where D0 > C0 (indicating an increase
in the value of the variable), the index was set to 1 to avoid the index giving a negative value of resistance (Figure 1b). Recovery time was measured as the time taken for each variable to return to the predis-turbance value (Pimm, 1984). Maximum recovery time was 100 years to coincide with the time frame of the scenarios, relevant to decision making (Forestry Commission 2016). In those cases where resistance (tl) was set to 1, recovery time was considered nonapplicable and therefore was not calculated. It is worth noting that recovery time is referred to as “resilience” by Grimm and Wissel (1997) and Donohue et al. (2016). Systems with shorter recovery times are more resilient than those with longer recovery time (Donohue et al., 2016). Net change was measured by comparing each variable at the end of the simulation with the predis-turbance value, following Nimmo et al. (2015).
(1) resistance (tl)=1−
2D0
C 0+D0
T A B L E 1 Details of the species characteristics encountered in the broadleaved woodlands of the New Forest National Park
00 Long Mat ShT FiT EffSD MaxSD VRP Min VRP Max VRP P- FiR
Acer campestre 200 10 3 1 80 120 1 10 120 None
Acer pseudoplatanus 150 12 4 1 120 400 1 10 100 None
Alnus glutinosa 250 12 3 1 120 200 1 10 200 None
Betula pendula 160 18 2 1 200 1,600 1 10 120 None
Carpinus betulus 250 20 4 1 90 130 1 10 150 None
Castanea sativa 300 35 3 1 300 700 1 10 250 None
Corylus avellana 80 10 4 1 300 700 1 10 80 None
Crataegus monogyna 150 4 2 1 300 700 1 10 100 None
Fagus sylvatica 500 55 5 1 300 700 1 10 300 None
Frangula alnus 80 3 2 2 300 700 1 10 30 None
Fraxinus excelsior 200 17 3 1 90 120 1 10 200 None
Ilex aquifolium 300 10 3 1 300 700 1 10 300 None
Malus sylvestris 130 8 2 1 300 700 1 10 100 None
Picea abies 300 40 2 1 100 120 0 0 0 None
Picea sitchensis 300 22 2 1 100 120 0 0 0 None
Pinus nigra 350 22 2 1 100 150 0 0 0 None
Pinus sylvestris 300 12 2 1 100 1,000 0 0 0 None
Populus alba 250 7 2 1 500 1,600 1 10 250 None
Prunus spinosa 60 4 2 1 300 700 1 10 60 None
Pseudotsuga menziesii 400 12 2 3 120 380 0 0 0 None
Quercus robur 500 60 2 1 300 700 1 10 400 None
Quercus rubra 200 22 4 3 300 700 0 0 0 None
Salix cinerea 90 35 2 1 1,000 1,600 1 10 70 None
Sorbus aria 150 6 2 1 300 700 0 0 0 None
Sorbus aucuparia 100 15 2 1 300 700 1 10 100 None
Sorbus torminalis 100 13 4 1 300 700 1 10 100 None
Taxus baccata 3,000 20 4 1 300 700 0 0 0 None
Tsuga heterophylla 400 15 2 1 120 160 0 0 0 None
Viburnum opulus 50 5 2 1 300 700 1 10 40 None
[image:4.595.49.552.60.491.2]Linear mixed models (LMMs) were fitted to estimate the rela-tionships between resistance, recovery time, and net change and the degree of disturbance for each ecosystem service and biodiversity measure. To improve models performance and interpretability of co-efficients, the degree of disturbance was standardized prior to anal-ysis using the methods in Schielzeth (2010). Models fitted included null (M = B0 + Re), linear (M = B0 + DB1 + Re), and quadratic terms (M = B0 + D B1 + D B22 + Re), with scenario replicates as a random
ef-fect (where M is the metric of interest, B0 is the model intercept, D is the degree of disturbance, B1 and B2 are parameters relating to the slope, and Re is a random effect that identifies the different model replicates). Model selection was performed by comparing models AICc, with the best model having the lowest AICc. The coefficients and the nature of the best models were recorded along with R2 values
follow-ing the methods of Nakagawa and Schielzeth (2013). A variable was considered to show a threshold if the best model included a quadratic term, indicating a nonlinear relationship, and its marginal R2 value was
>0.9. These criteria were based on what we considered to be good practice, but it should be noted that use of different criteria might have yielded different results. A paired Wilcoxon signed rank test
was used to test differences between the pulse and the pulse + press values of resistance, recovery time, and net change. Spearman cor-relation analyses between resistance, recovery time, and net change were performed for each of the variables. All analyses were con-ducted in R 3.2.2. (R Core Team, 2015), using the lme4 package (Bates, Mächler, Bolker, & Walker, 2014) for mixed models, and the qdapTools (Goodrich, Kurkiewicz, Muller, & Rinker, 2015) for correlations.
2.3
|
Ecosystem services and biodiversity data sets
Nine ecosystem services and four biodiversity measures were selected, based on their importance in forest ecosystems: aboveground biomass (Mg/ha), aesthetic value, commercially harvested fungi richness, net ni-trogen (N) mineralization absorbed to ionic resins [(μg NO3− + NH
4+)/
capsule)], recreation value, soil nitrogen stock (Mg N/ha), soil respi-ration rate (μmols m2/s), timber volume (m3/ha), total carbon stock
(Mg C/ha), and species richness of ectomycorrhizal fungi (ECM), ground flora, epiphytic lichens, and trees (Figure 2).
Aboveground biomass, total C stock, and soil N stock were cal-culated from the Century Extension of LANDIS- II. Timber volume F I G U R E 1 (a) Example of the resistance
(RS), recovery time (RT), and net change (NC) of a response variable to a pulse and press disturbance. The black upper line represents the control variable (C) and the red line represents the perturbed variable (P); (b) Changes in RS with changes in D0
(i.e., C0–Pl), when C0 is fixed at 40. Adapted from Shade et al. (2012) and Orwin and Wardle (2004)
(a) (b)
[image:5.595.215.551.52.455.2]was calculated by multiplying the aboveground biomass of the spe-cies important for timber production (i.e., Quercus robur and Fagus sylvatica) for their respective nominal specific gravity (Jenkins et al., 2011).
Net N mineralization, soil respiration rate, species richness of commercially harvested and ectomycorrhizal fungi, ground flora, and
[image:6.595.53.548.43.532.2]relationships between aboveground biomass (AGB) and the variables. A value for each of the 50- m cells associated with broadleaved wood-lands was then derived from the model- averaged coefficients of the
[image:7.595.48.546.43.651.2](2011). For variables of species richness, a Poisson error structure was used, while Gaussian errors were used for all other variables. Further information about the LMMs fitted is presented in Appendix S4.
3
|
RESULTS
3.1
|
Ecosystem services and biodiversity spatial and
temporal variation
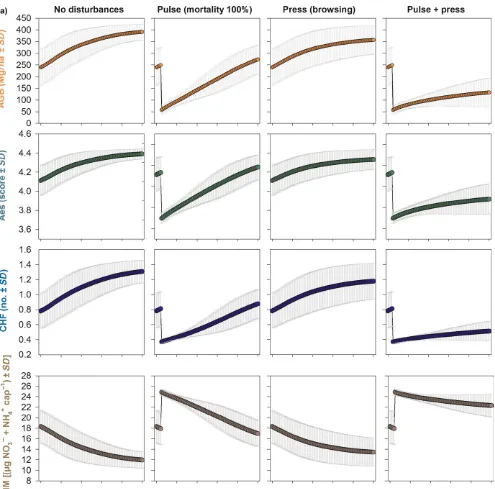
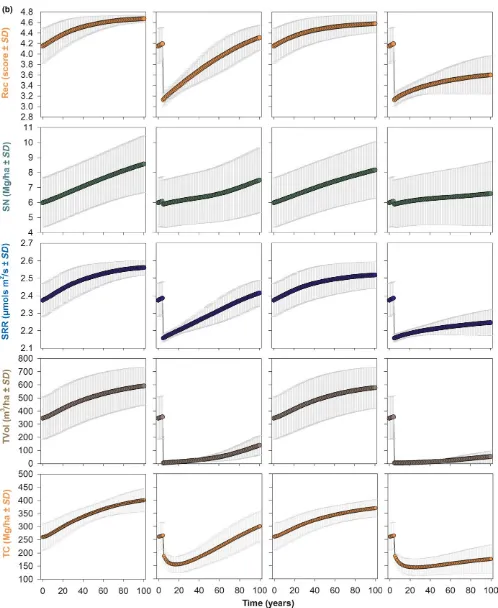
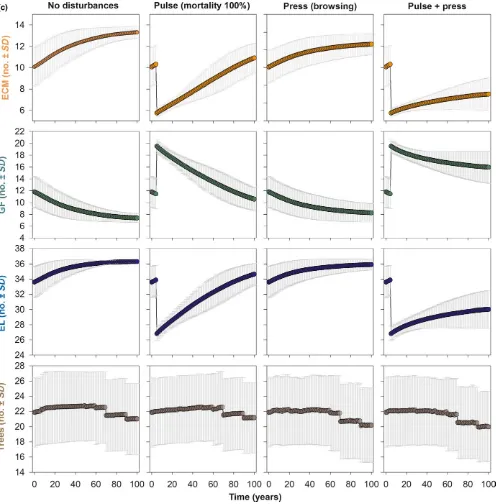
All of the ecosystem services and biodiversity measures stud-ied varstud-ied spatially between ecoregions. Most variables (10/13)
demonstrated a sudden decrease after the pulse disturbance was applied and started to increase back to a predisturbance value with time. Conversely, net N mineralization and ground flora rich-ness displayed an increase after the pulse disturbance was applied, whereas tree species richness demonstrated little change with time (Figure 3).
3.2
|
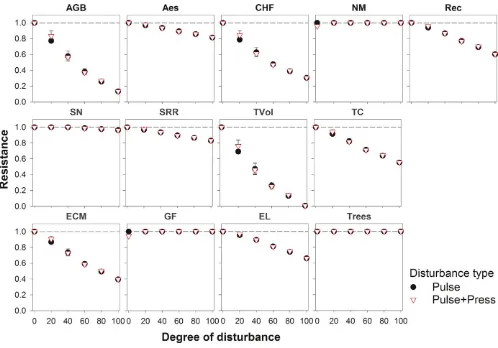
Resistance
[image:8.595.52.548.47.551.2]Only net N mineralization rate was resistant to disturbance. Timber volume and AGB demonstrated steeper declines, whereas declines in soil nitrogen stock and respiration rate were less rapid. Half of the biodiversity measures (2/4) showed a linear decline in resist-ance with increasing disturbresist-ance intensity, while the other half were resistant over time. Overall, resistance measures did not dif-fer between pulse and pulse + press sets of scenarios (Figure 4, Appendix S5).
3.3
|
Recovery
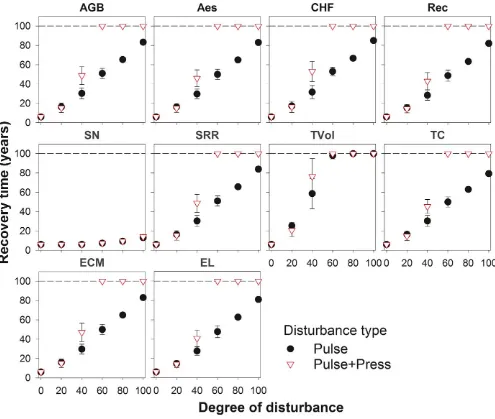
All of the ecosystem service and biodiversity measures showed an increase in recovery time with increasing disturbance intensity. Recovery time increased relatively rapidly for timber volume and richness of commercially harvested fungi, and relatively slowly for epiphytic lichens richness and recreation value. Recovery time for soil nitrogen stock and timber volume did not differ between pulse and pulse + press scenarios. For all of the other ecosystem service and biodiversity measures, values diverged between the two sets of sce-narios after disturbance was applied to >20% of the landscape. In all
but one case, ecosystem service and biodiversity measures did not re-cover to predisturbance values at high disturbance levels >60%), even after 100 years (Figure 5; Appendix S5).
3.4
|
Net change
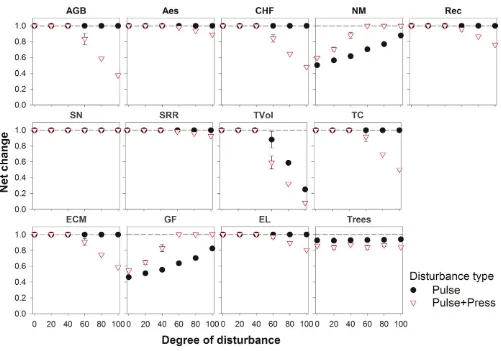
Under the pulse set, the majority of the ecosystem services and biodiversity measures (10/13) demonstrated an ability to recover to predisturbance values after 100 years. Ground flora richness and net N mineralization showed an increase in net change with distur-bance intensity, whereas timber volume showed a decrease. Under the pulse+press set, net change exhibited a threshold response in the majority of the cases (11/13). In nine cases, net change started to decline sharply when disturbance was applied to >40% of the landscape, whereas in two cases net change showed a quadratic increase with disturbance intensity. Soil nitrogen stock and tree species richness were best modeled by null models. Overall, with the exception of soil nitrogen stock, all of the net change measures differed between pulse and pulse + press scenario sets (Figure 6; Appendix S5).
[image:9.595.48.546.45.393.2]3.5
|
Relationship between resistance, recovery, and
net change
Under the pulse scenarios, all of the nonresistant ecosystem ser-vices and biodiversity measures (10/13) demonstrated a negative correlation between resistance and recovery time. Only in the case of timber volume, resistance and recovery time were correlated with net change (positively and negatively, respectively). Similarly to the pulse scenarios, under the pulse+press scenarios, 10 of 13 of the measures demonstrated a negative correlation between resistance and recovery time. Resistance was also positively cor-related with net change in 11 of 13 cases. Recovery time was neg-atively correlated with net change in nine of 13 cases (Appendices S5 and S6).
4
|
DISCUSSION
[image:10.595.51.546.46.465.2]Pimm, 1984); (2) there is a need to explore the response of systems to different types of disturbance, observed at different spatial and tem-poral scales, for several state variables and reference dynamics. This has been dubbed “ecological checklist” by Grimm and Wissel (1997). The most striking result of our study was the detection of thresholds in net change under a pulse + press scenario for the majority of the ecosystem services and biodiversity measures. In our specific case, net change started to decline sharply when disturbance affected >40% of the landscape. Thresholds in net change were not observed under the pulse scenarios, with the exception of timber volume and ground flora species richness. Thresholds were most pronounced for AGB and timber volume with respect to the ecosystem services, and ECM and ground flora species richness with respect to the biodiver-sity measures.
Threshold responses to environmental change are currently the focus of major scientific interest and societal concern (Mace, Hails, Cryle, Harlow, & Clarke, 2015; Oliver et al., 2015; Steffen et al., 2015), as when a threshold is crossed, a small perturbation may lead to major ecological change. However, the evidence for such thresholds in ter-restrial ecosystems is currently limited. Our results indicate that if the temperate forest examined here continues to be subjected to the browsing intensity that it experiences at present, no major changes in
ecosystem service provision and biodiversity are forecast (response type i of Millar & Stephenson, 2015). However, when browsing is com-bined with a pulse disturbance that causes tree mortality, such as a windthrow event or pathogen attack, the forest displays a threshold response. If pulse and press disturbances are applied to ≤40% of the area, the forest is still able to sustain primary ecosystem services (re-sponses type 2), whereas when these disturbances affect >40% of the forest area, recovery and net change in both biodiversity and ecosys-tem services is significantly altered (response type 3).
[image:11.595.48.549.42.393.2]site showed that over a period of 50 years, basal area declined by 33% and juvenile tree densities were reduced by ~70% (Martin et al., 2015). The threshold in AGB observed here was less pronounced than in tim-ber volume, as the species important for timtim-ber production coincided with the dominant species that were extirpated by the disturbances. As disturbance intensifies, relatively shade- tolerant dominant tree species are replaced by pioneer species (Newton, 2010), allowing AGB to recover more quickly compared to timber volume. The threshold observed in ECM richness could be attributable to the decline in tree root density associated with the loss of AGB and supports the findings of Treu et al. (2014) who showed ECM richness declining along a gra-dient of tree mortality. ECM richness is found to be dependent on tree root density, leaf area, and a sufficient supply of carbohydrate from the tree host (Yarwood, Myrold, & Hogberg, 2009) and can decrease following tree harvesting and insect attacks (Teste, Lieffers, & Strelkov, 2012; Treu et al., 2014). In the presence of an ECM richness decline, tree species may suffer significant reduction in growth and regenera-tion, resulting in a positive feedback between ECM and AGB decline (Simard et al., 2012). The thresholds in ground flora richness can be explained by well- known patterns of successional changes in forest ecosystems (Bormann & Likens, 1979). For example, Zenner, Kabrick, Jensen, Peck, and Grabner (2006) demonstrated that ground flora richness increased proportionally along a gradient of harvest intensity, in accordance with the results found in our study.
The current study presents a few issues that should be borne in mind when interpreting the results obtained. With regard to the ecosystem services and biodiversity measures explored, total carbon stock, soil nitrogen stock, and tree species richness were calculated from the Century Extension of LANDIS- II, which common to all eco-logical models is subject to a number of limitations and assumptions (Appendix S2). AGB was used as indicator for the remaining of the ecosystem services and biodiversity measures. This was based on data collected during previous research undertaken by Ref. Evans et al. (in press) and Gosal (2016) who measured a range of ecosystem services and biodiversity metrics along a gradient of woodland dieback, using basal area as a measure of forest structure. Basal area and AGB are among the indicators commonly found to be significantly related to biodiversity and ecosystem services (Cantarello & Newton, 2008; Harrison et al., 2014). However, in our study, some of the ecosystem services (namely aesthetic and recreation value, net N mineralization, and soil respiration rate) showed a low marginal R2 in the linear mixed
models fitted (Appendix S4), and therefore, the results for these mea-sures need to be considered with caution. Further research is required to examine the resilience of these measures.
Further, it should be noted that there are other issues to consider when interpreting the results obtained. Here, we quantified resilience through the three metrics of resistance, recovery, and net change. This represents an advance over adopting a one- dimensional perspective to assessing resilience, which as noted by Donohue et al. (2016) has been a feature of many previous studies., However, other components of resilience could have been adopted, such as asymptotic stability, variability and persistence (Pimm, 1984), or robustness (Donohue et al., 2016).
Despite these limitations, our results have a number of implica-tions for management. Current forest management in the UK is guided by national and regional forestry policies (Forestry Commission 2010; European Union, 2015), as well as specific management objectives for individual sites (Forestry Commission 2016). In sites such as the New Forest, in which many species are dependent on the mainte-nance of early successional communities, sustaining a disturbance re-gime can be critical to conserving biodiversity value (Newton, 2010). However, our results indicated that when current browsing intensities are combined with a pulse disturbance, such as a windthrow event or pathogen attack, thresholds effects can occur, leading to accelerated loss of ecosystem services and biodiversity. Today, there is increasing concern that many ecosystem services provided by forests in Europe will be affected negatively in coming decades, owing to the increased incidence of windthrow, bark beetle, and wildfires (Seidl, Schelhaas, Rammer, & Verkerk, 2014). Emerging diseases including acute oak de-cline, ask dieback, chestnut blight, Dutch elm disease, pine wilt, and Japanese larch disease are also causing increasing tree mortality in many parts of the world including the UK (Boyd, Freer- Smith, Gilligan, & Godfray, 2013; Pautasso, Aas, Queloz, & Holdenrieder, 2013). The current results highlight how such different perturbations can poten-tially interact, leading to the loss of both biodiversity and ecosystem services.
These results also have implications for how resilience is best measured. Here, following Grimm and Wissel (1997) and Nimmo et al. (2015), we assessed resilience as three independent components. However, we also examined whether these different components were correlated with each other, to test whether they could potentially be combined into a single measure or index of resilience. In most cases under the pulse + press scenarios, resistance and net change were positively correlated, whereas resistance and recovery were negatively correlated. However under the pulse scenarios, resistance and recov-ery were generally not correlated with net change. This indicates that these different components should be differentiated in analysis of re-silience, as they may respond differently to disturbance. Consideration of all three components under a combined single measure of resilience could therefore obscure important ecological changes occurring in for-ests. Resilience is increasingly being incorporated into many environ-mental management policies at national and global scales, despite the current measurement difficulty, which increases the risk of its misuse (Newton, 2016). Such risks could potentially be addressed using the kinds of measurement approaches described here and by developing specific management responses to support each of the three resilience components individually.
ACKNOWLEDGMENTS
We would like to thank Martin Dymond, Chris Moody, and Lisa Malter for their help in the field and laboratory, and Matthew Wilkinson and Elena Vanguelova at Forest Research for discussions on carbon measurements.
CONFLICT OF INTEREST
None declared.
AUTHORS’ CONTRIBUTION
A.C.N. and E.C conceived and designed the study. P.M.E., E.C., and A.G collected field data. E.C parameterized, calibrated, and run model with contribution from M.S.L. E.C. and P.A.M analyzed the data. E.C. and A.C.N. wrote the manuscript with contributions from all authors.
DATA ACCESSIBILITY
Raw data are in the process of being archived by The Environmental Information Data Centre (EIDC): http://eidc.ceh.ac.uk/
ORCID
Elena Cantarello http://orcid.org/0000-0001-7529-2018
REFERENCES
Allen, C. R., Angeler, D. G., Cumming, G. S., Folke, C., Twidwell, D., & Uden, D. R. (2016). Quantifying spatial resilience. Journal of Applied Ecology,
53, 625–635.
Allen, C. D., Breshears, D. D., & McDowell, N. G. (2015). On underesti-mation of global vulnerability to tree mortality and forest die- off from
hotter drought in the Anthropocene. Ecosphere, 6, 000–000.
Angeler, D. G., Allen, C. R., Birge, H. E., Drakare, S., McKie, B. G., & Johnson, R. K. (2014). Assessing and managing freshwater ecosystems
vulnera-ble to environmental change. Ambio, 43, 113–129.
Bates, D., Mächler, M., Bolker, B. M., & Walker, S. C. (2014). Fitting linear mixed-effects models using lme4. Madison, WI, USA: Department of Statistics, University of Wisconsin.
Bergmeier, E., Petermann, J., & Schröder, E. (2010). Geobotanical survey of wood- pasture habitats in Europe: Diversity, threats and conservation.
Biodiversity and Conservation, 19, 2995–3014.
Biggs, R., Schluter, M., Biggs, D., Bohensky, E. L., BurnSilver, S., Cundill, G., … West, P. C. (2012). Toward principles for enhancing the resilience of ecosys-tem services. Annual Review of Environment and Resources, 37(37), 421–448. Bormann, F. H., & Likens, G. E. (1979). Pattern and process in a forested
ecosystem: Disturbance, development, and the steady state based on the Hubbard Brook ecosystem study. New York, NY, USA: Springer-Verlag. Boyd, I. L., Freer-Smith, P. H., Gilligan, C. A., & Godfray, H. C. J. (2013).
The consequence of tree pests and diseases for ecosystem services.
Science, 342, 823.
Brand, F. S., & Jax, K. (2007). Focusing the meaning(s) of resilience:
Resilience as a descriptive concept and a boundary object. Ecology and
Society, 12(1), 23. [online]. URL: http://www.ecologyandsociety.org/ vol12/iss1/art23/.
Bruun, H. H., Heilmann-Clausen, J., & Ejrnaes, R. (2015). Forests: See the trees and the wood. Nature, 521, 32–32.
Cantarello, E., Green, R., & Westerhoff, D. (2010). The condition of The
New Forest habitats: An overview. In A. C. Newton (Ed.), Biodiversity
in the new forest (pp. 124–131). Newbury, Berkshire: Pisces Publishing. Cantarello, E., & Newton, A. C. (2008). Identifying cost- effective indicators
to assess the conservation status of forested habitats in Natura 2000
sites. Forest Ecology and Management, 256, 815–826.
Collins, S. L., Carpenter, S. R., Swinton, S. M., Orenstein, D. E., Childers, D. L., Gragson, T. L., … Whitmer, A. C. (2011). An integrated conceptual
framework for long- term social–ecological research. Frontiers in Ecology
and the Environment, 9, 351–357.
Dale, V. H., Joyce, L. A., McNulty, S., Neilson, R. P., Ayres, M. P., Flannigan, M. D., … Michael Wotton, B. (2001). Climate change and forest distur-bances. BioScience, 51, 723–734.
Donohue, I., Hillebrand, H., Montoya, J. M., Petchey, O. L., Pimm, S. L., Fowler, M. S., … Yang, Q. (2016). Navigating the complexity of ecologi-cal stability. Ecology Letters, 19, 1172–1185.
Duffy, J. E. (2009). Why biodiversity is important to the functioning of real- world ecosystems. Frontiers in Ecology and the Environment, 7, 437–444. Evans, P. M., Newton, A. C., Cantarello, E., Martin, P., Sanderson, N., Jones,
D. L., Barsoum, N., Cottrell, J. E., A’Hara, S. W., & Fuller, L. (2017). Thresholds of biodiversity and ecosystem function in a forest ecosys-tem undergoing dieback. Scientific Reports, 7, 6775.
FAO (2012). State of the World’s forests 2012. Rome, Italy: Food and
Agriculture Organization of the United Nations (FAO).
Fares, S., Mugnozza, G. S., Corona, P., & Palahi, M. (2015). Five steps for
managing Europe’s forests. Nature, 519, 407–409.
Forestry Commission (2008). Crown lands management plan 2008–2013.
Lyndhurst: Forestry Commission.
Forestry Commission (2010). Managing ancient and native woodland in
England. Bristol, UK: Forestry Commission England.
Forestry Commission (2015) Adapting England’s woodlands to be more resilient [Online]. UK, Forestry Commission. Retrieved from: https:// www.forestry.gov.uk/forestry/infd-8m6hdl#Ancient%20woodland. Accessed 18 May 2017.
Forestry Commission (2016). New forest inclosures: Forest design plans phase
D. Lyndhurst: Forestry Commission.
Gosal, A. (2016). A multifaceted approach to spatial analysis of ecosystem ser-vices: A case study in the New Forest National Park. Doctor of Philosophy, Bournemouth University.
Greenberg, C. H., & Collins, B. S. (2015). Natural disturbances and historic range of variation: Type, frequency, severity, and post-disturbance struc-ture in central hardwood forests USA. Heidelberg, Germany: Springer International Publishing.
Grimm, V., & Wissel, C. (1997). Babel, or the ecological stability discussions: An inventory and analysis of terminology and a guide for avoiding con-fusion. Oecologia, 109, 323–334.
de Groot, R., Brander, L., van der Ploeg, S., Costanza, R., Bernard, F., Braat, L., … van Beukering, P. (2012). Global estimates of the value of eco-systems and their services in monetary units. Ecosystem Services, 1,
50–61.
Harrison, P. A., Berry, P. M., Simpson, G., Haslett, J. R., Blicharska, M., Bucur, M., … Turkelboom, F. (2014). Linkages between biodiversity attributes and ecosystem services: A systematic review. Ecosystem Services, 9,
191–203.
Hodgson, D., McDonald, J. L., & Hosken, D. J. (2015). What do you mean, ‘resilient’? Trends in Ecology & Evolution, 30, 503–506.
Jenkins, T. A. R., Mackie, E. D., Matthews, R. W., Miller, G., Randle, T. J., &
White, M. E. (2011). FC woodland carbon code: Carbon assessment
pro-tocol. Edingburgh, UK: Forestry Commission.
Jonsson, B. G., Pe’er, G., & Svoboda, M. (2015). Forests: Not just timber plantations. Nature, 521, 32–32.
Lindner, M., Maroschek, M., Netherer, S., Kremer, A., Barbati, A., Garcia-Gonzalo, J., … Marchetti, M. (2010). Climate change impacts,
adap-tive capacity, and vulnerability of European forest ecosystems. Forest
Ecology and Management, 259, 698–709.
Mace, G. M., Hails, R. S., Cryle, P., Harlow, J., & Clarke, S. J. (2015). REVIEW: Towards a risk register for natural capital. Journal of Applied Ecology, 52,
641–653.
Martin, P. A., Newton, A. C., & Bullock, J. M. (2013). Carbon pools recover more quickly than plant biodiversity in tropical secondary forests.
Proceedings of the Royal Society B: Biological Sciences, 280, 20132236. https://doi.org/10.1098/rspb.2013.2236
Martin, P. A., Newton, A. C., Cantarello, E., & Evans, P. (2015). Stand dieback and collapse in a temperate forest and its impact on forest structure
and biodiversity. Forest Ecology and Management, 358, 130–138.
MEA (2005). Ecosystems and human well-being: Synthesis. Island Press,
Washington, DC: Millennium Ecosystem Assessment (MEA).
Met Office (2015) UK climate - Historic station data [Online]. Exeter, UK.
Available:
http://www.metoffice.gov.uk/pub/data/weather/uk/cli-mate/stationdata/hurndata.txt [Accessed 08/12/2016].
Millar, C. I., & Stephenson, N. L. (2015). Temperate forest health in an era of
emerging megadisturbance. Science, 349, 823–826.
Nakagawa, S., & Schielzeth, H. (2013). A general and simple method for
obtaining R2 from generalized linear mixed- effects models. Methods in
Ecology and Evolution, 4, 133–142.
Nash, K. L., Graham, N. A. J., Jennings, S., Wilson, S. K., & Bellwood, D. R. (2016). Herbivore cross- scale redundancy supports response diver-sity and promotes coral reef resilience. Journal of Applied Ecology, 53,
646–655.
National Soil Resources Institute (2007). NATMAPvector, SOILSERIES
agron-omy and hydrology for the New Forest, Hampshire. Silsoe, Bedfordshire, UK: Cranfield University.
Nemec, K. T., Chan, J., Hoffman, C., Spanbauer, T. L., Hamm, J. A., Allen, C. R., Hefley, T., Pan, D., & Shrestha, P. (2013). Assessing resilience in stressed watersheds. Ecology and Society, 19(1), 34. https://doi. org/10.5751/ES-06156-190134
Newton, A. C. (Ed.) (2010). Biodiversity in the New Forest. Newbury,
Berkshire: Pisces Publishing.
Newton, A. C. (2011). Social- ecological resilience and biodiversity conser-vation in a 900- year- old protected area. Ecology and Society, 16(4), 13. https://doi.org/10.5751/ES-04308-160413
Newton, A. C. (2016). Biodiversity risks of adopting resilience as a policy
goal. Conservation Letters, 9, 369–376.
Newton, A. C., & Cantarello, E. (2015). Restoration of forest resilience: An achievable goal? New Forests, 46, 645–668.
Newton, A. C., Cantarello, E., Tejedor, N., & Myers, G. (2013). Dynamics and conservation management of a wooded landscape under high herbi-vore pressure. International Journal of Biodiversity, 2013, 15.
Nimmo, D. G., Mac Nally, R., Cunningham, S. C., Haslem, A., & Bennett, A. F. (2015). Vive la resistance: Reviving resistance for 21st century conser-vation. Trends in Ecology & Evolution, 30, 516–523.
Oliver, T. H., Heard, M. S., Isaac, N. J. B., Roy, D. B., Procter, D., Eigenbrod, F., … Bullock, J. M. (2015). Biodiversity and resilience of ecosystem functions. Trends in Ecology & Evolution, 30, 673–684.
Orwin, K. H., & Wardle, D. A. (2004). New indices for quantifying the re-sistance and resilience of soil biota to exogenous disturbances. Soil Biology & Biochemistry, 36, 1907–1912.
Parton, W. J., Anderson, D. W., Cole, C. V., & Stewart, J. W. B. (1983). Simulation of soil organic matter formation and mineralization in semi-arid agroecosystems. In R. R. Lowrance, R. L. Todd, L. E. Asmussen, & R. A. Leonard (Eds.), Nutrient cycling in agricultural ecosystems (pp. 533– 550). Athens, Georgia: College of Agriculture Experiment Stations, The University of Georgia.
Pautasso, M., Aas, G., Queloz, V., & Holdenrieder, O. (2013). European ash (Fraxinus excelsior) dieback—A conservation biology challenge. Biological Conservation, 158, 37–49.
Peterken, G., Spencer, J., & Field, A. (1996). Maintaining the ancient & orna-mental woodlands of the New Forest. Lyndhurst: Forestry Commission. Pimm, S. L. (1984). The complexity and stability of ecosystems. Nature, 307,
321–326.
Plieninger, T., Hartel, T., Martín-López, B., Beaufoy, G., Bergmeier, E., Kirby, K., … Van Uytvanck, J. (2015). Wood- pastures of Europe: Geographic coverage, social–ecological values, conservation management, and pol-icy implications. Biological Conservation, 190, 70–79.
Pyatt, G., Spencer, J., Hutchby, L., Davani, S., Flethcher, J., & Purdy, K. (2003). Applying the ecological site classification in the Lowlands. Technical paper 33. Edinburgh: Forestry Commission.
R Core Team (2015). R: A language and environment for statistical computing.
Vienna, Austria: R Foundation for Statistical Computing.
Reyer, C. P. O., Brouwers, N., Rammig, A., Brook, B. W., Epila, J., Grant, R. F., … Villela, D. M. (2015). Forest resilience and tipping points at different
spatio- temporal scales: Approaches and challenges. Journal of Ecology,
103, 5–15.
Scheffer, M., Carpenter, S. R., Lenton, T. M., Bascompte, J., Brock, W., Dakos, V., … Vandermeer, J. (2012). Anticipating critical transitions.
Science, 338, 344–348.
Scheller, R. M., Domingo, J. B., Sturtevant, B. R., Williams, J. S., Rudy, A., Gustafson, E. J., & Mladenoff, D. J. (2007). Design, development, and application of LANDIS- II, a spatial landscape simulation model with flex-ible temporal and spatial resolution. Ecological Modelling, 201, 409–419. Scheller, R. M., Kretchun, A. M., Van Tuyl, S., Clark, K. L., Lucash, M. S., & Hom, J. (2012). Divergent carbon dynamics under climate change in forests with diverse soils, tree species, and land use histories. Ecosphere, 3, 110. Scheller, R. M., & Lucash, M. S. (2014). Forecasting forested landscapes: An
introduction to LANDIS-II with exercises. North Charleston, SC, USA: CreateSpace Independent Publishing Platform.
Schielzeth, H. (2010). Simple means to improve the interpretability of re-gression coefficients. Methods in Ecology and Evolution, 1, 103–113. Seidl, R. (2014). The shape of ecosystem management to come: anticipating
risks and fostering resilience. BioScience, 64, 1159–1169.
Seidl, R., Fernandes, P. M., Fonseca, T. F., Gillet, F., Jönsson, A. M., Merganičová, K., … Mohren, F. (2011). Modelling natural disturbances in forest ecosystems: A review. Ecological Modelling, 222, 903–924. Seidl, R., Schelhaas, M.-J., Rammer, W., & Verkerk, P. J. (2014). Increasing
forest disturbances in Europe and their impact on carbon storage.
Seidl, R., Spies, T. A., Peterson, D. L., Stephens, S. L., & Hicke, J. A. (2016). Searching for resilience: Addressing the impacts of changing disturbance re-gimes on forest ecosystem services. Journal of Applied Ecology, 53, 120–129. Simard, S. W., Beiler, K. J., Bingham, M. A., Deslippe, J. R., Philip, L. J., &
Teste, F. P. (2012). Mycorrhizal networks: Mechanisms, ecology and modelling. Fungal Biology Reviews, 26, 39–60.
Spake, R., Ezard, T. H. G., Martin, P. A., Newton, A. C., & Doncaster, C. P. (2015). A meta- analysis of functional group responses to forest recov-ery outside of the tropics. Conservation Biology, 29, 1695–1703. Standish, R. J., Hobbs, R. J., Mayfield, M. M., Bestelmeyer, B. T., Suding,
K. N., Battaglia, L. L., … Thomas, P. A. (2014). Resilience in ecology: Abstraction, distraction, or where the action is? Biological Conservation,
177, 43–51.
Steffen, W., Richardson, K., Rockstrom, J., Cornell, S. E., Fetzer, I., Bennett, E. M., … Sorlin, S. (2015). Planetary boundaries: Guiding human
devel-opment on a changing planet. Science, 347, 1259855. https://doi.org/
10.1126/science.1259855
Teste, F. P., Lieffers, V. J., & Strelkov, S. E. (2012). Ectomycorrhizal commu-nity responses to intensive forest management: Thinning alters impacts of fertilization. Plant and Soil, 360, 333–347.
Treu, R., Karst, J., Randall, M., Pec, G. J., Cigan, P. W., Simard, S. W., … Cahill Jr., J. F. (2014). Decline of ectomycorrhizal fungi following a mountain
pine beetle epidemic. Ecology, 95, 1096–1103.
Trumbore, S., Brando, P., & Hartmann, H. (2015). Forest health and global change. Science, 349, 814–818.
Union, European (2015). Natura 2000 and forests. Luxembourg: Office for
Official Publications of the European Communities.
Usbeck, T., Wohlgemuth, T., Dobbertin, M., Pfister, C., Burgi, A., & Rebetez, M. (2010). Increasing storm damage to forests in Switzerland from
1858 to 2007. Agricultural and Forest Meteorology, 150, 47–55.
Walker, L. R. (1999). Ecosystems of disturbed ground. Amsterdam, The
Netherlands: Elsevier Science.
Warton, D. I., & Hui, F. K. C. (2011). The arcsine is asinine: The analysis of proportions in ecology. Ecology, 92, 3–10.
Weed, A. S., Ayres, M. P., & Hicke, J. A. (2013). Consequences of climate change for biotic disturbances in North American forests. Ecological Monographs, 83, 441–470.
Yarwood, S. A., Myrold, D. D., & Hogberg, M. N. (2009). Termination of belowground C allocation by trees alters soil fungal and bacte-rial communities in a boreal forest. FEMS Microbiology Ecology, 70,
151–162.
Zenner, E. K., Kabrick, J. M., Jensen, R. G., Peck, J. E., & Grabner, J. K. (2006). Responses of ground flora to a gradient of harvest intensity in
the Missouri Ozarks. Forest Ecology and Management, 222, 326–334.
SUPPORTING INFORMATION
Additional Supporting Information may be found online in the supporting information tab for this article.
How to cite this article: Cantarello E, Newton AC, Martin PA,
Evans PM, Gosal A, Lucash MS. Quantifying resilience of multiple ecosystem services and biodiversity in a temperate forest landscape. Ecol Evol. 2017;7:9661–9675.