http://www.scirp.org/journal/wjet ISSN Online: 2331-4249
ISSN Print: 2331-4222
DOI: 10.4236/wjet.2019.71009 Jan. 31, 2019 129 World Journal of Engineering and Technology
Reliable Colour Detection for Matching Repaint
Application
Ibrahim Al-Bahadly, William Wilkinson
School of Engineering and Advanced Technology, Massey University, Palmerston North, New Zealand
Abstract
This paper presents the design and development of a system that creates the optimal conditions to sense colour for matching repaint application. The ef-fectiveness of eliminating, and then recreating the lighting conditions to a de-sired level in a controlled enclosure is explored. The dede-sired artificial light is introduced into the enclosure, providing optimal, constant conditions to measure surface reflectance. The tests conducted showed that the proposed system worked well. The testing results were good and showed that the rela-tive results between samples taken at exactly the same location were an accu-rate match and consistent.
Keywords
Colour Sensing, Paint Analysis, Light Control
1. Introduction
Paint is commonly used to enhance the appearance of cars and buildings, both internally and externally. During its lifetime paint is exposed to a number of sit-uations that can alter its original appearance; these include weather, scratching and graffiti. Scratching and graffiti are typically localised damage. Therefore in theory to restore the affected area to its original appearance a repaint is required with the same paint mixture originally used. However, there is the problem that damage caused by weathering affects the entire painted surface, and its appear-ance is globally altered, requiring the whole surface to be repainted in order to restore its consistent appearance; this method can get expensive depending on the area needing a repaint. Alternatively, an undamaged area of the surface to be repaired can be analysed to obtain its current appearance and a custom paint mixed accordingly. Currently the industry best practice for doing so is manual analysis by a trained artisan who visually matches the colour to a pre-specified
How to cite this paper: Al-Bahadly, I. and Wilkinson, W. (2019) Reliable Colour Detection for Matching Repaint Applica-tion. World Journal of Engineering and Technology, 7, 129-140.
https://doi.org/10.4236/wjet.2019.71009
Received: January 7, 2019 Accepted: January 28, 2019 Published: January 31, 2019 Copyright © 2019 by author(s) and Scientific Research Publishing Inc. This work is licensed under the Creative Commons Attribution International License (CC BY 4.0).
http://creativecommons.org/licenses/by/4.0/
DOI: 10.4236/wjet.2019.71009 130 World Journal of Engineering and Technology range of paint. There are automatic means of analysing the appearance but they are complex and so consequently cost a lot.
During this research work, light was researched, i.e. lighting conditions and their effects on colour. Light is the key source of energy that feeds all life on Earth and we use it to get information about our surroundings and what we are doing. Light is a type of “energy” and is thought of as being carried by photons which are elementary particles, from a basic point of view responsible for the electromagnetic phenomenon [1]. These photons are the transporters of all rays of radiation. The transfer of energy for one photon is described in the equation below:
E = (h∙c)/λ (1) E = Energy transfer of one photon.
h = Planck’s constant = 6.626 × 10⁻³⁴ J∙s.
c = Speed of Light in the medium = 299,792,458 m/s. F = Frequency.
λ = Wavelength of the radiation.
The energy in a wave is proportional to the intensity, frequency and speed of the light.
F∙λ = c (2) This energy can be measured with the use of Cameras, spectrometers, and other commercially available sensors. Sensors usually have different sensitivities to the different wavelengths of light which are usually described in their datasheets.
Al-Bahadly and Berndt [1] reported using LEDs emitting wavelengths that sufficiently overlapped and the intensity of the reflectance from a test piece, sub-jected to each different wavelength measured by an LDR. It was found that the system worked and the reflected wavelengths could be sufficiently sampled, the system was just a prototype and so requires more calibration, testing and elimi-nation of noise to become viable.
Al-Bahadly and Darhmaoui [2] proposed a camera based method for colour detection and associated software to convert RGB colour space to CMYK colour space. It was found that the system gave fairly consistent results at varying view-ing angles, but they note that some factors would influence the results such as light, temperature and cleanness of test piece. They recommend that optimal conditions for image capture be found to better accuracy and that it could be considered a colour constancy problem, in which illumination is kept constant.
pur-DOI: 10.4236/wjet.2019.71009 131 World Journal of Engineering and Technology pose of repainting it needs to give reliable results, which could only be achieved if environmental illumination is kept constant.
Polzer, Gaberl, Davidovic, and Zimmermann [4] proposed a system where a BiCMOS colour sensor is used without colour filters to detect colour illuminat-ing from an RGB LED. The system relies on the fact that silicone has wavelength dependent penetration depths. By taking photocurrent reading at the appropri-ate depths one is able to determine the intensity of red, green and blue light cast on the sensor. Again although this is not directly related to colour detection for the purposes of colour detection with slight modification it could be applied to the application and would also greatly benefit in the application if external illu-mination were to be kept constant.
The paper focused on devising a method for eliminating the ambient light and recreating the desired lighting environment. The method was realised in a varie-ty of different ways and configurations. Each configuration was an improvement of the last, leading to an optimal final design that was used to be used for testing.
Research has been conducted to determine what advancements have been made with respect to colour detection and what applicable technologies are availa-ble. Apart from the current expensive spectrophotometers on sale, the research showed that cheaper alternatives such as those using cameras [2], were unreliable. The reason for this is because they have no control over the lighting conditions in which they analyse the colour. The designed device must solve this problem.
The tests conducted showed that the device/method worked. Samples within tests had little to no colour variation. There were issues with the consistency of the measurement device. The settings in manual mode were not always the same even though they were set to the exact same level, making it difficult to get com-pare between tests run at different times.
2. Background
2.1. Light and Colour
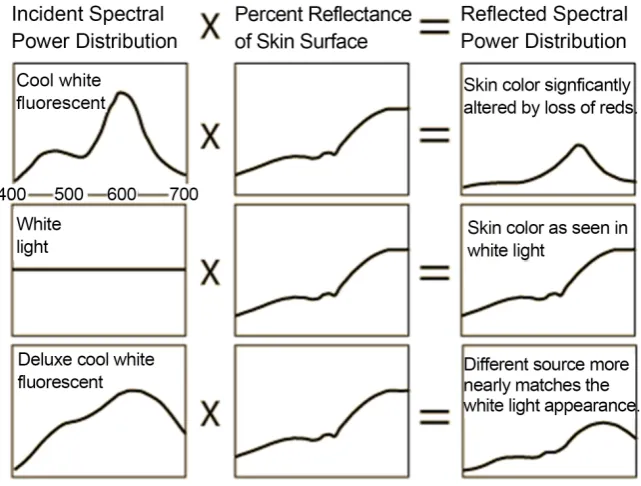
Light is responsible for the colour we see. Lights electromagnetic wavelength falls between 380 nm (violet) and 780 nm (red) [5]. White light is made up of approximately equal proportions of all visible wavelengths. When these shine on or through an object, some wavelengths are absorbed while other are reflected or transmitted.
If the white light source is deficient in the wavelength that a surface reflects, the colour of the surface will appear different to what it should be. This can be clearly seen in Figure 1 where the reflected spectral power distribution changes as the incident spectral power distribution changes. The reflected spectral power distribution is only the same as the percent reflectance if the incident spectra are evenly distributed [6].
2.2. Selecting a Source of White Light
DOI: 10.4236/wjet.2019.71009 132 World Journal of Engineering and Technology Figure 1. Effect of incident spectra on the reflected spectra.
years, the sources of choice for colour reproduction have been sunlight and tungsten-based light [7]. Both these lighting sources have a relatively even dis-tribution of energy across the spectrum with no large troughs or peaks in output at any wavelength in the visual band. This makes them great sources of illumina-tion if colorimetric accuracy is desired since they both have a colour rendering index (CRI) of 100 [8], this is shown in Table 1.
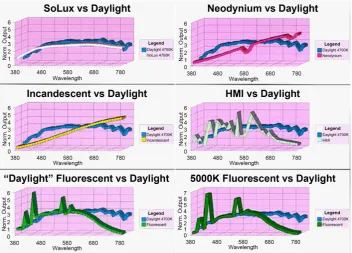
According to [8], Figure 2 shows the use of a tungsten bulb is the common choice for colorimetric accuracy. They generally have lower spectral distribution in the lower wavelengths (blue light). This gives the yellow appearance of most tungsten filament bulbs.
This is not true for all tungsten based lights. There is a series of Tungsten ha-logen bulbs currently made by Tailored lighting, Inc. called SoLux that has a spectral distribution closely matching that of the sun as demonstrated in Figure 3 while having a CRI of 99+ [9].
3. System Design
DOI: 10.4236/wjet.2019.71009 133 World Journal of Engineering and Technology Table 1. CRI of common light sources.
Source Max Output (lm) Efficacy (lm/W) CCT (K) CRI (Ra) Worst (Ri)
Daylight Not applicable Not applicable 5000 - 7000 100 100 Tungsten 5000 20 ~2860 100 100 Tungsten Halogen 45,000 30 3200 - 3400 100 100 Xenon 700,000 35 - 50 5600 - 6300 90 - 95 86 - 92
HMI 2,400,000 85 - 108 5600 - 6000 80 - 90 75 - 82 Fluorescent 3650 60 - 70 5500 - 6500 85 - 97 89 - 96 LED* 320 - 1000 160 - 100 5000 - 7000 72 - 97 50 - 92
[image:5.595.271.476.248.419.2]*Efficacy reduces with increasing power.
Figure 2. Spectral distribution of common light sources.
[image:5.595.186.539.453.706.2]DOI: 10.4236/wjet.2019.71009 134 World Journal of Engineering and Technology
3.1. Mechanical Design
An enclosure with artificially introduced lighting concept will be used to consis-tently analysecolour. There are many aspects that must be designed and tested for it to give the desired reliable results.
The focus of this research work is to verify the use of an enclosure that elimi-nates light and introduces new light as a reliable environment for colour detec-tion. Detection within the environment should be able to give the same results on the same surface and location, irrespective of when it is tested and the exter-nal lighting conditions it is tested in. Therefore, the lighting used was not the optimal lighting to be used if exact colour was to be rendered, nor was the use of an iPhone camera intended to be the analysis device if exact colour were to be detected.
The lighting used allowed the effective testing of the lighting location on the surface reflectance. The lighting conditions could be repeated, giving the same re-sults. It was easy to change the location of the bulbs and test what effect this had.
The iPhone camera was used with its settings in manual mode to analyse the reflectance of the surface at a certain location within the enclosure. It was, as with the lighting able to give accurate results relative to the previous samples in the same test, but not of the actual colour without further calibration which is outside the scope of this project. The use of an iPhone camera introduced many design elements into the enclosures designed. The height, width and depth were all determined by the cameras field of view and focal length respectfully. If a simple RGB sensor were used for the detection device, the dimensions of the en-closure would have been drastically reduced.
3.2. Design Testing
To test the qualitative performance of the designs, three surfaces were chosen with different properties. A textiles surface in the form of a purple t-shirt (Figure 4(a)) was chosen to determine the performance of a matt surface where little direct light reflectance is expected. An artificial wood vinyl surface (Figure 4(b)) was chosen to determine the devices performance on a medium gloss sur-face where some direct light reflection is expected. A shiny blue folder (Figure 4(c)) was chosen to determine the performance of the device on a high gloss surface where a lot of direct light reflection is expected. This high gloss surface was chosen due to it similarity to the gloss level of a typical cars paint job.
4. Prototyping and Final Design
DOI: 10.4236/wjet.2019.71009 135 World Journal of Engineering and Technology
[image:7.595.213.537.69.224.2](a) (b) (c)
[image:7.595.303.443.269.407.2]Figure 4. Test surfaces used to evaluate prototype performance; (a) Purple t-shirt, (b) Wooden desk, (c) Blue folder.
Figure 5. Bad point lighting from the first prototype.
Prototypes two and three used three tungsten filament bulbs coming from the top of the enclosure, and passed through a diffuser.
Prototype two still had point lighting, and even though it wasn’t as bad as the first porotype it presented no clear sampling area where the surface reflectance stayed constant.
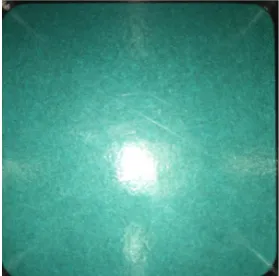
Prototype three improved on prototype two by incorporating reflectors be-hind the diffuser to distribute the lighting around better. While this did distri-bute the lighting better, it resulted in a large area of direct light reflectance, and only left a small area that would be appropriate for sampling as shown in Figure 6.
The final design came after the third prototype and is called the final design as it gave the best results.
DOI: 10.4236/wjet.2019.71009 136 World Journal of Engineering and Technology Figure 6. Improved point lighting of prototype three.
(a) (b) (c)
Figure 7. Final enclosure design; (a) Top view, (b) Bottom view lights-off, (c) Bottom view lights-on.
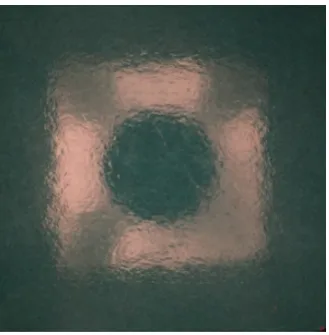
The surfaces as shown in (Figure 8(a) and Figure 8(b)) don’t show clear areas of constant illumination, the area of constant illumination for these sur-faces will be the same as the defined area. However, Figure 8(c) shows that there is now a larger, square area where lighting does not change. This area would be large enough to average and get an accurate colour reading from.
5. Results and Discussion
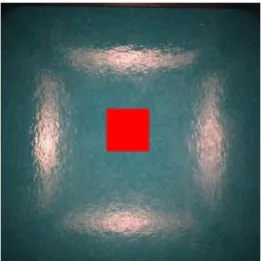
To get quantitative results for the chosen design, MATLAB was used. A program was written that takes a jpeg image and extracts the red, green and blue channels into their respective arrays. The arrays are then iterated through at a desired lo-cation and the red green and blue values averaged to return their respectful av-eraged results. The avav-eraged area is shown as the red square in Figure 9.
[image:8.595.214.533.267.423.2]DOI: 10.4236/wjet.2019.71009 137 World Journal of Engineering and Technology
[image:9.595.214.537.73.194.2](a) (b) (c)
[image:9.595.308.439.237.368.2]Figure 8. Final design test results; (a) Purple t-shirt test, (b) Wooden desk test, (c) Blue folder test.
Figure 9: Colour Sample area for test pieces.
The iPhones built in camera app sets white balance, shutter speed and ISO speed automatically to what it thinks it should be to get an optimal photo. This is a problem if you want consistent results because these setting will change from one surface to another. Therefore, two-third-party app was used on the iPhone to control the white balance, shutter speed and ISO speed. Unfortunately, both apps were not reliably able take photos that with the same colour balance even with the settings set to the same for all photos. If the camera had been looking at a bright object in automatic mode before it was set to manual mode and the set-tings changed to the desired level, the resultant image would be brighter than if it had been looking at a dark object in automatic mode before being set to ma-nual mode and the settings taken to the same desired levels.
Once the camera is set to manual mode, all the images taken during this time were found to have the same characteristics and could be compared with one another to determine relative colour accuracy.
5.1. Blue Folder Different Locations
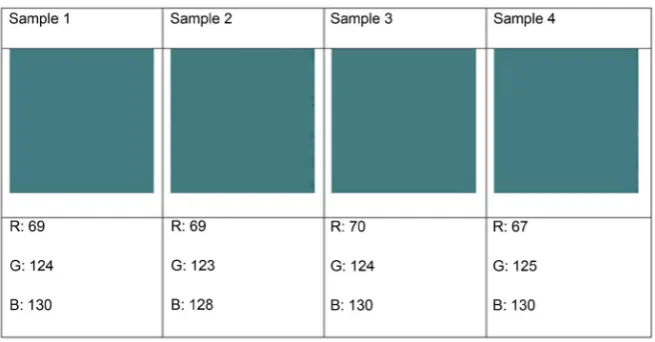
Figure 10 shows the average colours of the samples taken at different locations on the blue folder one after another with the lights in the room on.
DOI: 10.4236/wjet.2019.71009 138 World Journal of Engineering and Technology Figure 10. Blue folder colour samples taken at different locations with the room lights-on.
Colour depth= 256 × 256 × 256 = 16,777,216 colours (3) The discrete colours possible due to the variation in the sample RGB values:
Possible colour levels between samples= 4 × 3 × 3 = 36 colours (4) So the results varied by 36 out of a possible 16,777,216 colours, the percentage difference:
Difference = (36 × 100)/16,777,216 = 0.0002% (5)
5.2. Blue Folder Same Location Lights-On
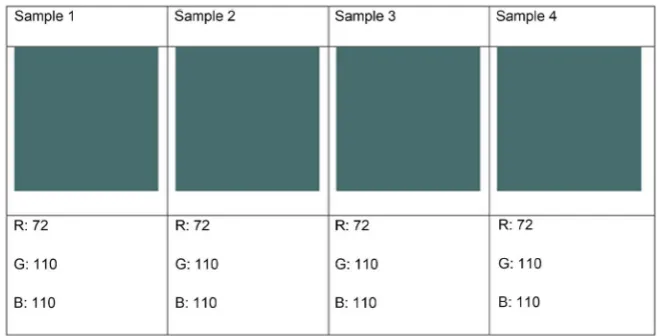
Figure 11 shows the averages of the samples taken at the same location. Consec-utive samples were taken at the location with the room lights on and then with the room lights off. Each sample was a minute apart.
The results vary quite a bit from those of the samples taken at different loca-tions. This is due to the manual control issues with the camera as explained in Section 4. The results were really good when looking at them, there was no vari-ation between samples.
5.3. Blue Folder Same Location Lights-Off
The result with the lights-off varies with the lights-on but, again there was no variation between samples as shown in Figure 12.
5.4. Overall Discussion
The results of all the tests were good. The tests have shown that the relative re-sults between samples taken at the same location were a 100% match. Since both the lights on and light off at the same location had no variation between them, the variation between samples in the varying locations test, can be put down to differences in the actual surface reflectance at those different locations.
DOI: 10.4236/wjet.2019.71009 139 World Journal of Engineering and Technology Figure 11. Blue folder colour samples taken at the same location with the room lights-on.
Figure 12. Blue folder colour samples taken at the same location with the room lights-off.
lights would decrease all some of RGB values, however the red and green chan-nels were one value higher each. It may be because the enclosure moved slightly after turning of the lights and so a slightly different location was sampled.
6. Conclusion
DOI: 10.4236/wjet.2019.71009 140 World Journal of Engineering and Technology
Conflicts of Interest
The authors declare no conflicts of interest regarding the publication of this pa-per.
References
[1] Al-Bahadly, I.H. and Berndt, R. (2010) LED-Based Colour Sensing System. Sensors & Transducers Journal, 114, 132-150.
[2] Al-Bahadly, I. and Darhmaoui, H. (2005) Automatic Colour Detection for Car Re-painting. Third International Conference on Information Technology and Applica-tions (ICITA’05), Sydney, 4-7 July 2005, 623-628.
https://doi.org/10.1109/ICITA.2005.80
[3] Li, S. and Pandharipande, A. (2015) LED-Based Color Sensing and Control. IEEE Sensors Journal, 15, 6116-6124. https://doi.org/10.1109/JSEN.2015.2453408 [4] Polzer, A., Gaberl, W., Davidovic, M. and Zimmermann, H. (2011) Integrated
Fil-ter-Less Bicmos Sensor for RGB-Led Color Determination. SENSORS, 2011 IEEE, Limerick, 28-31 October 2011, 1937-1940.
https://doi.org/10.1109/ICSENS.2011.6126957
[5] Dhir, A. (2004) The Digital Consumer Technology Handbook: A Comprehensive Guide to Devices, Standards, Future Directions, and Programmable Logic Solutions. Elsevier Science, Oxford.
[6] Williamson, S.J. and Cummins, H.Z. (1983) Light and Color in Nature and Art. John Wiley & Sons, Inc.,Hoboken.
[7] Tooms, M.S. (2016) Colour Reproduction in Electronic Imaging Systems: Photog-raphy, Television, Cinema. John Wiley & Sons, Inc., Chichester.
[8] Spring, K.R. and Davidson, M.W. (2018) Sources of Visible Light.
http://www.olympusmicro.com/primer/lightandcolor/lightsourcesintro.html [9] Tailored Lighting, I. Spectra of SoLux Halogen Bulb.
https://www.solux.net/edu9.htm
[10] Abdellatif, M., et al. (1996) Measurement of True Object Colors by Using the Re-flection of a Sub-Surface. Robotics Mechatronics Kouenkai.
[11] Li, M., et al. (2015) A Dual-Use Imaging System for Pre-Clinical Small Animal Ra-diation Research. 2015 37th Annual International Conference of the IEEE Engi-neering in Medicine and Biology Society (EMBC), Milano, 25-29 August 2015, 6904-6907.
[12] Das, A. (2015) Guide to Signals and Patterns in Image Processing: Foundations, Methods and Applications. Springer International Publishing, Berlin.
MASSEY RESEARCH ONLINE
http://mro.massey.ac.nz/
Massey Documents by Type Journal Articles