This is a repository copy of Using attitudinal information to explore preferences toward compulsory public health programmes: a willingness to pay study.
White Rose Research Online URL for this paper: http://eprints.whiterose.ac.uk/43221/
Monograph:
Dixon, S (2011) Using attitudinal information to explore preferences toward compulsory public health programmes: a willingness to pay study. Discussion Paper. HEDS Discussion Paper (11/11). (Unpublished)
[email protected] https://eprints.whiterose.ac.uk/
Reuse
Unless indicated otherwise, fulltext items are protected by copyright with all rights reserved. The copyright exception in section 29 of the Copyright, Designs and Patents Act 1988 allows the making of a single copy solely for the purpose of non-commercial research or private study within the limits of fair dealing. The publisher or other rights-holder may allow further reproduction and re-use of this version - refer to the White Rose Research Online record for this item. Where records identify the publisher as the copyright holder, users can verify any specific terms of use on the publisher’s website.
Takedown
If you consider content in White Rose Research Online to be in breach of UK law, please notify us by
HEDS Discussion Paper 11/11
Disclaimer:
This is a Discussion Paper produced and published by the Health Economics and Decision Science (HEDS) Section at the School of Health and Related Research (ScHARR), University of Sheffield. HEDS Discussion Papers are intended to provide information and encourage discussion on a topic in advance of formal publication. They represent only the views of the authors, and do not necessarily reflect the views or approval of the sponsors.
White Rose Repository URL for this paper:
Once a version of Discussion Paper content is published in a peer-reviewed journal, this typically supersedes the Discussion Paper and readers are invited to cite the published version in preference to the original version.
Published paper None.
Using attitudinal information to explore preferences toward compulsory public health
programmes: a willingness to pay study
Simon Dixon
Health Economics and Decision Science (HEDS), School of Health and Related Research,
University of Sheffield, Regent Court, 30 Regent Street, University of Sheffield, UK.
T: +44 (0)114 222 0724
F: +44 (0)114 272 4095
Abstract
Contingent valuation studies continue to be controversial due to easily identifiable biases
and applied work failing simple tests of validity. One avenue of work that has shown some
promisng results, however, is the examination of attitudes within contingent valuation.
Whilst a few studies have investigated the role and impact of respondent attitudes on
willingness to pay responses, these have not been brought together within a single
framework, nor applied to health-related goods. In this study, a framework is developed
that generates attitude statements from qualitative research and then applies them to a
contingent valuation study. The attitude statements are used to generate factors that are
then used in explanatory analyses of respondents‘ support for one of four public health
schemes and their associated willingness pay (WTP). Collecting attitude data before
preference elicitation increases protests and decision uncertainty. The factors, including
‘warm glow‘, have an explanatory effect on respondent WTP although some scale
insensitivity remains. A different pattern of factor involvement is observed between the
policy vote for or against the programme compared to that for WTP. These differences are
consistent with a view of bounded rationality that suggests that the WTP responses are
1. Introduction
The contingent valuation (or willingness to pay) methodology is a survey-based approach
for deriving the monetary value for goods, whereby respondents are asked questions with
the intention of deriving a maximum willingness to pay for a good. The willingness to pay
technique has its roots in welfare economics, and is one of the main approaches used in the
valuation of non-market goods as part of cost-benefit analysis.
Contingent valuation methods (CVM) have been heavily criticised for being prone to
several sources of bias (Baron, 1997). Despite these problems, the need for valuations has
spurred researchers to continue developing and testing new methods. One area where this
has been apparent is the use of attitudinal data to produce improved estimates of
respondent values. The use of such data is not new – the recommendations of the National
Oceanic and Atmospheric Administration (NOAA) panel included the collection of data on
attitudes to help explain differences in WTP between respondents (Arrow et al., 1993).
Such explanatory analyses can then be used as a test, albeit a weak one, of validity.
Several studies have explored the role of attitudes within the context of CVM. Most
prominent among these are the attempts to apply attitude-behaviour frameworks to either
to test the validity of responses or generate more valid responses. Ajzen and Driver (1992),
for instance, examined the extent to which the theory of planned behaviour could be used
to explain WTP responses relating to leisure activities and identified strong correlations
between attitudes and WTP. Interestingly, however, the size and statistical significance of
the relationship substantially diminished when moral satisfaction was included within the
regression specifications.
In a less theory driven exploration of the role of attitudes on WTP responses, Pouta (2004)
assessed the extent to which gathering attitudes and beliefs can impact on the self-assessed
quality of WTP responses of survey participants. This work is related to previous
criticisms of CVM which claim that the WTP values do not reflect robust preferences, but
affective responses to an unfamiliar task (Gregory et al., 1993; Shiell and Gold, 2003).
One way to achieve deliberation and reflection would be to collect attitudinal information
consider the individual attributes of the good under investigation and their importance.
Pouta (2004) found that the collection of attitude and belief data prior to a closed-ended
WTP task increased mean WTP, but reduced self-assessed decision quality. However, the
question of whether this approach produced more valid WTP estimates was not addressed.
Nunes and Schokkaert (2003) used attitudinal information differently, by using factor
analysis to identify latent constructs that had an explanatory role in WTP responses.
Further to this weak test of validity, the authors also identified a factor that was considered
to reflect ‘warm glow’ and once this was used to adjust the results, the WTP response
passed the adding up test (Diamond et al., 1993) which is considered to be a much stricter
test of validity.
Whilst these applications have examined very precise questions, it may be possible to
develop from their work an approach that is more generalisable. Consequently, this paperI
combines the essential features of Pouta (2004) and Nunes (2002) into a single study
design that allows the examination of the role of attitudes in generating and interpreting
WTP values. This approach is then tested by applying it to the valuation of four separate
public goods relating to health.
This paper assesses what effect this process has on responses in several ways. Firstly, it
examines whether the collection of attitude data prior to preference elicitation has an
impact on responses and quality of response. Secondly, it assesses the validity of the WTP
data that have been collected, and assesses whether the degree to which validity has been
affected by the collection of attitude data. Thirdly, it examines whether respondent
attitudes have any explanatory power with respect to preferences as measured by WTP and
policy vote responses.
2. Method
Four public health interventions were valued in the survey. They were; fluoridation of
water, fortification of flour with folic acid, 20 miles per hour urban speed limits and
banning smoking in public places.1 The four policy descriptions were based on reviews of
evidence in order to identify the most plausible estimates of impact. The descriptions were
developed in order to capture the salient features of the interventions, including their
processes, outcomes and potential adverse effects. Each description was assessed for
readability and shown to have Flesch Kincaid Grade Level scores of less than 10, which
indicates that they are comprehensible by 14-16 year olds (Kincaid, 1975). The
descriptions are shown in Appendix A.
2.2 Sampling
The survey was administered by professional interviewers. A target of two hundred
members of the general public was set for each intervention. Four electoral wards from a
large city in England were selected purposively to include a range of socio-demographic
features, and streets within them were selected at random. Interviewers then approached
houses within the selected streets, and if there was no reply, they moved on to the next
house.
For each intervention, there were four versions of the survey instrument, and these were
administered at random to respondents. Consequently, it was expected that each version
would be administered to around 50 people. The four versions were:
• Attitude scales prior to preference elicitation, and central estimate of effectiveness.
• Attitude scales after preference elicitation, and central estimate of effectiveness.
• Attitude scales prior to preference elicitation, and low estimate of effectiveness.
• Attitude scales after preference elicitation, and low estimate of effectiveness.
2.3 WTP questions
The WTP sections of the instrument were based around that used in two pilot studies
(Dixon and Shackley, 2003; Shackley and Dixon, 2000), which in turn were based on those
of the EuroWill project (Donaldson, 1999). Firstly, a description of the policy was read,
with a copy given to the respondent. Respondents were then asked whether they would be
in favour of the policy or not, whether they were indifferent or didn’t know; this is
1
subsequently referred to as the ‘policy vote’. If they were in favour, they were asked if
they would be willing to pay for the policy to go ahead, and if willing, how much was the
maximum they would be willing to pay. Reasons why they would, or would not be willing
to pay were collected in open text format. If they were opposed to the policy they were
asked if they were willing to pay, their willingness to pay, and reasons for response.
For those opposed to the scheme, the rationale for being willing to pay varied between
fluoridation and the other policies. For fluoridation, the payment was needed to install and
maintain de-fluoridation equipment in the person’s home. For the other policies, the
payment was to “ensure that the policy does not go ahead”. Very few respondents that
were opposed to the scheme were willing to pay, and so these responses are not reported
here in order to simplify the analysis and its interpretation.
The payment vehicle was taxation with annual payments and was the same for all
programmes. The elicitation method was a payment card, which has been shown to avoid
some of the problems associated with dichotomous choice questions (Ryan et al., 2004).
On the payment scale, participants were asked to mark all the values that they definitely
were, or were not, willing to pay which could mean leaving several values unattributed.
The payment range indicated by the unattributed values could then be used as a measure of
uncertainty relating to their valuation.
2.4 Attitudes
A set of attitude scales were derived from a series of six focus groups with members of the
general public. Their derivation and content are described elsewhere (Dixon, 2010), but
are summarised here for convenience. The scales were developed from a qualitative
analysis of the focus group transcripts and facilitator notes using the framework approach
(Richie and Lewis, 2003). The scales were generated to match the theme and sub-themes
from the qualitative analysis and also written to give a mixture of positive and negative
scales. After piloting, the final list of attitude scales consisted of 43 statements that were
answered on a five point scale; strongly agree, agree, neither, disagree, strongly disagree.
To this was added five statements that were classified as relating to warm glow in the work
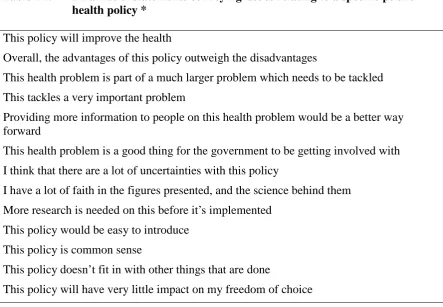
An examination of the statements revealed that for the purposes of the WTP survey, three
separate groups were identifiable. Statements that convey general issues relating to public
health (e.g. ‘Individual responsibility is the key to good health’). Statements that convey
issues relating to a specific public health policy (e.g. ‘This policy would be easy to
introduce’). Statements that had the potential to bias responses by evoking thoughts not
related to the consequences of the scheme. For example, ‘The financial cost of this policy
will be very high’ may encourage the use of a heuristic based around cost, whilst ‘It is
difficult for me to refuse to help people who beg for charity’ may encourage social
desirability bias and warm glow. These three groups are referred to as general, specific and
cost, charity and taxation attitude statements, respectively.
It is important to differentiate between these different types of questions as they affect the
position of the questions within the interview schedule. Statements without a specific
policy focus can come before the policy description, whereas those related to a specific
policy must come after the policy description. Statements that may encourage a bias must
come after the WTP questions in all versions of the survey. The full set of statements and
how they fit into this categorisation are given in Appendix B.
2.5 Decision quality
In line with Pouta (2004) decision quality was assessed using a set of four self-completed
items relating to perceived difficulty in the decision problem, perceived information load,
confidence with decision and satisfaction with decision. However, within this study, two
pieces of preference information are gathered from separate questions; direction of
preference is elicited from the policy vote question, whilst magnitude of preference is
elicited from the WTP question. Consequently, decision quality was assessed after both
preference questions.
2.6 Interview schedule
The interview schedule consisted of the following elements:
• Introduction
• Policy description
• Policy vote question
• WTP question
• Decision quality statements
• Attitude statements relating to general issues
• Attitude statements having a specific policy focus
• Attitude statements relating to cost, charities and taxation
• Demographics and interviewer perceptions of respondents interest/seriousness in
the survey
The ordering of these differed between those who received the attitude statements before
the WTP questions, and those who received them after the WTP questions. The ordering
above relates to those respondents described as receiving the attitude statements 'after' the
WTP responses. For those receiving the statements 'before' the WTP question, the general
statements were given before the policy description, the specific statements were then
given after the policy description followed by the WTP questions. The cost, charities and
taxation statements were given after the WTP questions.
3. Analysis
Respondent characteristics were compared with those of the UK population. Open text
responses for not being willing to pay and reasons for being willing to pay, were coded
according to a simple thematic analysis based on the responses themselves. Prior to the
analysis of WTP estimates, it was necessary to categorise the open text response relating to
the reasons why people were not willing to pay. Of particular importance is the need to
identify ‘protests’ from ‘true zeros’, as protest responses are necessarily excluded from the
analysis.
Initially, descriptive analyses were undertaken to report summary statistics and make
comparisons across schemes. Univariate analyses were then undertaken to assess
differences between respondents the 'before' and 'after' sub-samples. Comparisons of
proportions were undertaken using chi-squared and Kruskal-Wallis tests. Comparison of
continuous data used analysis of variance and Mann-Whitney tests.
Explanatory analysis was based around multivariate regressions of WTP. Interval
colleagues (1998) that identified this as the most appropriate approach for payment card
data. Mis-specification was tested for using the RESET command within STATA which
uses second, third and fourth powers within the auxilliary regression. An additional
multivariate analysis was undertaken on the policy vote using logistic regression. The
same explanatory variables as used in the WTP regressions were entered into these
regressions.
Within the regressions, attitudes were measured using four factor scores derived from the
responses to the attitude statements. The process of deriving these factors is described in a
previous paper (Dixon, 2010). In summary, an orthogonal rotation was undertaken and a
four factor solution adopted based on examination of its associated scree plot. The first
factor was interpretted as reflecting a respondent’s view that the named scheme is clearly
good or bad across several defining characteristics. It encapsulates notions of the scheme
saving money, having no uncertainties, not affecting freedom of choice, being the best way
to tackle the problem, etc. The statement with the highest loading on this factor - “This
policy is common sense” - is used to generate its label; ‘common sense’. The second
factor appears defined by general attitudes and beliefs which were not directed toward the
specific scheme under consideration. The most highly loaded statements relate to the role
of government; this is labelled henceforth as ‘government’. The third factor mirrors Nunes’
warm glow factor, so consequently, this is labelled ‘warm glow’. The fourth factor appears
to relate to the notion of rights and responsibilities; information for individuals, liberty and
freedom from side-effects. The most highly loaded statements reflect general attitudes and
beliefs without reference to a specific scheme. This factor is labelled henceforth as ‘rights
and responsibilities’.
After the survey was completed, examination of responses showed very high levels of
missing data relating to income (43%). As this variable is central to the test of validity,
income band was imputed for those respondents refusing to provide this, by using
multinomial regression and associated sociodemographic variables that were not used in
the subsequent multivariate analyses. Validity of WTP responses was to be assessed by
signs on independent variables within the regressions matching expectations and providing
Central to this is size of the health benefit associated with the scheme, as this equates to a
scope test.
4. Results
4.1 Survey sample
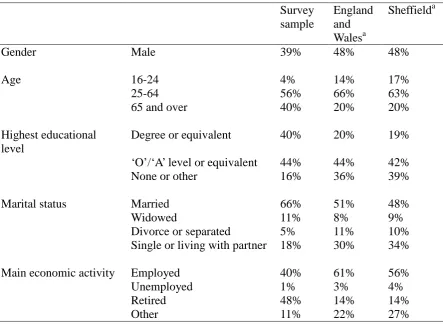
Eight hundred and sixty four people were interviewed, with the sample showing marked
differences from the general adult population in England and Wales as described by the
2001 census (Table 1). The survey sample has a higher proportion of females, people over
the age of 65, people holding degrees or equivalent qualifications, and a lower proportion
of single people. Interviews were undertaken in 2007.
4.2 Descriptive and univariate analysis
Marked differences were seen between the four schemes in terms of their direction of
preference (i.e. the response to the policy vote question), with p<0.001 using a Chi-squared
test. Higher levels of support were seen for speed limits and banning smoking in public
places, with the lowest level of support seen for folic acid (Table 2). The mean willingness
to pay, and the distribution of values, for those in favour of the scheme differ across the
four schemes (Table 3), p<0.001 analysis of variance and p=0.013 Kruskal-Wallis test.
When the individual schemes are considered, there is weak evidence that positioning
attitude questions before the policy vote changed responses for the folic acid policy
(p=0.06), but not for any other scheme (Table 2). Looking across all schemes in
combination, the impact of the attitude questions on policy vote response was statistically
significant (p=0.02), with the proportion of respondents supporting the scheme reduced by
around three percentage points when the attitude questions precede the policy vote. The
impact of the attitude questions on WTP responses is not statistically significant for
individual schemes, or all schemes in aggregate (Tables 3).
The timing of the attitude questions has a clear impact on the quality of the policy vote for
fluoridation and smoking, with questions preceding the vote reducing the mean quality
score for those in favour of the scheme (Table 2). Looking across all schemes, pre-vote
favour of the scheme (p<0.01), although only by 0.21 points on a seven point scale (Table
2). There is weak evidence that positioning attitude questions before the WTP question
impacts on the perceived quality of the response for those in favour of fluoridation (Table
3), with the quality score reducing by around 0.4 points (p=0.05 Mann-Whitney test). For
all other schemes, and all schemes in aggregate, no evidence of a significant impact is seen.
The rate of protests across the four policies (combining before and after questionnaires)
ranges from 17.6% for folic acid to 39.7% for banning smoking in public places. There is
no clear evidence that the timing of attitude questions impacts on rates of protest for
individual schemes(Table 4). However, when assessing its impact across all schemes there
is a statistically significant difference from 31.9% to 40.2% (p=0.04, Table 3).
4.3 Multivariate analysis
The variables used within the regressions are listed in Table 4. Within the interval
regressions, few of the sociodemographics variables are statistically significant and only in
the case of smoking is respondent income associated with willingness to pay (Table 5).
The size of each programme’s effect is statistically significant in only one case and
statistically significant when modelled as an interaction with the timing of the attitude
questions (which indicates a higher WTP when the health effect is bigger and attitudes are
assessed prior to elicitation of WTP). This indicates that the pre-WTP questions increase
the sensitivity to scope for this scheme.
The attitudes of respondents do, however, have an impact on WTP for three of the four
programmes, with each factor playing a role in at least one of the schemes. Warm glow is
positively related to WTP for the folic acid and speed limit programmes.
There is also evidence that the interviewer influences WTP responses for all of the schemes.
The coefficients relating to the eight interviewers are not shown in the Tables in order to
simplify the results, however, they represent the largest impact on reported WTP for three
out of the four schemes, and greater than the scope effect in all schemes.
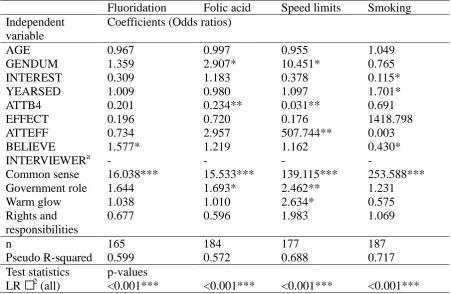
When the multivariate analysis of the policy vote question is considered, three findings are
significant for any policy which suggests the lack of scope effects for the policy vote
(although the very large coefficient for the smoking scheme would suggest an important
effect). Secondly, the statistically significant interviewer effects that are seen in the WTP
regressions have disappeared. Thirdly, there is a consistent pattern of influence from the
factors, with strong evidence of ‘common sense’ being associated with direction of
preference.
5. Discussion
The univariate results show that statistically significant differences are evident between
schemes both in their level of support and the willingness to pay for those in favour of the
scheme. The collection of attitude and belief information before the policy vote and WTP
questions also appears to have an impact. Whilst this impact is not clearly discernible for
individual schemes, across all schemes it appears that the collection of attitude and belief
information reduces support for schemes and the quality of the policy vote. Introducing
attitude scales prior to the WTP question also appears to increase protests, which
effectively removes further people with a clear direction of preference from the analysis;
this increases the susceptibility of the aggregate results to bias.
The attitudes of respondents have an explanatory effect on direction of preference and
intensity of preference. The role that these effects have is reasonably consistent when
considering the direction of preference, with the ‘common sense’ factor dominating the
explanatory effect. However, a different pattern of influence is apparent when the WTP
data are examined with the other three factors having greater prominence.
However, the validity of the WTP responses, as a measure of intensity of preference, is
called into question by the tests of validity which show a lack of statistically significant
associations with income and size of the health benefit across all schemes. Furthermore,
the estimated effect sizes associated with income and ‘scope’ are less than that seen by the
impact of the interviewer on reported WTP. Notably, interviewer effects are not apparent
with the policy vote responses, nor too, is a scope effect for the majority of the schemes.
5.1 Survey instrument
The high rates of protests - 25.7% to 44.0% when the attitude statements are given before
elicitation - call into question the validity of the mean and aggregate WTP values for the
schemes. These compare unfavourably with the protest rates of around 12% seen in the
EuroWill study (Shackley and Donaldson, 2002). The reason for the difference between
the protest rates reported in this study and EuroWill could lie in possible differences in the
survey instruments, the sample and/or the good being valued.
Given the similarity in the EuroWill instrument and the designs used in this study, it does
not appear that this has contributed to the differential protest rates. Differences in sample
may explain some of the difference as the level of protests can be partly explained by the
respondent characteristics. However, given the widely different protest rates between the
schemes in this study, it appears that the main cause of the high protest rates lies in the
nature of the good being valued. It is possible that the schemes relate to protected values
that individuals do not wish to put a price on (Baron and Spranca, 1997).
5.2 Survey responses
When examining WTP for those in favour of the policy, differences can be identified.
Mean WTP is lowest for fluoridation, then 72% higher for speed limits, 87% higher for
folic acid, and 108% higher for banning smoking in public places. In comparison, the
United Kingdom EuroWill results showed smaller differences in mean response between
schemes; additional cancer services were valued 33% and 29% higher than community
care services using the standard and marginal questionnaires, respectively (Shackley and
Donaldson, 2002).
5.3 Reasons for being willing to pay
The open text comments to the questions asking about reasons why people would be
willing to pay are a rich source of information; over 6,000 words were recorded across the
sample explaining their reasons why they would be willing to pay in order to support or
oppose the scheme. A simple thematic analysis of these identifies the importance of health
benefits, ‘equity’ (e.g. relating the benefits to specific vulnerable population groups),
by the scheme. Many responses also provide some insight into the processes that
respondents used to generate their WTP response, for example, the use of mental
accounting, the search for a fair price and the use of cost-based heuristics. As such, these
data support the findings of Shiell and Gold (2002).
5.4 Impact of attitude questions
Placing attitude questions before the policy vote and willingness to pay question appears to
reduce support across the four schemes and increase the proportion of respondents
protesting. This may be due to the attitude questions raising important issues, such as,
rights, responsibilities and side-effects, which are otherwise ignored by respondents who
are faced with a policy issue without time to reflect on its true nature. Alternatively, it
could be seen as the effect of a bias induced by the questions themselves. Raising various
non-health issues could trivialise or obscure the benefits of the schemes, such that the more
emotive issues have undue influence on a respondent’s answers.
Whilst the latter explanation is possible, the attitude statements were derived in ways that
reflected those issues that were raised by members of the public, as opposed to deliberately
emotive issues. They were also framed in a mix of positive and negative formats, and
included statements giving attention to the benefits of the scheme. Consequently, I feel
that the use of attitude statements did not produce a bias in the sense that they provided a
false emphasis to negative aspects of the schemes.
Understanding the reasons why protests increased is important. If it is due to ‘illegitimate
reasons’, such as obscuring the health benefits of the scheme or overemphasising negative
aspects of the schemes, then it is clear that the questions need to be removed. However, if
it is due to legitimate reasons, such as helping respondents develop/interpret their own
preferences more fully, then we have a dilemma; better informed values are achieved at the
expense of greater protests (and lower decision quality).
Whilst the results indicate that mean WTP is unaffected by the timing of the attitude scales,
this may be an artefact of the higher rates of protest associated with collecting attitudinal
data prior to the WTP question. For example, protesting may be associated with very
attitudinal data before the WTP data may have the effect of excluding people that have
extreme WTP values from the analysis.
5.5 Interviewers
The most important influence on reported WTP, as indicated by the size of the regression
coefficients, were the interviewers. This could be due to a lack of training for the
interviews such that they applied their own set of prompts to help respondents through the
tasks. All interviewers went through a 1-hour training session, piloted the questionnaire
and then reported back their experiences to allow a more consistent set of instructions to be
circulated to the team. This could be made more rigorous in future studies.
However, a multitude of different possible causes of interviewer effects have been
identified in the social sciences, including, gender effects, race effects, age effects and
interviewer intonation effects (Gong and Aadland, 2011). The assessment of the impact of
different interviewers has not received much attention within the WTP literature. Two
American studies that examined this found interviewer effects relating to gender, age and
race (Gong and Aadland, 2011; Loureiro and Lotade, 2005), whilst in the United Kingdom,
Bateman and Mawby (2004) found that interviewer appearance had an impact on WTP.
This is an important finding in the context of the CVM debate as one of the least
contentious issues has been the superiority of interview-based studies over telephone or
postal methods. Whist this study does not provide information on the relative merits of the
alternative methods, it does highlight that interviewers can heavily influence WTP
responses in a way not present with simpler question formats (as shown by the lack of
impact on the policy vote). Future studies should include a statistical test of interviewer
effects.
5.6 The value of using attitude questions and factor analysis
The use of the attitude questions, in combination with the factor analysis produced several
interesting results. Firstly, they seem to indicate that whilst the factors do play a role in
explaining WTP, this is not consistent across schemes. This highlights the complex nature
of people’s attitudes, and the role they play in forming preferences (as proxied by WTP).
the value of a health programme is not determined solely by health. Whilst the ability for
WTP to value ‘more than health’ is an oft-cited reason for the use of WTP in health (Olsen
and Smith, 2001), few studies have been constructed to allow respondents to include
non-health characteristics in their valuations. The incorporation of attitude questions allows us
to go one step further and identify attitudes toward non-health characteristics of the goods
that explain WTP. It should, however, be noted that these explanatory effects do not
correspond to the direct valuation of the non-health characteristics that correspond to the
factors. Attitudes toward these characteristics describe a propensity to value the
characteristics (e.g. warm glow), rather than measure the amount of warm glow generated
and valued.
Secondly, they show that different schemes resonate with respondents through different
sets of attitudes. However, this is not to say that health is not the overriding issue
considered by respondents when answering the WTP question; this question was not
assessed and could not be answered by the data collected within this study. It is tempting
to take these findings relating to the explanatory effect of attitudes as evidence that the
WTP values are produced via a rational process, and are therefore in some way ‘valid’.
Whilst encouraging, these findings need to be contrasted with the lack of any consistent
relationship with income or size of the programme.
Finally, a more complex issue is raised by the finding that attitudes have an explanatory
effect on both direction of preference and WTP, but the nature of the effect is quite
different. This is encouraging as it seems to indicate that the questions are treated in
different ways, with different attitudes being drawn upon to answer the different questions.
This is consistent with the notion that different cognitive processes are employed for the
policy vote and WTP questions. In previous work, Ajzen and Driver (1992) suggested that
WTP questions triggered an affective response based on peripheral cognitive processes,
and as such, were unlikely to produce valid valuations.
Dual processing models of cognition lie at the heart of Kahneman’s view of bounded
rationality (Kahneman, 2003). Whilst the core and peripheral processes referred to by
Ajzen have different names and slightly different interpretations in the different models
describing the two processes as intuition (peripheral) and reasoning (core). In this work,
Kahneman identifies ‘natural assessments’ as particular tasks that trigger intuitive
responses, and within these, assessment of ‘good’ and ‘bad’ as particularly important
natural assessments. This is consistent with the dominant role of the ‘common sense’
factor with regard to the policy vote. Conversely, this would suggest that it is the
‘un-natural assessment’ of WTP that may have provoked greater consideration of the task in
this study. Whether the WTP responses in this study were based on reasoning, is open to
debate; it could be argued that they are just as likely to be adjusted or corrected intuitive
judgements (using Kahneman’s classification of decision making (2003, p717)).
5.7 Informed preferences
The fact that the WTP responses are partly explained by attitude information illustrates
their potential importance to the elicitation process (if not the validity of the responses).
The use of attitude scales by Pouta is based upon an attitude behaviour framework that
postulates a link between attitudes, intention and behaviour (Ajzen and Driver, 1992).
Related to this is the notion of attitude accessibility, which describes the ability for an
individual to retrieve an attitude from memory (Fazio et al., 1982). Taken together, these
two concepts suggest that intended (i.e. stated) WTP should be closer to actual WTP if
respondents have more accessible attitudes toward the good in question (Barro et al., 1996;
Whynes et al., 2005). One way of making attitudes more accessible is to encourage the
respondents to consider them in the form of a series of scales relating to the issue under
consideration. Using this framework, it seems plausible to conclude that asking about
attitudes prior to the elicitation of preferences may help produce better informed
preferences.
However, the results show that the use of attitude questions also reduced the self-assessed
quality of the response to the policy, increased opposition to the schemes and increased
protests to WTP questions. Pouta (2004) also found that quality of response was reduced,
and additionally that sensitivity to bid value was reduced. Whilst Pouta highlighted that
this procedural invariance related is a problem, we do not know which format (and hence
which set of elicited values) are more ‘correct’. Is it better to have pre-elicitation attitude
if they fully understand all the implications of a scheme. The reduced sensitivity to bids,
as seen in the Pouta study, may produce more accurate estimates of true values.
In order to understand this better we need to understand how respondents produce their
valuations as part of the WTP survey. For example, qualitative work could be used to
assess what respondents are considering when they answer WTP questions with and
without pre-WTP attitude questions. This would help identify the role that these
information have within the valuation process.
5.8 Insensitivity
The results show that in general, the WTP responses were not sensitive to the scale of the
scheme, however several issues are worth considering. Firstly, WTP responses were
related to the size of the scheme for the folic acid and speed limit scheme (although with
the former this was only in the case where attitude questions were given before the WTP
answer). Whilst these were restricted to analyses with some imputed covariate data, these
findings are more encouraging than those produced by the EuroWill study (Olsen et al.,
2004).
Secondly, there was insensitivity to the size of the scheme for the policy vote as well. This
may indicate that the insensitivity relates to the good under consideration rather than the
elicitation procedure. The idea that the schemes relate to a set of protected values may
explain this. In other words, people were acting ‘on principle’ without due regard for the
details of the scheme such as size of effect. Baron and Spranca (1997) suggested that one
consequence of respondents holding protected values was ‘quantity insensitivity’.
It is possible to argue that protected values were not only present, but were captured to
some extent by the factors relating to respondent attitudes. For example, one could
interpret the factors relating to ‘government role’ and ‘rights and responsibilities’ as
relating to protected values and that their explanatory power is direct evidence of these
being important to respondents. In other words, government interference, freedom of
choice and individual responsibility may be considered to be protected values by many
people. Consequently, it is respondents’ attitudes towards these process issues that
5.9 Conclusions and further research
The policy vote and WTP questions show clear differences between the schemes. However,
doubt must be cast on the validity of the WTP results due to the high levels of protest and
lack of any consistent evidence of construct validity across the schemes. Furthermore,
whilst there is variability between schemes, the collection of attitude data before the vote
appears to reduce the level of support, whilst simultaneously increasing protest rates and
reducing the decision quality.
However, the measurement of attitudes did produce valuable results by demonstrating an
explanatory effect on the policy vote and WTP responses. This suggests that different
cognitive processes were being used for the two questions, with a more considered
approach being adopted for the WTP question.
Bringing together these successes, and despite the failure of the results to consistently meet
the scope test, I feel that the use of attitude questions and factor analysis should be
considered for future WTP studies. However, it would be worth testing the approach in
areas where people are less likely to respond emotively to the principles that are embodied
within the scheme. These protected values make the valuation task all the more
problematic.
This future work should not only seek to assess whether the factors have an explanatory
effect, but it should consider further the role that pre-WTP attitude questions have on the
valuation process of individuals. Knowing how this information is used and whether
respondents consider it helpful would allow us to assess if the process produces better
Acknowledgements
Thanks go to Phil Shackley and John Brazier for their suggestions and support throughout
References
Ajzen I, Driver B. Contingent value measurement: on the nature and meaning of
willingness to pay. Journal of Consumer Psychology 1992;1(4); 297-316.
Arrow K, Solow R, Portney P, Leamer E, Radner R, Schuman H. Report of the NOAA
Panel on Contingent Valuation. Federal Register 1993;58(10); 4601-4614.
Baron J. Biases in the quantitative measurement of values for public decisions.
Psychological Bulletin 1997;122(1); 72-88.
Baron J, Spranca M. Protected values. Organisational Behaviour and Human Decision
Processes 1997;70; 1-16.
Barro S, Manfredo M, Brown T, Peterson G. Examination of the predictive validity of
CVM using attitude-behavior framework. Society and Natural Resources 1996;9; 111-124.
Bateman I, Mawby J. First impressions count: interviewer appearance and information
effects in stated preference studies. Ecological Economics 2004;49; 47-55.
Bland M. An introduction to medical statistics. Oxford University Press: Oxford; 2000.
Diamond P, Hausman J, Leonard G, Denning M 1993. Does contingent valuation measure
preferences? Experimental evidence. In: Hausman JA (Ed), Contingent valuation: a critical
assessment. North Holland Publishers: Amsterdam; 1993. p. 14-89.
Dixon, S. Public attitudes to compulsory health programmes: generating questions from a
focus group to support a willingness to pay study. Health Economics and Decision Science
Discussion Paper 10/04. University of Sheffield: Sheffield; 2010.
Dixon S, Shackley P. The use of willingness to pay to assess public preferences towards
Donaldson C. Developing the method of 'willingness to pay' for assessment of community
preferences for health care. Final Report to the European Commission. Department of
Health Sciences, University of Calgary: Calgary; 1999.
Donaldson C, Jones A, Mapp T, Olsen J. Limited dependent variables in willingness to
pay studies: applications in health care. Applied Economics 1998;30; 667-677.
Fazio R, Chen J, McDonel C, Sherman S. Attitude accessibility, attitude-behaviour
consistency, and the strength of the object-evaluation. Journal of Experimental Social
Psychology 1982;18; 339-357.
Kincaid JP, Fishburne RP Jr, Rogers RL, Chissom BS. Derivation of new readability
formulas (Automated Readability Index, Fog Count and Flesch Reading Ease Formula) for
Navy enlisted personnel. Research Branch Report 8-75, Millington, TN: Naval Technical
Training, U. S. Naval Air Station: Memphis; 1975.
Gong, M and Aadland D. Interview Effects in an Environmental Telephone Valuation
Survey. Environmental and Resource Economics 2011;49(1); 47-64.
Gregory R, Lichtenstein S, Slovic P. Valuing environmental resources: a constructive
approach. Journal of Risk and Uncertainty 1993;7; 177-197.
Kahneman D. A perspective on judgment and choice. Mapping bounded rationality.
American Psychologist 2003;58; 697-720.
Loureiro M, Lotade J. Interviewer effects on the valuation of goods with ethical and
environmental attributes. Environmental and Resource Economics 2005;30; 49-72.
Nunes P. The contingent valuation of natural parks: assessing the warmglow propensity
factor. Edward Elgar: Cheltenham; 2002.
Nunes P, Schokkaert E. Identifying the warm glow effect in contingent valuation. Journal
Olsen J, Smith R. Theory versus practice: a review of 'willingness-to-pay' in health and
health care. Health Economics 2001;10; 39-52.
Olsen J, Donaldson C, Pereira J. The insensitivity of 'willingness-to-pay' to the size of the
good: new evidence for health care. Journal of Economic Psychology 2004;25; 445-460.
Pouta E. Attitude and belief questions as a source of context effect in a contingent
valuation survey. Journal of Economic Psychology 2004;25; 229-242.
Richie J, Lewis J (Eds). Qualitative research practice.: Sage: London; 2003.
Ryan M, Scott D, Donaldson C. Valuing health care using willingness to pay: a
comparison of the payment cared and dichotomous choice methods. Journal of Health
Economics 2004;23; 237-258.
Shackley P, Dixon S. Using contingent valuation to elicit public preferences for water
fluoridation. Applied Economics 2000;32; 777-787.
Shackley P, Donaldson C. Should we use willingness to pay to elicit community
preferences for health care? New evidence from using a 'marginal' approach. Journal of
Health Economics 2002;21; 971-991.
Shiell A, Gold L. Contingent valuation in health care and the persistence of embedding
effects without warm glow. Journal of Economic Psychology 2002;23; 251-262.
Shiell A, Gold L. If the price is right: vagueness and values clarification in contingent
valuation. Health Economics 2003;12; 909-919.
Whynes D, Philips Z, Frew E. Think of a number...any number? Health Economics Letters
Table 1: Summary of survey sample and comparison with national and local figures
Survey sample
England and Walesa
Sheffielda
Gender Male 39% 48% 48%
Age 16-24 4% 14% 17%
25-64 56% 66% 63%
65 and over 40% 20% 20%
Highest educational level
Degree or equivalent 40% 20% 19%
‘O’/‘A’ level or equivalent 44% 44% 42%
None or other 16% 36% 39%
Marital status Married 66% 51% 48%
Widowed 11% 8% 9%
Divorce or separated 5% 11% 10% Single or living with partner 18% 30% 34%
Main economic activity Employed 40% 61% 56%
Unemployed 1% 3% 4%
Retired 48% 14% 14%
Other 11% 22% 27%
Table 2: Direction of preference for the four schemes
Sample In favour of the scheme? Mean quality score Yes (%) No (%) Indifferent (%) Don’t know (%) Chi-squared p-value*
(SD) Mann-Whitney test p-value*
Fluori-dation
All 143 (72.2)
29 (14.6)
12 (6.1) 14 (7.1) Before 67
(69.1) 19 (19.6) 4 (4.1) 7 (7.2) 0.20 5.59
(1.04) 0.01 After 76
(75.2) 10 (9.9) 8 (7.9) 7 (6.9) 5.98 (0.80) Folic acid
All 102 (45.3) 91 (40.4) 9 (4.0) 23 (10.2) Before 44
(40.0) 49 (44.5) 2 (1.8) 15
(13.6) 0.06
5.44
(0.90) 0.49 After 58
(50.4) 42 (36.5) 7 (6.1) 8 (7.0) 5.49 (1.10) Speed limits
All 163 (81.1) 29 (14.4) 6 (3.0) 3 (1.5) Before 82
(82.0) 15 (15.0) 1 (1.0) 2
(2.0) 0.39
5.82
(0.86) 0.28 After 81
(80.2) 14 (13.9) 5 (5.0) 1 (1.0) 5.92 (0.84) Ban smoking in public places
All 179 (86.5) 20 (9.7) 5 (2.4) 3 (1.4) Before 95
(87.2) 11 (10.1) 2 (1.8) 1
(0.9) 0.84
5.92
(0.78) <0.01 After 84
(85.7) 9 (9.2) 3 (3.1) 2 (2.0) 6.28 (0.63)
All All 587
(70.6) 169 (20.3) 32 (3.9) 43 (5.2) Before 288
(69.2) 94 (22.6) 9 (2.2) 25
(6.0) 0.02
5.74
(0.90) <0.01 After 299
(72.0) 75 (18.1) 23 (5.5) 18 (4.3) 5.95 (0.88)
Table 3: Impact of attitude questions on protests to giving a willingness to pay for those in favour of the scheme
Valuation givena
Protest Chi-squared
Mean WTP
t-test Mean quality score Mann-Whitney test Position of attitude questions
n (%) (%) value (SD) p-value
(SD)
Fluoridation Before 63 36 (57.1)
27 (42.9)
0.55 14.4 (15.7)
0.49 5.53 (1.21)
0.05
After 74 46 (62.2) 28 (37.8) 16.8 (16.1) 5.90 (0.88) Folic acid Before 35 26
(74.3)
9 (25.7)
0.30 35.6 (36.1)
0.20 5.21 (1.13)
0.18
After 54 45 (83.3) 9 (16.7) 26.1 (25.7) 5.41 (1.29) Speed limits Before 77 46b
(59.7)
31 (40.3)
0.16 29.1 (26.8)
0.50 5.64 (1.00)
0.97
After 75 53b (70.7) 22 (29.3) 25.5 (26.1) 5.63 (1.02) Smoking Before 91 51
(56.0)
40 (44.0)
0.53 34.5 (36.0)
0.62 5.77 (1.04)
0.97
After 79 48 (60.8) 31 (39.2) 31.0 (32.3) 5.73 (1.18) All Before 266 159
(59.8)
107 (40.2)
0.04 28.6 (30.7)
0.24 5.59 (1.10)
0.17
After 282 192 (68.1) 90 (31.9) 25.0 (26.1) 5.68 (1.13)
a Includes those classified as ‘true zeros’ despite no value given on the payment card. Excludes ‘don’t knows’.
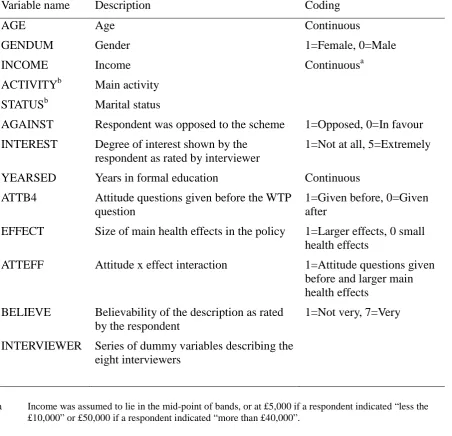
Table 4: Variable descriptions
Variable name Description Coding
AGE Age Continuous
GENDUM Gender 1=Female, 0=Male
INCOME Income Continuousa
ACTIVITYb Main activity
STATUSb Marital status
AGAINST Respondent was opposed to the scheme 1=Opposed, 0=In favour
INTEREST Degree of interest shown by the respondent as rated by interviewer
1=Not at all, 5=Extremely
YEARSED Years in formal education Continuous
ATTB4 Attitude questions given before the WTP question
1=Given before, 0=Given after
EFFECT Size of main health effects in the policy 1=Larger effects, 0 small health effects
ATTEFF Attitude x effect interaction 1=Attitude questions given before and larger main health effects
BELIEVE Believability of the description as rated by the respondent
1=Not very, 7=Very
INTERVIEWER Series of dummy variables describing the eight interviewers
a Income was assumed to lie in the mid-point of bands, or at £5,000 if a respondent indicated “less the
£10,000” or £50,000 if a respondent indicated “more than £40,000”.
Table 5: Interval regressions of identified factors on banded WTP for respondents in each scheme
Fluoridation Folic acid Speed limits Smoking Independent
variable
Coefficients
AGE 0.030 0.311* -0.157 -0.146
GENDUM 2.815 -12.224 3.118 3.102
INCOME 0.169 0.449 -0.064 0.963**
INTEREST 1.477 9.458* 2.808 7.642
YEARSED -1.042 -0.737 0.451 -1.447
ATTB4 -1.952 -8.656 8.445 -3.363
EFFECT -5.065 0.559 18.708*** 4.532
ATTEFF -8.524 25.876** -15.441 12.469
BELIEVE 4.645** 4.109 -1.157 2.197
INTERVIEWERa -*** -*** -*** -**
Common sense -1.189 10.646** 5.801 9.597
Government role 2.484 0.818 8.913*** 14.261*** Warm glow -0.484 10.316*** 10.105*** 5.311 Rights and
responsibilities
0.972 -9.223*** 1.875 0.462
CONSTANT -11.617 -2.409 -7.554 -14.046
n 76 67 94 93
Test statistics p-values
LR 2 (all) 0.041** <0.001*** <0.001*** 0.001***
Ramsey RESET 0.696 0.217 0.183 0.434
* p<0.1, ** p<0.05, ***p<0.01
Table 6: Logistic regressions of identified factors on support for the scheme taken from the policy vote question
Fluoridation Folic acid Speed limits Smoking Independent
variable
Coefficients (Odds ratios)
AGE 0.967 0.997 0.955 1.049
GENDUM 1.359 2.907* 10.451* 0.765
INTEREST 0.309 1.183 0.378 0.115*
YEARSED 1.009 0.980 1.097 1.701*
ATTB4 0.201 0.234** 0.031** 0.691
EFFECT 0.196 0.720 0.176 1418.798
ATTEFF 0.734 2.957 507.744** 0.003
BELIEVE 1.577* 1.219 1.162 0.430*
INTERVIEWERa - - - -
Common sense 16.038*** 15.533*** 139.115*** 253.588*** Government role 1.644 1.693* 2.462** 1.231
Warm glow 1.038 1.010 2.634* 0.575
Rights and responsibilities
0.677 0.596 1.983 1.069
n 165 184 177 187
Pseudo R-squared 0.599 0.572 0.688 0.717
Test statistics p-values
LR 2 (all) <0.001*** <0.001*** <0.001*** <0.001***
* p<0.1, ** p<0.05, ***p<0.01
Acknowledgements
The author would like to thank Phil Shackley, John Brazier, Bruce Lawrence and Darren Shickle for their assistance and support in the conduct of this reserach.
Funding source
Appendix A
Box 1: Description for fluoridation of water (central estimate of effectiveness)
Fluoride is a naturally occurring substance which is already present in very small quantities in water supplies. Fluoride has been shown to be beneficial in reducing tooth decay and is included in many toothpastes. Another way in which fluoride can reduce tooth decay is to add it to drinking water. Where this happens, fluoride is added to the water before it reaches residential areas. This means all households would receive water containing additional fluoride. Adding fluoride to water does not affect its taste. Fluoride also has no effect on household equipment such as kettles and washing machines.
In Britain, children typically have 2 or 3 teeth which are decayed, missing or filled. For adults, the number of decayed, missing or filled teeth is around 17.
Adding fluoride to drinking water would halve the number of decayed, missing or filled teeth for children and adults in the future. These improvements will be greater in the poorer areas of Britain.
There is a very small chance that, for a few people, adding fluoride to water could cause small white patches to appear on some teeth. Anyone taking fluoride supplements, such as tablets or drops, should stop taking them. If they do not, they will be at greater risk of developing discoloured teeth.
Note: the word underlined represents the central estimate of the main health effect as identified in the literature. This was changed to reflect a lower estimate of effectiveness for a sub-sample of respondents. The lower estimate was to reduce the number of decayed, missing or filled teeth by one quarter. This word was not underlined in the survey
Box 2: Description for fortification of food with folic acid (central estimate of effectiveness)
Every year around 180 babies in the UK are born with neural tube defects. These defects cause some babies to die within a few days of birth. Those that survive have a range of disabilities; from mild disability to those which are severely disabled. These abnormalities also cause many miscarriages. Also, many other pregnancies will be terminated following ultrasound scans diagnosing neural tube defects.
Adding folic acid to the diet of women prior to pregnancy and for the first few weeks of pregnancy can reduce the risk of neural tube defects. All women should be advised to take folic acid tables prior to pregnancy. However, not all women are given this advice or follow it.
Another approach is to add folic acid to food. If folic acid is added to food, it has been estimated that the number of babies being born with neural tube defects can be reduced by around 74 every year. The number of miscarriages and terminations would also be
expected to fall.
If this goes ahead, the diagnosis of another disease seen the elderly - vitamin B12
deficiency – will be made more difficult. This is because the higher levels of folic acid in the blood mask the disease. This could lead to people with the disease experiencing some loss of sensation in the arms and legs. Many doctors feel that this is avoidable.
If this goes ahead, the folic acid will be added to flour. Only products which contain flour will contain the additional folic acid. Some flour supplies will not be fortified, and
products which contain non-fortified flour will be clearly marked. The taste and look of food will not be altered in any way by the addition of folic acid.
Box 3: Description for 20 miles an hour urban speed limits (central estimate of effectiveness)
The chance of a pedestrian being seriously injured or killed if struck by a car is 45% if the car is travelling at 30 miles per hour (mph). This is reduced to 5% if the car is travelling at 20 mph.
Imposing 20 mph speed limits in residential areas has been shown to reduce the number of traffic accidents by 60%. The number of child pedestrian and child cyclist accidents is reduced by 67%.
In terms of England, this would mean saving the lives of around 70 children. It would also prevent around 2,000 injuries to children that lead to hospitalisation. The reduction in adult deaths and injuries is more difficult to estimate.
Note: the numbers underlined represents the central estimates of the main health effect as identified in the literature. These were changed to reflect lower estimates of effectiveness for a sub-sample of respondents. The lower estimates were 35 children’s lives saved and 1,000 injuries prevented. These numbers were not underlined in the survey instrument.
Box 4: Description for banning smoking in public places (central estimate of effectiveness)
In adults, passive smoking increases the risk of lung cancer by around 25 per cent and the risk of heart disease by 30 per cent. In children, passive smoking increases the risk of chest illnesses, asthma and cot death.
Around ten thousand people are estimated to die each year in the UK as the result of exposure to other people's tobacco smoke.
For most people, public places are the main source of exposure to second-hand smoke. Banning smoking in public places, such as pubs, bars, shopping centres, will reduce all of these problems. A ban is also expected to reduce the rate of smoking in the population as a whole from 27 per cent to 23 per cent.
Appendix B
Table B1: Statements conveying general issues relating to public health*
The main issue with any health policy is how many people will benefit
Saving lives or relieving suffering are the main considerations when assessing any health policy
When treating the whole population, there should be no potential side-effects what-so-ever
All health interventions require us to balance advantages and disadvantages
When treating the population, side-effects are okay as long as the positive effects outweigh them
Poor health is caused by many factors
When tackling a health problem, a single approach or policy is not especially useful
The best approach to tackling large scale health problems is the provision of more information to promote healthy behaviour
The best way the government can improve health is to help people to help themselves
Individuals can not be trusted to change, so government intervention is worth considering
Legislation can be a good way to change people’s behaviour
The government can be trusted with its health policies
It’s not the government’s job to tell people what to do
The government should stop people harming themselves
The government should stop people harming others
We need to be absolutely certain about all potential side-effects before implementing any health policy
Scientific studies of health problems and possible treatments are generally trustworthy
A big problem with treating the whole population are the unintended consequences of the schemes
Treating the whole population can be a good idea even if it infringes people’s freedom of choice
I have the right to choose whether I participate in any health programme
My actions should not harm others in any way
Individual responsibility is the key to good health
Nobody is 100% responsible for their own health
Table B2: Final list of statements conveying issues relating to a specific public health policy *
This policy will improve the health
Overall, the advantages of this policy outweigh the disadvantages
This health problem is part of a much larger problem which needs to be tackled
This tackles a very important problem
Providing more information to people on this health problem would be a better way forward
This health problem is a good thing for the government to be getting involved with
I think that there are a lot of uncertainties with this policy
I have a lot of faith in the figures presented, and the science behind them
More research is needed on this before it’s implemented
This policy would be easy to introduce
This policy is common sense
This policy doesn’t fit in with other things that are done
This policy will have very little impact on my freedom of choice
Table B3: Final list of cost, charity and tax statements*
The financial cost of this intervention will be very high
The intervention will generate a lot of savings due to improved health
This tackles a very important problem
There are some charity campaigns to which I feel very close and do not hesitate in making contributions
I’m more than happy to contribute to good causes
I admire people who are active members of charities
I take pride in helping others with even the most trivial things
It is difficult for me to refuse to help people who beg for charity
Additional taxes are needed if we are to provide more health programmes
Tax is the fairest way of funding public services
The NHS needs taxes to survive
I don’t mind paying taxes if the money is well spent