This is a repository copy of
Terahertz sensing and imaging using a quantum cascade
laser
.
White Rose Research Online URL for this paper:
http://eprints.whiterose.ac.uk/43783/
Proceedings Paper:
Dean, P, Valavanis, A, Khanna, SP et al. (7 more authors) (2011) Terahertz sensing and
imaging using a quantum cascade laser. In: Proceedings of IEEE Sensors. IEEE Sensors,
28-31 October 2011, Limerick. IEEE , 51 - 54 . ISBN 978-1-4244-9290-9
https://doi.org/10.1109/ICSENS.2011.6127149
[email protected] https://eprints.whiterose.ac.uk/
Reuse
Unless indicated otherwise, fulltext items are protected by copyright with all rights reserved. The copyright exception in section 29 of the Copyright, Designs and Patents Act 1988 allows the making of a single copy solely for the purpose of non-commercial research or private study within the limits of fair dealing. The publisher or other rights-holder may allow further reproduction and re-use of this version - refer to the White Rose Research Online record for this item. Where records identify the publisher as the copyright holder, users can verify any specific terms of use on the publisher’s website.
Takedown
If you consider content in White Rose Research Online to be in breach of UK law, please notify us by
Terahertz sensing and imaging using a quantum
cascade laser
Paul Dean, Alex Valavanis, Suraj P. Khanna,
Mohammad Lachab, Dragan Indjin, Zoran Ikoni
ć
, Paul
Harrison,
Edmund H. Linfield, and A. Giles Davies
School of Electronic and Electrical Engineering University of Leeds
Leeds, LS2 9JT, UK [email protected]
Yah Leng Lim, Russell Kliese,
Milan Nikoli
ć
, Stephen J.
Wilson, and Aleksandar D. Raki
ć
School of Information Technology and Electrical Engineering The University of Queensland
QLD, 4072, Australia
Abstract—We demonstrate terahertz (THz) frequency imaging and sensing using a single quantum cascade laser (QCL) device for both generation and sensing of THz radiation. Detection is achieved by utilising the effect of self-mixing in the THz QCL, and specifically by monitoring perturbations to the voltage across the QCL induced by light reflected from an external object back into the laser cavity. Self-mixing offers high sensitivity, a potentially fast response, and a simple, compact optical design. We show that it can be used to obtain high-resolution reflection images of exemplar structures, as well as for the measurement of the displacement of a remote target, both with and without opaque (in the visible spectrum) materials in the beam path. We also demonstrate displacement sensing over a stand-off distance of 7m through air.
I. INTRODUCTION
The quantum cascade laser (QCL) [1] is a compact semiconductor source of terahertz (THz) frequency radiation that is potentially well-suited for imaging across a broad range of applications including chemical sensing, industrial inspection, and imaging for security and biomedical applications. Detector systems employed for imaging with THz QCLs include microbolometer focal-plane arrays [2], room-temperature Schottky diodes [3] and cryogenically-cooled bolometers [4]. Whilst room-temperature THz detectors avoid the reliance on cryogenic liquids, their response is typically slow and, with the exception of Schottky diodes, sensitivities are significantly poorer than those achieved with cryogenically-cooled bolometric detection.
In this paper, we demonstrate a THz frequency imaging and sensing system that uses a single QCL to both generate and sense the THz radiation through ‘self-mixing’ (SM), an effect which occurs when the radiation from a laser is reflected from an external target back into the laser cavity [5]. In our scheme, imaging is performed by monitoring perturbations to the voltage dropped across the QCL as a reflective object is scanned through the emitted THz beam. The QCL itself behaves as an interferometric sensor, thereby removing the need for an external detector. We demonstrate high-resolution reflection imaging of exemplar metallic structures, including imaging through visibly-opaque screens. We also report measurements on a moving target using a THz SM sensor. Target displacements have been measured for a range of attenuations including opaque (in the visible
spectrum) fabrics, and at stand-off distances of up to 7 m through air.
II. SELF MIXING
Self-mixing occurs when radiation from a laser is partially reflected from an external target and injected back into the laser cavity. The reflected light interferes ('mixes') with the intra-cavity field, producing variations in the threshold gain, emitted power, lasing spectrum and the terminal voltage [6,7]. Each depends on both the amplitude and phase of the radiation reflected from the external target. Whilst the laser SM signals are traditionally acquired from an external photodetector, we have recently demonstrated that SM signals of comparable quality can also be obtained by monitoring the voltage variations across the laser terminals [8,9]. The SM laser sensing technique therefore allows for a simple, self-aligned and robust system for measuring displacement and reflectivity.
Since the seminal work of Lang and Kobayashi in 1980 [6], SM sensors have been reported both at infrared and visible laser wavelengths. However, little has been reported in the THz band with the notable exception of Green et al. who used the SM technique as a means of extracting the linewidth enhancement factor of a THz QCL [10].
The homodyne (coherent) nature of a self-mixing scheme inherently provides very high sensitivity detection, potentially at the quantum noise limit, and therefore a high signal-to-noise ratio can be expected in imaging data. Furthermore, the maximum speed of response to optical feedback is determined by the frequency of relaxation oscillations in the laser. In the case of THz QCLs, the lifetime of the upper state of the lasing transition is limited by elastic and inelastic scattering mechanisms to a few picoseconds, enabling response frequencies of the order of 100 GHz.
III. QUANTUM CASCADE LASER
shown in Fig. 1. Measurements of the source emission spectrum for a drive current of 900 mA, obtained using a Fourier-transform infrared spectrometer with a spectral resolution of 7.5 GHz, indicate emission in a single longitudinal mode at 2.60 THz.
Figure 1. Power–current and current–voltage characteristics of the THz QCL. Inset: The emission spectrum of the THz QCL at a drive current of
900 mA.
IV. TERAHERTZ IMAGING THROUGH SELF-MIXING
A schematic diagram of our imaging system is shown in Fig. 2. Radiation from the QCL was collimated using a 2 inch f/2 off-axis parabolic reflector and focussed at normal incidence onto the object using a second identical reflector. The total optical path between source and object was 65 cm, with ~240 µW of power being incident on the object, as measured using a calibrated THz frequency power meter. The laser beam was mechanically modulated at a frequency of 215 Hz using an optical chopper and coupled back into the laser cavity along the same optical path as the incident radiation. The self-mixing-induced perturbations to the voltage across the QCL terminals were amplified by an ac-coupled differential amplifier with a gain of 100. This signal was then measured by a lock-in amplifier, synchronized with the chopper frequency, as well as by being observed directly on an oscilloscope. For image acquisition, the object was raster-scanned in two dimensions using a two-axis computer-controlled translation stage, with the lock-in amplifier output being recorded at each position. No atmospheric purging was employed.
Figure 2. Schematic diagram of the experimental system used for THz imaging with a QCL. S − Current source; OSC − Oscilloscope; LA −
Lock-in amplifier; C − Mechanical chopper; O − Object.
[image:3.612.327.550.311.503.2]Fig. 3(a) shows a typical waveform obtained after amplification of the ac-coupled voltage across the QCL terminals in response to a modulated feedback signal, for the case in which the object was a reflective metallic plate. The mean junction voltage was 3.1 V with a driving current of 900 mA. Fig. 3(b) shows the root-mean-square self-mixing signal measured as a function of the QCL drive current. Also shown is the power–current characteristic of the QCL. This demonstrates that the QCL is most sensitive to optical feedback at operating currents near threshold. Similar behaviour has been observed previously in junction semiconductor lasers [12]. We estimated the detection limit of our system by inserting attenuators between the QCL and beam focus. Instead of modulating the amplitude of the feedback signal using an optical chopper, for this measurement the reflective plate was attached to a subwoofer speaker that was vibrated at ~20 Hz to generate a time-varying optical path length. This ensured that weak reflections from the attenuators remained constant and made no contribution to the heterodyne signal. We found that our system could tolerate ~48 dB of attenuation, indicating a minimum detectable reflected power equal to ~4 nW.
Figure 3. (a) Exemplar waveform (bottom trace) obtained after amplification of the ac-coupled voltage dropped across the QCL in response
to a square-modulated feedback signal. The TTL feedback control signal (top trace) has been scaled and offset. (b) Root-mean-square self-mixing signal (left axis) and QCL power (right axis) as a function of the QCL
driving current.
[image:3.612.102.268.565.686.2]system was determined by imaging a set of gold-on-quartz bar resolution targets. By defining the resolution limit at the 20% modulation threshold, Fig. 4(b) shows that our system is capable of resolving features down to widths of 250 m or lower. This allows high-resolution imaging to be performed, as demonstrated in the exemplar image of a British two pence coin in Fig. 4(c). For this 25.9 mm × 25.9 mm image (corresponding to 259 pixel × 259 pixel), the shortest acquisition time realizable using our system was 19 minutes.
Figure 4. (a) Exemplar image, obtained using our system, of a scalpel blade obscured behind a high-density polyethylene FedEx®
envelope. (b) Modulation transfer function of the system, obtained from images of gold-on-quartz bar resolution targets. (c) A high resolution image of a British
two-pence coin (diameter = 25.9 mm).
V. TERAHERTZ DISPLACEMENT SENSING THROUGH SELF
-MIXING
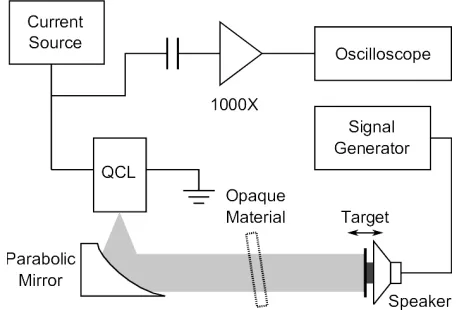
A schematic diagram of the experimental SM apparatus used to measure target displacement is shown in Fig. 5. Radiation from the THz QCL was collimated (using an f/2 off-axis parabolic reflector with a diameter of 2 inches) and directed normally onto a vibrating target consisting of an aluminium plate that was attached to a subwoofer speaker cone. The total distance between the QCL and the target was 47 cm. In the experiments, the beam path length between the QCL and the target was varied periodically, by driving the speaker with a sinusoidal voltage signal at 20 Hz. The amplitude of the target motion was adjusted to approximately 100 µm using a digital dial indicator. The SM signal was measured by monitoring the voltage variations across the terminals of the QCL, amplified by an ac-coupled amplifier with a gain of 1000, and recorded by a digital oscilloscope.
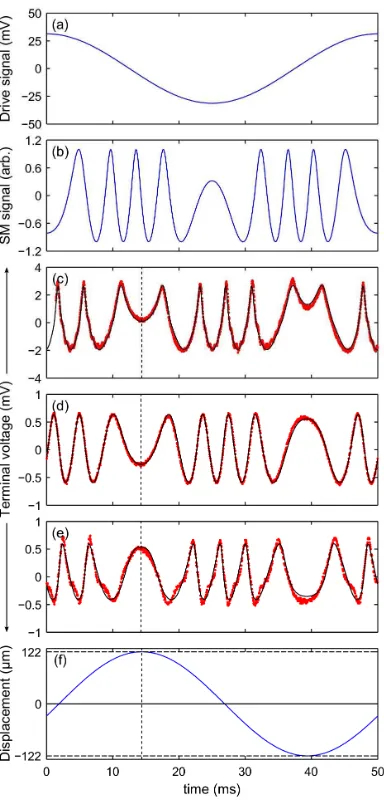
The loudspeaker (target) electrical excitation signal is shown in Fig. 6(a). We obtained the exemplar SM interferogram shown in Fig. 6(b) by solving the steady-state self-mixing equations for threshold gain [13], which is proportional to the terminal voltage variation in the small-signal approximation, assuming that the target displacement was proportional to the excitation signal in Fig. 6(a) (without any phase lag) and assuming that the level of feedback is low. The fringe spacing in the interferogram corresponds to a target displacement of /2 where is the free-space emission
[image:4.612.329.558.493.648.2]wavelength of the QCL (115 µm in our case). Due to the inertia of the electromechanical system used, the target displacement and consequently the measured interferogram contain a phase lag. The shape of the interferogram significantly depends on the attenuation of the beam, and consequently the feed-back level the QCL is experiencing. The SM signal acquired experimentally using an unobstructed beam path is shown in Fig. 6(c). The SM signal measurement was repeated using opaque obstructions between the parabolic mirror and the target. The acquired signals with black cloth and with a fibrous HDPE FedEx® envelope in the beam path are shown in Figs. 3(d) and (e) respectively. In order to extract the target displacement (with sub-fringe precision) we fitted the SM model to the experimentally acquired signals. The feedback parameter, C, the phase-lag between the acquired signal and the target excitation, the target displacement amplitude, and the laser linewidth enhancement factor, were all included in the parameter extraction process as free parameters of the fit. For the purpose of illustration, the parameters obtained for the signal shown in Fig. 6(c) are C = 0.74 and = -0.09. This value of C corresponds to the weak feedback regime and the linewidth enhancement factor extracted agrees well with that reported by Green et al [10]. The phase-lag between each of the measured SM signals and the target excitation (also obtained from the fitting process) has been indicated by vertical broken lines in Fig. 6(c-e) and is predominately due to the inertia of the metal target and speaker cone. The displacement amplitude extracted from each of the fits was 122 µm. The three displacements were all in agreement to 3 significant figures, and commensurate with the approximate measurement of 100 µm made with a digital dial indicator. In addition, it was found that the self-mixing signal could still be observed for a source-to-object distance of approximately 7 m through air (corresponding to a round-trip distance of 14 m).
Figure 6. Graphs showing (a) the speaker excitation signal; (b) the exemplar simulated self-mixing signal (under low feedback level, C<1) obtained assuming that the target displacement is directly proportional to the
excitation signal with no phase-lag; (c-e) compare the measured and simulated self-mixing signals for (c) no obstruction and when obstructed by (d) a black cloth and (e) a HDPE FedEx envelope. (f) is the recovered target discplacement recovered from the results shown in (c). The vertical broken line in (c-f) indicates the phase-lag that is present in the system. The acquired
signals are shown as red dots and the fits are plotted with solid black lines.
VI. CONCLUSIONS
In conclusion, we have demonstrated THz imaging using a single QCL as both the source and detector, by monitoring the self-mixing voltage induced across the QCL terminals by optical feedback from an object. This technique is well-suited to fast, high-resolution, high-sensitivity imaging at THz frequencies without the need for an external THz detector.
The ability to measure displacement with a THz QCL using the SM technique has also been demonstrated. We showed that the sensor is capable of operating in the presence of opaque obstructions, and it is sufficiently sensitive to allow working distances greater than 7 m to be used.
ACKNOWLEDGMENTS
This project is funded under the ERC Advanced Grants ‘NOTES’ and ‘TOSCA’, and the Innovative Research Call in Explosives and Weapons Detection (2007), a cross-government programme sponsored by a number of government departments and agencies under the CONTEST strategy. This research was also supported under Australian Research Council's Discovery Projects funding scheme (DP0988072).
REFERENCES
[1] B. S. Williams, “Terahertz quantum cascade lasers,” Nature Photonics 1, 517 (2007).
[2] A. W. M. Lee, B. S. Williams, S. Kumar, Q. Hu, and J. L. Reno, “Real-time imaging using a 4.3-THz quantum cascade laser and a 320x240 microbolometer focal-plane array,” IEEE Phot. Tech. Lett. 18, 1415 (2006).
[3] S. Barbieri, J. Alton, C. Baker, T. Lo, H. E. Beere, and D. Ritchie, “Imaging with THz quantum cascade lasers using a Schottky diode mixer,” Opt. Express 13, 6497 (2005).
[4] P. Dean, N. K. Saat, S. P. Khanna, M. Salih, A. Burnett, J. Cunningham, E. H. Linfield, and A. Giles Davies, “Dual-frequency imaging using an electrically tunable terahertz quantum cascade laser,” Opt. Express 17, 20631 (2009).
[5] S. Donati, Electro-Optical Instrumentation: Sensing and Measuring with Lasers (Prentice Hall, 2004).
[6] R. Lang and K. Kobayashi, “External optical feedback effects on semiconductor injection laser properties,” IEEE J. Quantum Electron. QE-16, 347 (1980).
[7] J. Katz, S. Margalit, C. Harder, D. Wilt, and A. Yariv, “The intrinsic electrical equivalent circuit of a laser diode,” IEEE J. Quantum Electron. 17, 4 (1981).
[8] Y. L. Lim, M. Nikolic, K. Bertling, R. Kliese, and A. D. Rakic, “Self-mixing imaging sensor using a monolithic VCSEL array with parallel readout,” Opt. Express 17, 5517 (2009).
[9] Y. L. Lim, R. Kliese, K. Bertling, K. Tanimizu, P. A. Jacobs, and A. D. Rakic, “Self-mixing flow sensor using a monolithic VCSEL array with parallel readout,” Opt. Express 18, 11720 (2010).
[10] R. P. Green, J. H. Xu, L. Mahler, A. Tredicucci, F. Beltram, G. Giuliani, H. E. Beere, and D. A. Ritchie, “Linewidth enhancement factor of terahertz quantum cascade lasers,” Appl. Phys. Lett. 92, 071106 (2008).
[11] S. Barbieri, J. Alton, H. E. Beere, J. Fowler, E. H. Linfield, and D. A. Ritchie, “2.9 THz quantum cascade lasers operating up to 70 K in continuous wave,” Appl. Phys. Lett. 85, 1674 (2004).
[12] K. Rochford and A. Rose, “Simultaneous laser-diode emission and detection for fiber-optic sensor applications,” Opt. Lett. 20, 2105 (1995).