promoting access to White Rose research papers
White Rose Research Online
[email protected]
Universities of Leeds, Sheffield and York
http://eprints.whiterose.ac.uk/
This is a copy of the final published version of a paper published via gold open access
in Magnetic Resonance in Medicine.
This open access article is distributed under the terms of the Creative Commons
Attribution Licence (
http://creativecommons.org/licenses/by/3.0
), which permits
unrestricted use, distribution, and reproduction in any medium, provided the
original work is properly cited.
White Rose Research Online URL for this paper:
http://eprints.whiterose.ac.uk/79486
Published paper
3
He pO
2
Mapping Is Limited by Delayed-Ventilation and
Diffusion in Chronic Obstructive Pulmonary Disease
Helen Marshall,
1Juan Parra-Robles,
1Martin H. Deppe,
1David A. Lipson,
2Rod Lawson,
3and Jim M. Wild
1*
Purpose:Lung pO2mapping with 3
He MRI assumes that the sources of signal decay with time during a breath-hold are ra-diofrequency depolarization and oxygen-dependentT1 relaxa-tion, but the method is sensitive to other sources of spatio-temporal signal change such as diffusion. The purpose of this work was to assess the use of3He pO2mapping in patients
with chronic obstructive pulmonary disease.
Methods:Ten patients with moderate to severe chronic ob-structive pulmonary disease were scanned with a 3D single breath-hold pO2mapping sequence.
Results:Images showed signal increasing over time in some lung regions due to delayed ventilation during breath-hold. Regions of physically unrealistic negative pO2 values were
seen in all patients, and regional mean pO2values of0.3 bar
were measured in the two patients most affected by delayed ventilation (where mean time to signal onset was 3–4 s).
Conclusions: Movement of gas within the lungs during breath-hold causes regional changes in signal over time that are not related to oxygen concentration, leading to erroneous pO2measurements using the linear oxygen-dependent signal
decay model. These spatio-temporal sources of signal change cannot be reliably separated at present, making pO2mapping
using this methodology unreliable in chronic obstructive pul-monary disease patients with significant bullous emphysema or delayed ventilation. Magn Reson Med 71:1172–1178, 2014.VC 2013 Wiley Periodicals, Inc.
Key words: hyperpolarized 3He; partial pressure of oxygen;
chronic obstructive pulmonary disease; delayed-ventilation; diffusion
The partial pressure of oxygen (pO2) in the lung airspa-ces depends on ventilation and perfusion matching and is a regional indicator of gas exchange. Hyperpolarized
3He MRI pO
2mapping has been shown to provide
quan-titative, regional measures of pO2 in healthy volunteers
(HVs) (1–4), which are physiologically plausible. The method assumes that all signal depletion during a breath-hold is due to radiofrequency (RF) depolarization
and oxygen-dependent T1 effects (5) and these effects
can be separated to calculate the regional pO2using
typi-cally a linear (1), or exponential (6), oxygen-dependent signal decay model.
The method is, however, also sensitive to other sour-ces of temporal signal change during the breath-hold
ac-quisition time. pO2 mapping methods by definition
require time resolved images to be separated by a delay
timeDt, which is of the same order of magnitude as the
3He T
1in air 20 s (1,5). Hence, inter-frame delays of
2–5 s are typically used to measure the pO2 with 3He.
On this time scale, inter-slice diffusion of gas with dif-ferent polarization has been shown to be a source of
sig-nificant error in slice selective 2D pO2 acquisitions
leading to an underestimation of pO2 values (4). This
can be mitigated by using a 3D sequence (4) where the whole lung experiences the same RF history. Neverthe-less, inter-pixel diffusion is still a source of error in 3D
pO2 mapping if the pixel size Dz, is such that
Dzzrms¼
ffiffiffiffiffiffiffiffiffiffiffiffi
2DDt
p
, where D is the characteristic
diffu-sion coefficient on the time and microstructural length
scale of the experiment. For free3He diffusion in airD¼
0.86 cm2/s (7), whereas smaller apparent diffusion
coeffi-cients (ADCs) are characteristic of longer diffusion times in healthy acinar tissue when measured with longitudi-nal diffusion weighted magnetization pulse sequences (8–11). Similarly, any other change in signal decay, which is not related to oxygen concentration or RF depo-larization, such as a delayed in-flow of gas into the
region of interest (ROI), could cause errors in the pO2
values calculated with the technique.
3He pO2 mapping has been used to image patients
with bronchiolitis obliterans (12) and lung transplant
(12,13), and several studies have performed pO2
map-ping in patients with chronic obstructive pulmonary
dis-ease (COPD) (13–17). COPD is characterized by
abnormalities of air-flow and elevation in regional gas ADC related to emphysema in the alveolar spaces (18). Movement of gas within the lungs of COPD patients dur-ing breath-hold was recently observed, with initially unventilated defects filling with gas over the period of a single breath hold (19).
The aim of this work was to investigate the effects of
delayed-ventilation and diffusion in3He pO
2mapping in
patients with moderate to severe COPD. It was hypothe-sized that gas movement and delayed ventilation during static breath-hold in regions of emphysematous and
par-tially obstructed lung would cause errors in the pO2
val-ues returned by the technique.3He 3D pO
2mapping was
performed in patients with moderate to severe COPD as defined by the Global initiative for chronic Obstructive Lung Disease guidelines. Paradoxical findings in the 1
Department of Academic Radiology, University of Sheffield, Sheffield, South Yorkshire, UK.
2
GlaxoSmithKline, King of Prussia, Pennsylvania, USA.
3
Department of Respiratory Medicine, Sheffield Teaching Hospitals NHS Trust, South Yorkshire, UK.
Grant sponsor: GlaxoSmithKline; Grant number: RES111175; Grant spon-sor: UK EPSRC; Grant number: EP/D070252/1.
*Correspondence to: Jim M. Wild, Ph.D., Department of Academic Radiol-ogy, C Floor, Royal Hallamshire Hospital, Glossop Road, Sheffield, South Yorkshire S10 2JF, UK. E-mail: [email protected]
Received 17 August 2012; revised 7 March 2013; accepted 29 March 2013 DOI 10.1002/mrm.24779
Published online 9 May 2013 in Wiley Online Library (wileyonlinelibrary.com).
measured regional pO2values were observed confirming the technique is prone to error in diseased lungs where gas ventilation is delayed or inter-voxel gas diffusion is spatially unconstrained by emphysematous disruption to the lung microstructure.
METHODS
Ten patients with COPD were scanned. The inclusion criteria were COPD without other significant respiratory disease as diagnosed by a respiratory physician, post-bronchodilator ratio of forced expiratory volume in 1 s
(FEV1) to forced vital capacity <0.7, postbronchodilator
FEV1 30% and 80% of predicted, cigarette smoking
history of10 pack-years, and resting pulse oximeter
ox-ygen saturation of >90% on room air. Patient
demo-graphics and FEV1 values are shown in Table 1.
Imaging was performed on a 1.5 T whole body MRI system (GE HDx, Milwaukee, WI) equipped for
hyperpo-larized3He imaging.3He was polarized on site to around
25% using rubidium spin-exchange apparatus (GE Healthcare, Amersham, UK) under UK regulatory license. Imaging was conducted with national research ethics
committee approval. Patients were positioned in a 3He
quadrature transmit-receive vest coil (Clinical MR Solu-tions, Brookfield, WI). A mix of 200 mL hyperpolarized
3He and 800 mL N
2was inhaled from a state of relaxed
expiration, and3He images were acquired using a single
breath-hold sequence based on (4,20). 3D coronal spoiled gradient echo images with full lung coverage were
acquired with field of view¼35 cm, flip angle¼ 1, 16
20 mm slices, in-plane matrix ¼64 32, planar
spa-tial resolution ¼ 5.5 10.9 mm, bandwidth ¼ 62 kHz,
echo time¼0.8 ms, and pulse repetition time ¼2.5 ms.
The 3D imaging volume was acquired at 6 time points
during the breath-hold with inter-image delay times oft1
¼1.3 s and t2¼ 4.5 s (Fig. 1). Three HVs were scanned
with the same protocol.
Images were masked to segment the lung from back-ground noise according to the signal-to-noise ratio (SNR) of the final dynamic 3D image data (21), and fit pixel-by-pixel in Matlab (MathWorks, Natick, MA) to calculate
re-gional starting pO2maps in a coronal plane as described
in (4). The time dependence of pO2during a breath-hold
was assumed to be linear and given by pO2(t)¼ p0Rt,
where p0is the initial partial pressure and Ris the rate
of oxygen extraction by perfusion (1,4). To observe the temporal signal behavior of the imaging data, ROIs were prescribed. The mean ROI signal normalized to the mean ROI signal of the first time point was plotted with
respect to time and corresponding mean pO2values were
calculated.
A rough estimate of the size of error caused by delayed ventilation was made, by using the magnitude of the
physically unrealistic negative pO2 values as a lower
limit on the estimate of error. The mean negative pO2
value was compared with the time to signal onset param-eter used in (19) to assess the influence of the temporal aspect of delayed ventilation. The effect of breath-hold
time on the measured pO2values was assessed by
gener-ating pO2maps using all 6 time points (21 second
acqui-sition) and comparing them to those made using only the first 4 time points (12 second acquisition).
[image:3.612.67.553.97.254.2]RESULTS
Figure 2 shows maps of the initial pO2(p0at timet¼0),
from a healthy volunteer (HV1) and from a COPD patient
(patient A). The pO2map from the HV (a) was relatively
homogeneous with mean values of 0.13 bar in the left lung and 0.14 bar in the right lung. In the COPD patient,
negative pO2values were returned from several regions
of the lung (d).
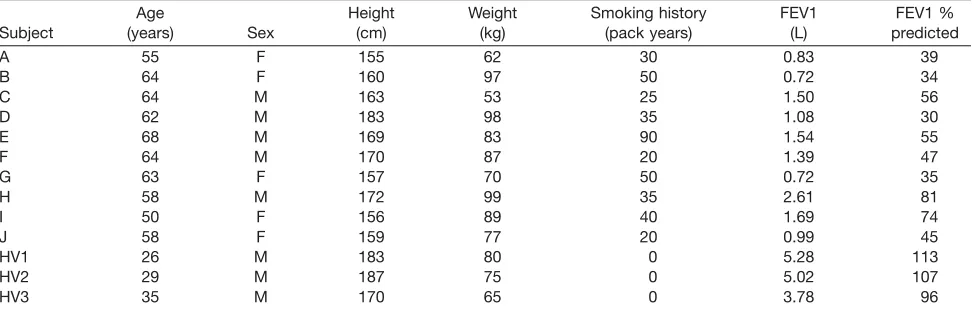
Table 1
Demographics and FEV1 Values of the Patients (A–J) and Three Healthy Volunteers (HV1–HV3)
Subject
Age
(years) Sex
Height (cm)
Weight (kg)
Smoking history (pack years)
FEV1 (L)
FEV1 % predicted
A 55 F 155 62 30 0.83 39
B 64 F 160 97 50 0.72 34
C 64 M 163 53 25 1.50 56
D 62 M 183 98 35 1.08 30
E 68 M 169 83 90 1.54 55
F 64 M 170 87 20 1.39 47
G 63 F 157 70 50 0.72 35
H 58 M 172 99 35 2.61 81
I 50 F 156 89 40 1.69 74
J 58 F 159 77 20 0.99 45
HV1 26 M 183 80 0 5.28 113
HV2 29 M 187 75 0 5.02 107
HV3 35 M 170 65 0 3.78 96
FIG. 1. Sequence timing diagram for pO2mapping within a single
breath-hold. 3D spoiled gradient echo sequence with inter-image delay times oft1¼1.3 s andt2¼4.5 s. 3D imaging volume
rep-resented as a grey rectangle.
Delayed-Ventilation and Diffusion Limit in3He pO
[image:3.612.65.298.641.707.2]The pO2maps from all HVs were relatively homogene-ous and predominantly had values similar to those pub-lished previously for HVs (1,4). A small region with
negative pO2 was seen near the diaphragm in HV3 due
to a slight downward movement of the left lung base
during breath-hold. Elevated pO2 values were observed
near the heart in HV2 and HV3, which may be caused by cardiac motion.
The source 3He time-course images from patient A
(Fig. 3) show gas moving into initially unventilated defects during the course of the static breath-hold. Ini-tially, the gas distribution is inhomogeneous with
regions of3He hyper-intensity and voids but during the
breath-hold it becomes more evenly distributed as regions, which were initially poorly ventilated, become ventilated.
Analysis of the ROI signal time-courses (Fig. 4) showed that signal increased over time in regions which
returned negative pO2values (d, solid and dotted lines)
which is clearly an unrealistic physical situation if
T1(pO2) and RF pulse depolarization are assumed to be the only sources of signal change during breath-hold. Signal ROI plots demonstrate that even regions away from obvious slow-filling ventilation defects can experi-ence a delay before peak signal is reached (e.g., d, dotted
line). pO2 values from ROIs in (c) were 0.17 (dashed
line), 0.10 (dash-dot line),0.10 (dotted line), and0.40
bar (solid line). If data were masked according to the SNR of the first dynamic volume, rather than the last,
regions of negative pO2values would not be included in
the calculated pO2 maps. However, the adjacent lung
[image:4.612.73.543.72.172.2]regions would remain affected by gas movement from them into the initially unventilated defects in a similar manner.
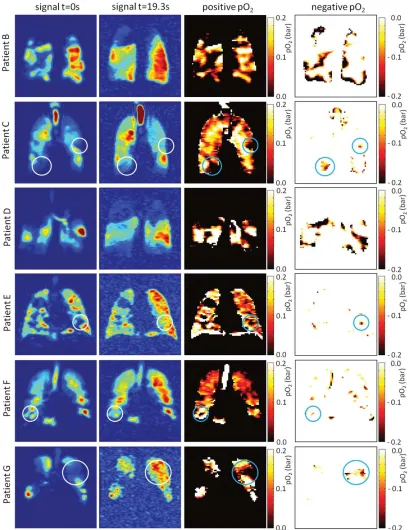
Figure 5 shows the first and last time-point3He source
images and the calculated pO2 maps for the other nine
COPD patients. Gas movement during static breath-hold was observed in some parts of the lung in all of the 10
FIG. 2. pO2maps from (a,b) a healthy volunteer, and (c,d) a COPD patient (Patient A) with gas movement in the lungs during
[image:4.612.72.543.215.310.2]breath-hold. The panels (a) and (c) show positive pO2values, and (b) and (d) show negative “pO2values” where signal increases over time.
FIG. 3. The3He signal time-course images of the COPD patient shown in Figure 2. The signal is normalized to the maximum signal value at each time point.
FIG. 4. Healthy volunteer (a) regions of interest and (b) normalized signal-time plots. COPD patient (c) regions of interest and (d) normal-ized signal-time plots; signal increases over time within the right ventilation defect (solid line) and left upper lobe (dotted line) ROIs. Mean pO2values for the COPD patient ROIs were (1) 0.17 bar, (2) 0.10 bar, (3)0.10 bar, and (4)0.40 bar. Error bars represent the
[image:4.612.72.542.584.706.2]COPD patients. Defects, which were initially unventi-lated but filled with gas during the breath-hold, were
seen in eight patients. Extensive 3He movement during
breath-hold was seen in four patients (A, B, D, and I) and regional increase in signal over time was seen to some extent in all patients, either in large areas (e.g., patient G) or small regions (e.g., patients F and J). A fea-ture seen in several cases (e.g., patients D, F, and G) is two regions of high signal separated by a region of low
signal which even out over time, causing high pO2
val-ues in the regions of originally high signal and negative
pO2values in the region of originally low signal.
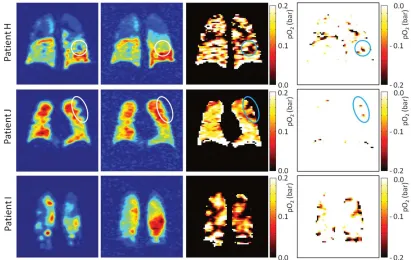
Some patients did not maintain a fully static breath-hold during the data acquisition, with their lung volume gradually decreasing over time, most likely due to invol-untary relaxation of the diaphragm. Motion such as this
also causes erroneous pO2 values, which are most
[image:5.612.102.512.73.603.2]obvious where a region of ventilated tissue moves into
FIG. 5. Source images and calculated pO2maps from 9 COPD patients. Normalized signal at the first imaging time-point (column 1)
and last imaging time-point (column 2). pO2maps showing positive (column 3) and negative (column 4) calculated pO2values. White
circles highlight smaller regions where3He signal increased over time, resulting in negative pO
2values (blue circles). Delayed-Ventilation and Diffusion Limit in3He pO
an unventilated region causing negative pO2 values or vice versa (i.e., near the diaphragm) which causes very
high pO2values. This effect is demonstrated in patients
H and I.
Mean negative pO2values of down to 0.30 bar were
fitted from large regions of the images in patients A and
D. The error in these negative pO2 regions of lung in
patients most affected by delayed-ventilation are
substan-tially greater than the pO2values found in healthy lung.
Not all patients were so strongly affected by delayed ven-tilation but all showed some regions of negative pO2, which have an associated error of at least 100%. On the
whole, the size of pO2measurement error was higher for
regions of delayed ventilation with longer time to signal onset values. However, there were many voxels where the time to signal onset was zero but the signal still
increased over time leading to negative pO2values.
The breath-hold time was found to have little effect on
the measured pO2 values in areas of negative pO2. In
regions of delayed ventilation, the signal increased over time at the beginning of the breath-hold, for example, the solid line in Figure 4d. In such a case, where signal increased for the first 10 s of breath-hold, a fit to the
data would return a negative pO2value even if a short
data acquisition were used such as in (13).
DISCUSSION
In this work, the linear oxygen-dependent signal decay
model was used to estimate pO2, which assumes signal
decay to be dependent on oxygen-related T1 relaxation
and RF depolarization alone. Movement of gas within some regions of the lungs was found to alter the signal
dynamics such that the signal behavior deviated
significantly from that described by the linear model. More complex models of signal decay have been
pro-posed recently which aim to estimate pO2more reliably,
for example by adding a term to the linear oxygen-de-pendent model to account for gas redistribution (22). However, the separation of oxygen concentration and gas flow effects is not trivial, as they can both vary spatially and these spatio-temporal patterns are unknown and in many ways unique to the disruption of the lung micro-structure in each patient’s lungs. In addition, the two are intrinsically linked, as gas may travel between lung
regions with different pO2 values, which would affect
the signal decay according to length of exposure to the different environments.
The negative pO2values estimated are a consequence
of delayed-ventilation in these regions, causing signal to increase over time. Short-range ADC maps acquired from this group of patients showed that the degree of emphy-sema in regions of delayed-ventilation varied, and that severe emphysema sometimes but not always correlated with delayed ventilation. The regions of negative pO2 were caused by the late inflow of gas rather than the ele-vated diffusion from the emphysematous nature of the tissue alone, although a particular instance of delayed-ventilation may be fundamentally linked to the presence of emphysema depending on the underlying mechanism of late ventilation.
The use of a 3D acquisition here mitigates pO2
estima-tion errors caused by inter-slice diffusion mixing of gas with different polarizations, as addressed in (4). The
errors in pO2estimation introduced by diffusion in this
study are from diffusion of gas between voxels in highly emphysematous lung regions between time frames dur-ing data acquisition. When modeldur-ing diffusion in the
[image:6.612.100.511.74.334.2]lungs, it is important to use the correct diffusion coeffi-cient according to the time-length scale of the experi-ment and the underlying length scales of the physical structures within diseased lungs, which will depend on the severity and pattern of tissue destruction. On this
time scale of seconds, 3He diffuses over distances of
millimeters within healthy lungs (as calculated with the
representative long-range diffusion coefficient) and
reflects the structure of the connections between alveoli. In severely emphysematous lungs of COPD patients, a wide range of long-range diffusion coefficients have been
reported with an average of 0.24 cm2/s (23), including
many regions whereD> 0.4 cm2/s and some regions of
bullous emphysema where D approached the free short
time scale diffusion coefficient of3He in air (0.86 cm2/s).
The diffusion length in regions of unrestricted diffusion
(large bullae where D ¼ 0.86 cm2/s) is 5.8 cm over the
time period of 19.3 s used in this work, which is
sub-stantially greater than the voxel size of 0.551.092.0
cm3. This leads to diffusion of gas between voxels, and
potentially between regions with different
oxygen-con-centrations, causing pO2 mapping errors because the
method assumes gas to be static during data acquisition.
It is difficult to assess the error of pO2 estimates in
patients with abnormal oxygen concentration
distribu-tions because the true pO2values are not known. The
ba-sic error analysis presented should not be over-interpreted. The magnitude of the physically unrealistic
negative pO2 values was used as a lower limit estimate
of error in those regions, but perhaps more important are the unquantifiable errors in lung regions where signal still decreases over time but the influence of gas
move-ment on that decay, and resulting pO2 value, is
unknown.
A study by Hamedani et al. proposing a multislice
sin-gle breath-hold acquisition scheme to measure pO2 (17)
included discussion of the accuracy of3He pO2mapping
in COPD. Regions of elevated and depressed pO2 near
each other and a non-negligible number of voxels with a
derived pO2 of zero were noted. These effects were
observed particularly in the subject with COPD (of unstated disease severity) and also to a lesser extent in the current and former smokers. It was suggested that the technique could still be useful despite difficulty with strict interpretation of the resulting maps as pO2. While the amount of error introduced depends on the amount of gas flow present, gas movement during breath-hold is
a major limitation when mapping 3He pO
2 in moderate
to severe COPD, and may also prevent reliable pO2
meas-urements in milder disease. However, observations of ox-ygen-weighted signal dynamics in a qualitative manner are useful to highlight regions of gas flow, and may pro-vide valuable information even without absolute
mea-surement of pO2.
A case study of a patient with severe COPD (14) noted
that the3He ADC was elevated and pO
2was reduced in
a ROI, from which it was suggested that oxygen exchange efficiency was reduced where lung tissue had
been destroyed by COPD. However, a reduced pO2
mea-surement would also be consistent with increased signal in later time points due to delayed-ventilation in the region of elevated ADC.
A short breath-hold 3He pO2mapping technique such
as that proposed by Miller et al. (13) would be less prone to errors due to gas movement because there is less time for gas redistribution to take place. However, there is
still 3He motion seen within the imaging delay time (Dt
¼2–3 s) used for the short breath-hold technique in this
patient group and a significant inter-image delay is
needed for accurate quantification ofT1. Using the long
rangeD values stated previously, with Dt ¼ 2.5 s, gives
an averagezrms¼1.1 cm (usingD¼0.24 cm2/s)
increas-ing to a maximumzrms ¼2.1 cm where there is free
dif-fusion (usingD¼ 0.86 cm2/s), which are lengths greater
than or comparable with the in-plane voxel dimensions used in (13).
The gas movement seen during breath-hold in this
group of COPD patients also has implications for 3He
static ventilation imaging. 2D multislice sequences are commonly used for high-resolution static ventilation imaging, with slices acquired consecutively during a
breath-hold of10 s for full lung coverage. Where there
is gas movement during breath-hold, slice-acquisition timing influences the resulting ventilation images. For example, if a slow-filling ventilation defect is imaged at the beginning of the breath-hold the region will appear unventilated, whereas if it is imaged at the end of the breath-hold it will appear ventilated. Image contrast depends on when the center of k-space is acquired for a 3D sequence also, but as the center of 3D k-space is only acquired once with a Cartesian trajectory all images will
havek¼0 weighting from the same time point.
The lower diffusivity of129Xe may limit gas movement
during breath-hold enough to make pO2 measurements
more reliable in COPD patients.129Xe in air is much less
diffusive than3He in air with a free diffusion coefficient
of 0.14 cm2/s (7). This leads to a diffusion length scale
on the order of pixel size for free diffusion, which would be much reduced for restricted diffusion. Experiments in
guinea pigs found theT1of gas phase129Xe (31.36 1.8
s) to be longer than that of3He (28.861.8 s) in the lung
(24), which would make slightly increased delay times
more suitable to sample theT1decay of129Xe. However,
the 6-fold reduction in diffusion coefficient would out-weigh the effect of a small increase in delay time on root
mean square displacement (zrms). Conversely, the lower
diffusivity of129Xe may introduce further
delayed-venti-lation in regions which would have become immediately
ventilated with a 3He/N2mix, and produce longer time
constants in already established regions of delayed-venti-lation. The solubility of xenon in parenchyma and blood would introduce another mechanism of signal loss unre-lated to oxygen concentration. The percentage of
dis-solved to gaseous xenon is 1–2% but it is in constant
dynamic equilibrium with the gaseous xenon and the process is governed by subject-dependent physiological parameters (25).
CONCLUSIONS
It has been demonstrated in vivo that delayed-ventilation
and/or diffusion limits the effectiveness of pO2mapping
using the linear oxygen-dependent signal decay model in moderate to severe COPD, where movement of gas Delayed-Ventilation and Diffusion Limit in3He pO
within the lungs during breath-hold invalidates the
assumption that all signal decay is due to T1decay and
RF depolarization. We believe that lung pO2 mapping
with3He T
1measurement is unreliable in patients with
moderate to severe COPD in regions of lung showing delayed ventilation (19) or unrestricted diffusion (bul-lous emphysema), where inter-pixel gas movement within the lungs is significant on the time-scale of the experiment. Accurate separation and quantification of the effects of gas movement and oxygen concentration on the signal is highly challenging because the regional oxygen concentrations experienced by the gas are de-pendent on its pathway of movement through the lungs. Gas flow, gas diffusion, and oxygen concentration are all unknown and can be spatially varying and unique within different regions of diseased lung. Maps of signal change rate derived from time-resolved breath-hold
images used for pO2 mapping are useful to highlight
regions of gas flow and are intrinsically affected by O2 concentration.
REFERENCES
1. Deninger AJ, Eberle B, Ebert M, et al. Quantification of regional intra-pulmonary oxygen partial pressure evolution during apnea by (3)He MRI. J Magn Reson 1999;141:207–216.
2. Deninger AJ, Eberle B, Ebert M, et al. (3)He-MRI-based measurements of intrapulmonary p(O2) and its time course during apnea in healthy volunteers: first results, reproducibility, and technical limitations. NMR Biomed 2000;13:194–201.
3. Deninger AJ, Eberle B, Bermuth J, Escat B, Markstaller K, Schmiede-skamp J, Schreiber WG, Surkau R, Otten E, Kauczor HU. Assessment of a single-acquisition imaging sequence for oxygen-sensitive (3)He-MRI. Magn Reson Med 2002;47:105–114.
4. Wild JM, Fichele S, Woodhouse N, Paley MN, Kasuboski L, van Beek EJ. 3D volume-localized pO2measurement in the human lung with 3He MRI. Magn Reson Med 2005;53:1055–1064.
5. Saam B, Happer W, Middleton H. Nuclear relaxation of 3He in the presence of O2. Phys Rev A 1995;52:862–865.
6. Cieslar K, Alsaid H, Stupar V, Gaillard S, Canet-Soulas E, Fissoune R, Cremillieux Y. Measurement of nonlinear pO2decay in mouse lungs using 3He-MRI. NMR Biomed 2007;20:383–391.
7. Chen XJ, Moller HE, Chawla MS, Cofer GP, Driehuys B, Hedlund LW, Johnson GA. Spatially resolved measurements of hyperpolarized gas properties in the lung in vivo. Part I: diffusion coefficient. Magn Reson Med 1999;42:721–728.
8. Owers-Bradley JR, Fichele S, Bennattayalah A, McGloin CJ, Bowtell RW, Morgan PS, Moody AR. MR tagging of human lungs using hyper-polarized 3He gas. J Magn Reson Imaging 2003;17:142–146.
9. Woods JC, Yablonskiy DA, Chino K, Tanoli TS, Cooper JD, Conradi MS. Magnetization tagging decay to measure long-range (3)He diffu-sion in healthy and emphysematous canine lungs. Magn Reson Med 2004;51:1002–1008.
10. Fichele S, Paley MN, Woodhouse N, Griffiths PD, van Beek EJ, Wild JM. Measurements and modeling of long range 3He diffusion in the lung using a “slice-washout” method. J Magn Reson 2005;174:28–33.
11. Wang C, Miller GW, Altes TA, de Lange EE, Cates GD Jr, Mugler JP III. Time dependence of 3He diffusion in the human lung: measure-ment in the long-time regime using stimulated echoes. Magn Reson Med 2006;56:296–309.
12. Gast KK, Biedermann A, Herweling A, Schreiber WG, Schmiede-skamp J, Mayer E, Heussel CP, Markstaller K, Kauczor HU, Eberle B. Oxygen-sensitive 3He-MRI in bronchiolitis obliterans after lung trans-plantation. Eur Radiol 2008;18:530–537.
13. Miller GW, Mugler JP III, Altes TA, Cai J, Mata JF, de Lange EE, Tobias WA, Cates GD, Brookeman JR. A short-breath-hold technique for lung pO2mapping with 3He MRI. Magn Reson Med 2010;63:127–136. 14. Yu J, Law M, Kadlecek S, Emami K, Ishii M, Stephen M, Woodburn
JM, Vahdat V, Rizi RR. Simultaneous measurement of pulmonary par-tial pressure of oxygen and apparent diffusion coefficient by hyper-polarized 3He MRI. Magn Reson Med 2009;61:1015–1021.
15. Hamedani H, Emami K, Kadlecek SJ, et al. Reproducibility assess-ment of high resolution imaging of alveolar oxygen tension in human subjects. In Proceedings of the 19th Annual Meeting of ISMRM, Mon-treal, Canada, 2011. p. 930.
16. Xu Y, Hamedani H, Emami K, et al. Imaging regional heterogeneity of pulmonary oxygen tension as a diagnostic tool for obstructive lung diseases. In Proceedings of the 19th Annual Meeting of ISMRM, Mon-treal, Canada, 2011. p. 932.
17. Hamedani H, Kadlecek SJ, Emami K, et al. A multislice single breath-hold scheme for imaging alveolar oxygen tension in humans. Magn Reson Med 2012;67:1332–1345.
18. Swift AJ, Wild JM, Fichele S, Woodhouse N, Fleming S, Waterhouse J, Lawson RA, Paley MN, Van Beek EJ. Emphysematous changes and normal variation in smokers and COPD patients using diffusion 3He MRI. Eur J Radiol 2005;54:352–358.
19. Marshall H, Deppe MH, Parra-Robles J, Hillis S, Billings CG, Rajaram S, Swift A, Miller SR, Watson JH, Wolber J, Lipson DA, Lawson R, Wild JM, Direct visualisation of collateral ventilation in COPD with hyperpolarised gas MRI. Thorax 2012;67:613–617.
20. Wild JM, Teh K, Woodhouse N, Ireland R, Fichele S, Van Beek EJ, Paley MN. Single scan 3D pO2mapping with hyperpolarized 3He MRI. In Proceedings of the 14th Annual Meeting of ISMRM, Seattle, Wash-ington, USA, 2006. p. 869.
21. Woodhouse N, Wild JM, Paley MN, Fichele S, Said Z, Swift AJ, van Beek EJ. Combined helium-3/proton magnetic resonance imaging measurement of ventilated lung volumes in smokers compared to never-smokers. J Magn Reson Imaging 2005;21:365–369.
22. Kadlecek S, Mongkolwisetwara P, Xin Y, Ishii M, Profka H, Emami K, Rizi R. Regional determination of oxygen uptake in rodent lungs using hyperpolarized gas and an analytical treatment of intrapulmo-nary gas redistribution. NMR Biomed 2011; 24:1253–1263.
23. Woods JC, Yablonskiy DA, Choong CK, Chino K, Pierce JA, Hogg JC, Bentley J, Cooper JD, Conradi MS, Macklem PT. Long-range diffusion of hyperpolarized 3He in explanted normal and emphysematous human lungs via magnetization tagging. J Appl Physiol 2005;99:1992–1997. 24. Moller HE, Chen XJ, Chawla MS, Driehuys B, Hedlund LW, Johnson
GA. Signal dynamics in magnetic resonance imaging of the lung with hyperpolarized noble gases. J Magn Reson 1998;135:133–143. 25. Mugler JP III, Altes TA, Ruset IC, Dregely IM, Mata JF, Miller GW,