1
Policy Research Unit in Economic
Evaluation of Health and Social Care
Interventions
Research Report
Title
Case-Mix Methodology for the
NHS Outcomes Framework
GP Patient Survey Questionnaire Data
Authors
Ara R, van Hout B, Kearns B, Brazier JE.
Correspondence to:
Roberta Ara, HEDS, ScHARR, Regent Court, 30
Regent Street, Sheffield, S1 4DA. Email:
[email protected]
N
o: 008
2
The Policy Research Unit in Economic Evaluation of Health and Care interventions
is funded by the Department of Health Policy Research Programme. It is a
collaboration between researchers from then University of Sheffield and the
University of York.
The Department of Health's Policy Research Unit in Economic Evaluation of Health
and Care Interventions is a 5 year programme of work that started in January
2011. The unit is led by Professor John Brazier (Director, University of Sheffield)
and Professor Mark Sculpher (Deputy Director, University of York) with the aim of
assisting policy makers in the Department of Health to improve the allocation of
resources in health and social care.
This is an independent report commissioned and funded by the Policy Research
Programme in the Department of Health. The views expressed are not necessarily
those of the Department
.
This report should be referenced as follows:
Ara R.M, van Hout B, Kearns B, Brazier. 2011. EEPRU research report 0001.
Case-Mix Methodology for the NHS Outcomes Framework. GP Patient Survey
3
EXECUTIVE SUMMARY
Objective
The objective of the research described in the current report was to explore alternative methodologies which could be used to determine whether the health status of people living with long-term conditions in England is changing over time, all other factors being equal.
Method
Data from the Health Survey for England (HSE) were used in the analyses and EQ-5D was used to represent health related quality of life (HRQoL). The proposed case-mix ratio approach which utilised ordinary least square regressions (with the EQ-5D preference-based score as the dependent variable) was replicated, and alternatives using logistic regressions and two-part models (both using the responses to the EQ-5D health dimensions as the dependent variables) were explored. An alternative method using the HSE year as a performance indicator (PI) was explored and results presented for the four most prevalent health conditions. Results were compared in terms of errors in predicted scores and the ability to capture changes in the distributions of the preference-based scores. Both expected and simulated values were compared.
Results
The EQ-5D data were not normally distributed irrespective of survey or health condition. The annual fluctuations in mean EQ-5D scores, and the proportions in full health, were relatively small overall but differed substantially by health condition. The annual fluctuations in mean EQ-5D scores did not necessarily describe the shifts in the EQ-5D distributions.
4
The results for the performance indicator models were promising and again the logistic dimension models out-performed the linear models. The magnitude and statistical significance of the coefficients in the models were both condition and health dimension specific. The linear models again predicted mean EQ-5D scores more accurately than the dimension models, but the latter performed better across the range of the EQ-5D index in terms of mean errors and mean absolute errors. This was reflected in distributions of predicted scores as the linear models predicted scores outside the EQ-5D range, covered a truncated range and did not capture the characteristics of the actual data.
Conclusion
5
INDEX
1. INTRODUCTION 1.1 Background 1.2 Case-Mix 1.3 Objective 1.4 Constraints 1.5 Data
1.6 Overview of report structure
2. METHODS
2.1 Statistical models 2.2 Case-mix
2.3 Condition specific models 2.4 Comparison of statistical models
3. RESULTS (Summary statistics and EQ-5D data) 3.1 Limiting Long-Term Illness
3.2 Summary Statistics for EQ-5D 3.3 Distribution of EQ-5D scores 3.4 Health dimensions
3.5 Section synopsis and discussion
4. RESULTS (Regressions using the 2003 survey as the base year) 4.1 Statistical models
4.2 Predictive abilities of the statistical models
4.3 Comparing the accuracy of the models across the EQ-5D index 4.4 Monte-Carlo simulations
4.5 Section synopsis and discussion
5. RESULTS (Case-mix adjustment) 5.1 Alternative ratio
5.2 Regression
6. RESULTS (Regressions using Performance Indicator)
6.1 Statistical models with survey year as a performance indicator 6.2 Predictive abilities of the PI models
6.3 Ability of PI models to identify shifts in the EQ-5D scores over time 6.4 Comparing the accuracy of the PI models across the EQ-5D index 6.5 Section synopsis and discussion
7. DISCUSSION
6 TABLES
Table 1 Changes over time in EQ-5D scores for all respondents with LLTI
Table 2 Changes over time in EQ-5D scores for respondents with prevalent health conditions Table 3 Proportion of respondents with diabetes who have problems in health dimensions Table 4 Regressions results, using all respondents with LLTI in the 2003 survey
Table 5 Comparing the predictive abilities of the models
Table 6 Errors in predicted EQ-5D scores sub-grouped by actual EQ-5D scores
Table 7 Comparing the new ratio adjustment factor with the original ratio adjustment Table 8 Comparing the new regression adjustment factor with the original ratio adjustment Table 9 Coefficients of the PI linear models
Table 10 Comparing the predictive abilities of the performance indicator models for COPD Table 11 Errors across the distribution for the diabetes PI dimension models
FIGURES
Figure 1 Exemplar of distribution of EQ-5D scores
Figure 2 Changes in EQ-5D scores for respondents with musculoskeletal conditions Figure 3 Changes in EQ-5D scores for respondents with COPD
Figure 4 Changes in proportions of respondents with problems on health dimensions Figure 5 Distributions of simulated EQ-5D scores
Figure 6 Actual and predicted PI expected EQ-5D scores
7
1. INTRODUCTION
1.1
Background
The Department of Health (DH) is in the process of rolling out a long term cross-sectional biannual postal survey due to commence in July 2011. The survey forms part of the NHS Outcomes Framework and seeks to capture how successfully the NHS is supporting people with long-term conditions to live as normal a life as possible. The survey involves a questionnaire entitled The GP Patient Survey (GPPS) and the data collected using the questionnaire will be used to determine whether the self-reported health status of people living with limiting long-term conditions is changing over time, all other factors being equal. Health status will be quantified using the three level EQ-5D generic health related quality of life (HRQoL) instrument and the associated preference-based utility measures which will be generated using the UK algorithm.[Dolan 1996]
Changes in HRQoL is one of several indicators in the Outcomes Framework which will be used to: hold the NHS Commissioning Board to account for the outcomes demonstrated, provide a national level overview of how well the NHS is performing, and act as a catalyst for driving quality improvement. Specifically, the NHS Commissioning Board will be responsible for ensuring that this particular indicator improves (or does not deteriorate) over time. While the indicator will be used at the national level, where feasible, and depending on sample sizes and information collected, the indicator will also be analysed geographically (region, Primary Care Trust, Local Authority provider) using equality strands (age, ethnicity, religion or belief, gender, disability, sexual orientation) and inequalities (socio-economic groups, deprivation identified via postcode or area). Respondents will be linked to postcodes and providers using the unique identifier number on the questionnaire.
The sample for each GPPS will be randomly selected from adults (aged over 18 years) on GPs’ registered lists who have been at the practice for more than six months and who have not been surveyed in the previous twelve months. The annual sample size for the survey will be in the region of one million and the expected response rate is around 37%. The prevalence for long term health conditions is expected to be around 60% in responders.
1.2
Case-Mix
8
several rounds of the Health Survey for England. The EQ-5D questionnaire was used to describe HRQoL in the analyses, and the proposed case-mix adjustment applied a correction factor for future EQ-5D scores using a ratio constructed from the differences between observed and predicted individual baseline EQ-5D scores, where the predicted values were obtained using the results of an ordinary least square regression (OLS) regression.
1.3
Objective
The objective of the research described in the current report was to explore alternative methodologies which could be used to determine if the health status of people living with long-term conditions in England is changing over time, all other factors being equal.
1.4
Constraints
As governed by the constraints of the protocol for this research, the proposed methodology was simple and transparent and can be conducted in real time using normal statistical packages. Consequently the methods explored were restricted to those which can be performed in STATA using standard commands and freely available do-files.
1.5
Data
1.5.1 Health Survey for England
Data collected during the 2003, 2004, 2005, 2006 and 2008 rounds of the Health Survey for England (HSE) were used in the analyses. These data were collected from random samples of residents in private households in England. The final dataset used in the analyses included respondents (n=13,450) who indicated they had a least one limiting long term illness (LLTI) and completed the EQ-5D questionnaire. In the HSE questionnaire, LLTIs were identified using fifteen broad categories (see Appendix A).
1.5.2 EQ-5D
9
1.6
Overview of report structure
The following section of the report provides a description of the methodologies used. This is followed by a section where the analyses presented by Lees are replicated and compared with results obtained using different techniques. Two simple alternative ratio case-mix adjustments are then compared with the proposed adjustment factor. The penultimate section describes an approach using a performance indicator which could be used as an alternative to the proposed case-mix adjustment ratio. The final section includes a discussion of the results of the analyses, together with suggestions where the proposed methodologies could be developed and expanded.
2. METHODS
The OLS regressions reported by Lees were replicated using the data from the 2003 HSE. Alternatives were explored including response-mapping and two-part models. The analyses were then replicated using the full set of pooled data (pooling from Surveys 2003, 2004, 2005, 2006 and 2008) in the regressions, with the Survey years used as an explanatory variable. Finally, individual statistical models were obtained for individuals with specific health conditions, as opposed to using the full dataset irrespective of health status. To enable direct comparison with Lees’ results, explanatory variables were retained in all models generated irrespective of statistical significance.
2.1
Statistical models
2.1.1 OLS regressions
Following the methods described in Lees’ report, data from respondents (n=3,397) who indicated they had a LLTI during the 2003 HSE were used to derive a linear model using an OLS regression. The model is referred to as the “Linear” model from here on and is of the form:
EQ-5D = +1x +2x + ... + nx +
10 2.1.2 Ordered logit models
Models obtained using OLS regressions rarely perform well at the extremes of the EQ-5D index and results generated using ‘response mapping’ may provide an alternative. In response mapping, the responses to the health dimension questions are used as the dependent variable (as opposed to the EQ-5D preference-based index) in categorical regressions. Using the same dataset as in the OLS regressions, five ordered logit models (one for each of the health dimensions) were obtained. For each dimension di (i=mobility, self-care, usual activities pain/discomfort, anxiety/depression), the
probability (P) that this value is either 1, 2 or 3 is calculated:
) 2 ( ) 1 ( 1 ) 3 ( ) 1 ( .... exp 1 .... exp ) 2 ( .... exp 1 .... exp ) 1 ( 2 2 2 1 1 2 2 2 1 1 1 2 2 1 1 1 2 2 1 1 i i i i i n i n i i i n i n i i i i n i n i i i n i n i i i d p d p d p d p k x x x k x x x d p k x x x k x x x d p
Within this, the β’s reflect the weight given to the various background variables and k’s define the separation between the probabilities. The results of these regressions are referred to as the “Dimension” models from here on.
2.1.3 Two-part models
As datasets of EQ-5D scores typically exhibit a mass at full health (EQ-5D score = 1), it is possible that a two-part model may be appropriate. This was explored by first using a probit model to predict the probability of scoring full health (i.e. EQ-5D = 1):
( | ) ( )
11 2.1.4 Predicting EQ-5D preference-based scores
While it is straightforward to obtain predicted EQ-5D scores from the linear models (simply using the beta’s), it is not as simple for the logistic models as these predicted a range of probabilities on the health dimensions as opposed to a point estimate for the EQ-5D. One method which could be used to calculate a point estimate would be to calculate an expectation using the weighted average obtained by using the probabilities of scoring no, some or extreme responses on the dimensions. I.e. the EQ-5D scores for each of the 243 possible health states are be weighted using the probabilities of being in these health states with the latter being the predicted values obtained from the ordered logit regressions. As this method produces the average expected EQ-5D preference-based score for each individual, as opposed to an actual EQ-5D score, it is not expected that the predicted values will replicate the distribution of the actual EQ-5D scores. For example using the expected scores, it is not possible to generate a score of one and the gaps in the distribution which are observed in actual EQ-5D datasets will not be apparent.
An alternative method would be to predict the distribution of outcomes by summing up (over all individuals) the probabilities for all 243 states and taking an average over each outcome. An alternative, leading to a similar result would be to use Monte-Carlo simulations (1,000 samples) to explore the ability of the models to capture the uncertainty in the beta coefficients and the distributions of the actual EQ-5D scores for both the linear models and the dimension models. As this method generates an actual EQ-5D preference-based score, it is expected that the distribution of the predicted scores for the health dimension models would exhibit the same characteristics as the distribution of the actual EQ-5D scores. For example, the distribution of predicted EQ-5D scores should have a mass at one, followed by two distinct distributions centred around the values of approximately 0.8 and 0.2 (depending on the actual data). These analyses would be useful to examine the underlying distribution and potentials shifts in data across survey years.
2.2
Case-mix
2.2.1 Case-mix ratio adjuster
The case-mix adjustment proposed by Lees utilises the average of the individual ratios in three stages:
12 ̅ ∑
̃ ̂ ̅
Whereby r = ratio, y = survey year, i = individual respondent, E = observed EQ-5D score, ̂ = predicted EQ-5D score, ̃ = case-mix adjusted EQ-5D score.
An alternative case-mix adjustment utilises the ratio of the individuals summed:
̅ ∑ ∑ ̂ ̃ ̂ ̅
In both alternatives:
If ry 1 there is a ‘technology’ improvement in year y compared to the base year If ry 1 there is a ‘technology’ decrease in year y compared to the base year If ry 1 ‘technology’ in year y is the same as the base year (here base year is 2003)
2.2.2 Performance indicator
One alternative to using a case-mix adjustment would be to include an explanatory variable as a performance indicator (PI) within the regressions. The possibility of using an explanatory variable to represent the survey year was explored using pooled data with data from the 2003 survey as the base year. A linear model (PI linear model) was obtained using an OLS regression, and five ordered logit models for the health dimensions (PI dimension model).
2.3
Condition specific models
13
chronic obstructive pulmonary disease (COPD) (n= 2,531), and diabetes (n=2,148) as opposed to all respondents with LLTIs.
2.4
Comparison of statistical models
The goodness of fit of the models was assessed using standard summary statistics (mean, standard deviation (sd), range) and the ability of the statistical models to predict mean EQ-5D scores was assessed using the mean absolute error (MAE) in the individual level predictions. Models obtained using OLS regressions on EQ-5D data tended to under-predict and over-predict values at the top and bottom of the index respectively. Systematic bias in the predicted scores was assessed by calculating the mean error (ME), and the MAE in the individual level predictions for sub-groups of respondents categorised by actual 5D score (5D < 0; 0 ≤ 5D < 0.5; 0.5 ≤ 5D < 0.75; 5D ≥ 0.75). The ability of the models to describe and explain the underlying distributions of the EQ-5D data was assessed graphically using 1,000 Monte-Carlo simulations. The ability of the models to identify potential shifts in distributions over time was examined using box-plots and histograms.
3. RESULTS (Summary statistics and EQ-5D data)
3.1 Limiting Long-Term Illness
A total of 13,540 respondents indicated they had at least one LLTI across the five surveys. Almost 60% (7,716/13,540) of these reported they had a musculoskeletal condition with the percentage in each year varying between 49% (472/966) in 2004 and 61% (1,595/2,623) in 2005. The prevalence of some of the conditions was relatively small and only 1% and 2% of respondents indicated they had an infectious disease or blood disorder respectively (see Appendix).
3.2 Summary Statistics for EQ-5D
3.2.1 Summary of changes in EQ-5D index for all respondents with LLTI
14
Table 1: Changes over time in EQ-5D scores for all respondents with LLTIs
2003 2004 2005 2006 2008
n 3,397 955 2,623 3,167 3,398
EQ-5D, mean 0.6484 0.6071 0.6395 0.6324 0.6210
EQ-5D, sd 0.2977 0.3332 0.2984 0.3116 0.3144
EQ-5D, min -0.349 -0.594 -0.429 -0.594 -0.594
EQ-5D, max 1 1 1 1 1
EQ-5D=1, % 16.3 15.9 15.3 16.0 14.7
Across surveys: bold = largest; underscore = smallest.
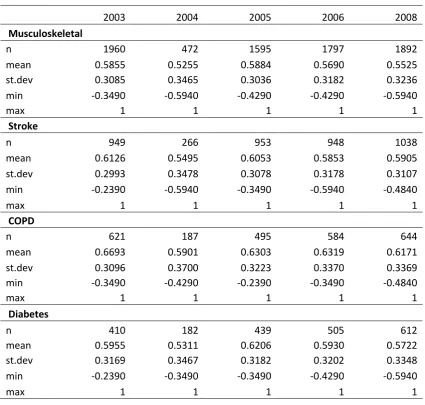
3.2.2 Summary of changes in EQ-5D index for the four most prevalent health conditions
Looking at the four most prevalent LLTIs, there was a relatively large variation in mean EQ-5D scores within the same survey (Table 2). For example, in the 2003 survey the mean EQ-5D scores ranged from 0.5855 (musculoskeletal conditions) to 0.6693 (COPD). The fluctuation in mean EQ-5D scores for the specific condition sub-groups differed across the surveys. For example, the highest mean EQ-5D scores in the 2005 survey were observed in sub-groups with diabetes or musculoskeletal conditions while the highest in the 2003 survey was observed in sub-groups with either stroke or COPD.
15
Table 2: Changes over time in EQ-5D scores for respondents with prevalent LLTIs
2003 2004 2005 2006 2008
Diabetes (n=2,148)
n 410 182 439 505 612
EQ-5D, mean 0.5955 0.5311 0.6206 0.5930 0.5722
EQ-5D = 1, % 12.4 11.2 9.9 15.0 12.1
Stroke (n=4,154)
n 949 266 953 948 1,038
EQ-5D, mean 0.6126 0.5495 0.6053 0.5853 0.5905
EQ-5D = 1, % 11.8 11.7 11.7 12.5 11.4
COPD (n=2,531)
n 621 187 495 584 644
EQ-5D, mean 0.6693 0.5901 0.6303 0.6319 0.6171
EQ-5D = 1, % 22.7 19.8 19.0 20.6 18.8
Musculoskeletal (n=7,716)
n 1,960 472 1,595 1,797 1,892
EQ-5D, mean 0.5855 0.5255 0.5884 0.5690 0.5525
EQ-5D = 1, % 8.4 9.0 8.9 8.5 8.6
Across surveys: bold = greatest; underscore = lowest
3.3 Distribution of EQ-5D scores
The EQ-5D scores were not normally distributed irrespective of survey year or health condition. The distributions for all the sub-groups had a long negative skew, a mass at full health, a second group centred around approximately 0.75 and a third group centred around approximately 0.1. Figure 1 provides an example using the sub-group with COPD (2003 survey). Additional examples are provided in the later sections.
Figure 1: Exemplar of distribution of EQ-5D scores
0
1
2
3
4
D
e
n
si
ty
-.5 0 .5 1
16
The sub-groups with musculoskeletal conditions had the smallest change in mean EQ-5D scores over the different surveys (ranging from 0.5255 in 2003 to 0.5884 in 2005, Table 2). However, there were substantial shifts in the distributions. For example, 25% of respondents scored below 0.1875 in 2004 whereas the 25% percentile in the 2003 and 2005 surveys was 0.516 (Figure 2). Although the sample was relatively small for the 2003 survey (n=472) the sample size for the 2005 survey (n=1,892) was comparable with the other years (range: 1,595 to 1,960).
Figure 2: Changes in EQ-5D scores for respondents with musculoskeletal conditions
Looking at respondents with COPD, while there was a relatively large variation in mean EQ-5D scores for the sub-groups with COPD over time (range: 0.5901 in 2004 to 0.6693 in 2003), the median values were relatively stable (Figure 3). When comparing the surveys 2005 (mean EQ-5D = 0.6303) and 2008 (mean EQ-5D = 0.6171), the distributions remained fairly constant with the central 50% of respondents scoring between 0.516 and 0.848 in both surveys (Figure 3).
-.
5
0
.5
1
EQ-5
D
sc
o
re
s f
o
r
re
sp
o
n
d
e
n
ts w
it
h
Mu
sc
u
lo
sk
e
le
ta
l
17
Figure 3: Changes in EQ-5D scores for respondents with COPD
3.4 Health dimensions
3.4.1 Proportions of respondents with problems in each of the health dimensions
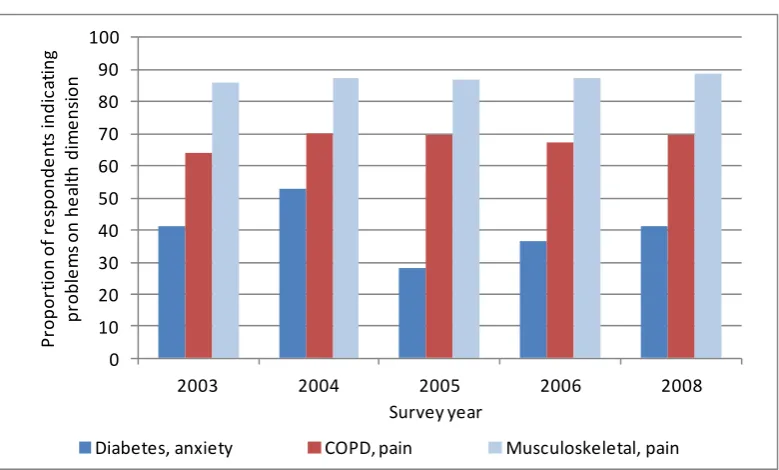
The proportions of all respondents with LLTI who indicated they had problems on the five health dimensions remained stable across the surveys for some of the dimensions but varied substantially for others (Table A3). For example, the proportions who indicated problems with pain/discomfort ranged from 71% in 2003 to 74% in 2005. Conversely, the proportions indicating problems with anxiety/depression ranged from 30% in 2005 to 49% in 2004. The large fluctuations across the surveys for the proportions of respondents who indicated they had problems with anxiety were observed in the prevalent LLTIs (Table A4). For example, for the sub-groups with diabetes, the proportions ranged from 28% in 2005 to 53% in 2004 (Figure 4).
There were substantial differences in the proportions of respondents who indicated they had problems in each of the dimensions when comparing across sub-groups with the LLTIs reflecting the different aspects of health affected by the particular conditions (Table A4). For example, between 64% and 70% of respondents with COPD had problems with pain/discomfort compared to between 86% and 89% of respondents with musculoskeletal conditions (Figure 4).
-.
5
0
.5
1
EQ-5
D
sc
o
re
s f
o
r
re
sp
o
n
d
e
n
ts w
it
h
C
O
PD
18
Figure 4: Changes in proportions of respondents with problems on health dimensions
Data shown are: problems in anxiety/depression for the sub-groups with diabetes, problems in pain/discomfort for the sub-groups with either COPD or musculoskeletal conditions.
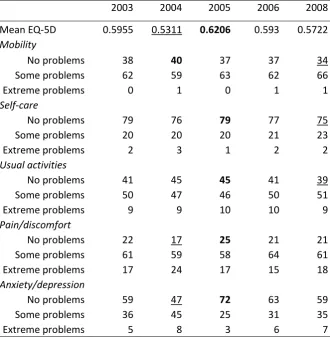
3.4.2 Equating changes in EQ-5D scores with changes in proportions in health dimensions
The sub-groups with diabetes have been used as an example to assess changes in EQ-5D preference scores and the proportions indicating no problems on the health dimensions (Table 3). The smallest mean EQ-5D was observed in the 2004 survey and the proportions indicating no problems on mobility and no problems on usual activities increased slightly compared to the base year. However, the proportion of respondents indicating no problems with anxiety/depression decreased compared to the proportion in the base year (2004 = 47% vs. 2003 = 59%), as did the proportion of respondents indicating no problems with pain/discomfort (2004 = 17% vs. 2003 = 22%). The largest mean EQ-5D was observed in the 2005 survey and the proportions of respondents indicating no problems increased in 2005 compared to the base year in the dimensions: usual activities (2005 = 45% vs. 2003 = 41%), pain/discomfort (2005 = 25% vs. 2003 = 22%), anxiety/depression (2005 = 72% vs. 2003 =59%).
0 10 20 30 40 50 60 70 80 90 100
2003 2004 2005 2006 2008
P ro p o rt io n o f re sp o n d e n ts in d ic at in g p ro b le m s o n h e alt h d im e n sio n Survey year
19
Table 3: Proportion of respondents with diabetes who have problems in health dimensions
2003 2004 2005 2006 2008
Mean EQ-5D 0.5955 0.5311 0.6206 0.593 0.5722
Mobility
No problems 38 40 37 37 34
Some problems 62 59 63 62 66
Extreme problems 0 1 0 1 1
Self-care
No problems 79 76 79 77 75
Some problems 20 20 20 21 23
Extreme problems 2 3 1 2 2
Usual activities
No problems 41 45 45 41 39
Some problems 50 47 46 50 51
Extreme problems 9 9 10 10 9
Pain/discomfort
No problems 22 17 25 21 21
Some problems 61 59 58 64 61
Extreme problems 17 24 17 15 18
Anxiety/depression
No problems 59 47 72 63 59
Some problems 36 45 25 31 35
Extreme problems 5 8 3 6 7
Across surveys: bold = largest proportion with no problems, underscore = largest proportion with problems
3.5 Section synopsis and discussion
The EQ-5D data were not normally distributed irrespective of survey or health condition. The annual fluctuations in mean EQ-5D scores and proportions in full health were relatively
small when comparing all respondents with LLTIs.
The annual fluctuations in mean EQ-5D scores and proportions in full health differed by LLTI. The magnitude of annual fluctuations in mean EQ-5D scores did not necessarily capture
shifts in the distributions of EQ-5D scores.
The annual fluctuations in proportions of respondents with problems on the five health dimensions differed across LLTIs.
20
As the EQ-5D scores were not normally distributed, the mean value may not be the most appropriate measure when examining changes in HRQoL over time. Perhaps more important is knowledge of any “shift” in the distribution of EQ-5D scores compared to the base year. Similarly, while the EQ-5D preference index may show an overall change in HRQoL, the changes in proportions of respondents who have problems in the specific health dimensions will provide useful information on which aspects of health care require improvement, or have improved, relative to the base year.
4. RESULTS (Regressions using the 2003 survey as the base year)
4.1
Statistical models
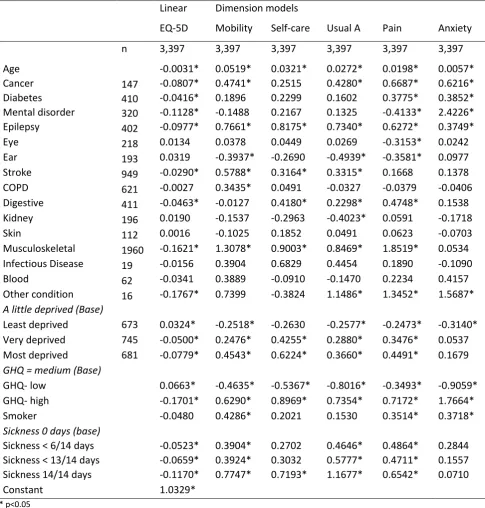
The results of the regressions obtained when using all respondents with LLTI in the 2003 survey are provided in Table 4. The majority of the coefficients for the individual health conditions in the linear model were statistically significant (p<0.05) and had a detrimental effect on the EQ-5D scores. There were exceptions whereby the coefficients suggested a particular LLTI improved HRQoL relative to the base. This is not unexpected for the eye and ear related conditions as there is evidence suggesting the EQ-5D questionnaire may not capture the aspects of HRQoL affected by these conditions.
The statistical significance and magnitude of the coefficients in the health dimension models were specific to both the LLTI and the health dimension. For example, the diabetes coefficient in the linear model was statistically significant but only the diabetes coefficients in the pain and anxiety dimension models were statistically significant. The musculoskeletal coefficient (-0.1621 p<0.05) in the linear model was statistically significant and was the largest of the coefficients for the LLTI variables. The musculoskeletal coefficients for the mobility (1.3078 p<0.05) and pain (1.8519 p<0.05) dimension models were also large compared to the coefficients for the other LLTIs. Conversely, the musculoskeletal coefficient (0.0534 p=0.55) for the anxiety dimension model was not statistically significant and was relatively small compared to the coefficients for the other LLTIs.
21
[image:21.595.73.559.152.661.2]the coefficients differed across the dimensions. For example, the GHQ high coefficient was 1.764 (p<0.05) for the anxiety dimension compared to 0.6290 (p<0.05) for mobility dimension model.
Table 4: Regressions results, using all respondents with LLTI in the 2003 survey
Linear Dimension models
EQ-5D Mobility Self-care Usual A Pain Anxiety
n 3,397 3,397 3,397 3,397 3,397 3,397
Age -0.0031* 0.0519* 0.0321* 0.0272* 0.0198* 0.0057*
Cancer 147 -0.0807* 0.4741* 0.2515 0.4280* 0.6687* 0.6216*
Diabetes 410 -0.0416* 0.1896 0.2299 0.1602 0.3775* 0.3852*
Mental disorder 320 -0.1128* -0.1488 0.2167 0.1325 -0.4133* 2.4226*
Epilepsy 402 -0.0977* 0.7661* 0.8175* 0.7340* 0.6272* 0.3749*
Eye 218 0.0134 0.0378 0.0449 0.0269 -0.3153* 0.0242
Ear 193 0.0319 -0.3937* -0.2690 -0.4939* -0.3581* 0.0977
Stroke 949 -0.0290* 0.5788* 0.3164* 0.3315* 0.1668 0.1378
COPD 621 -0.0027 0.3435* 0.0491 -0.0327 -0.0379 -0.0406
Digestive 411 -0.0463* -0.0127 0.4180* 0.2298* 0.4748* 0.1538
Kidney 196 0.0190 -0.1537 -0.2963 -0.4023* 0.0591 -0.1718
Skin 112 0.0016 -0.1025 0.1852 0.0491 0.0623 -0.0703
Musculoskeletal 1960 -0.1621* 1.3078* 0.9003* 0.8469* 1.8519* 0.0534 Infectious Disease 19 -0.0156 0.3904 0.6829 0.4454 0.1890 -0.1090
Blood 62 -0.0341 0.3889 -0.0910 -0.1470 0.2234 0.4157
Other condition 16 -0.1767* 0.7399 -0.3824 1.1486* 1.3452* 1.5687*
A little deprived (Base)
Least deprived 673 0.0324* -0.2518* -0.2630 -0.2577* -0.2473* -0.3140* Very deprived 745 -0.0500* 0.2476* 0.4255* 0.2880* 0.3476* 0.0537 Most deprived 681 -0.0779* 0.4543* 0.6224* 0.3660* 0.4491* 0.1679
GHQ = medium (Base)
GHQ- low 0.0663* -0.4635* -0.5367* -0.8016* -0.3493* -0.9059*
GHQ- high -0.1701* 0.6290* 0.8969* 0.7354* 0.7172* 1.7664*
Smoker -0.0480 0.4286* 0.2021 0.1530 0.3514* 0.3718*
Sickness 0 days (base)
Sickness < 6/14 days -0.0523* 0.3904* 0.2702 0.4646* 0.4864* 0.2844 Sickness < 13/14 days -0.0659* 0.3924* 0.3032 0.5777* 0.4711* 0.1557 Sickness 14/14 days -0.1170* 0.7747* 0.7193* 1.1677* 0.6542* 0.0710
Constant 1.0329*
* p<0.05
4.2
Predictive abilities of the statistical models
22
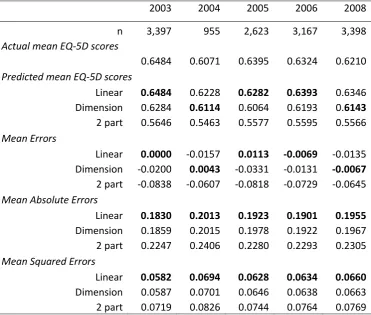
[image:22.595.76.448.172.487.2]accurate results for the 2005 and 2006 surveys. However, the dimension models produced the most accurate mean EQ-5D score for the 2004 and 2008 surveys. Although the differences were small, the linear model had the smallest MAEs and MSEs across all survey years.
Table 5: Comparing the predictive abilities of the models
2003 2004 2005 2006 2008
n 3,397 955 2,623 3,167 3,398
Actual mean EQ-5D scores
0.6484 0.6071 0.6395 0.6324 0.6210
Predicted mean EQ-5D scores
Linear 0.6484 0.6228 0.6282 0.6393 0.6346 Dimension 0.6284 0.6114 0.6064 0.6193 0.6143
2 part 0.5646 0.5463 0.5577 0.5595 0.5566
Mean Errors
Linear 0.0000 -0.0157 0.0113 -0.0069 -0.0135 Dimension -0.0200 0.0043 -0.0331 -0.0131 -0.0067
2 part -0.0838 -0.0607 -0.0818 -0.0729 -0.0645
Mean Absolute Errors
Linear 0.1830 0.2013 0.1923 0.1901 0.1955
Dimension 0.1859 0.2015 0.1978 0.1922 0.1967 2 part 0.2247 0.2406 0.2280 0.2293 0.2305
Mean Squared Errors
Linear 0.0582 0.0694 0.0628 0.0634 0.0660
Dimension 0.0587 0.0701 0.0646 0.0638 0.0663 2 part 0.0719 0.0826 0.0744 0.0764 0.0769
Bold = most accurate results and smallest errors for the survey year
4.3
Comparing the accuracy of the models across the EQ-5D index
23
Table 6: Errors in predicted EQ-5D scores sub-grouped by actual EQ-5D scores
Survey year 2003 2004 2005 2006 2008
EQ-5D < 0
n 185 80 160 208 230
Actual mean EQ-5D -0.0750 -0.1143 -0.0754 -0.0984 -0.0949 Linear mean EQ-5D 0.4179 0.4222 0.4304 0.4171 0.4103 Dimension mean EQ-5D 0.3919 0.4155 0.4052 0.3955 0.3874
Linear MAE 0.4929 0.5365 0.5058 0.5155 0.5052
Dimension MAE 0.4669 0.5298 0.4806 0.4939 0.4823 0≤ EQ-5D < 0.5
n 473 152 351 446 504
Actual mean EQ-5D 0.1857 0.1899 0.1858 0.1792 0.1718 Linear mean EQ-5D 0.5266 0.4989 0.5250 0.5168 0.5239 Dimension mean EQ-5D 0.5158 0.4921 0.5079 0.5020 0.5087
Linear MAE 0.3437 0.3108 0.3419 0.3408 0.3550
Dimension MAE 0.3357 0.3087 0.3290 0.3315 0.3428 0.5 ≤ EQ-5D < 0.75
n 1,360 355 1,124 1,298 1,379
Actual mean EQ-5D 0.6680 0.6589 0.6666 0.6663 0.6618 Linear mean EQ-5D 0.6167 0.5852 0.5991 0.6123 0.6057 Dimension mean EQ-5D 0.6016 0.5820 0.5795 0.5974 0.5895
Linear MAE 0.1161 0.1243 0.1217 0.1182 0.1236
Dimension MAE 0.1166 0.1209 0.1280 0.1175 0.1252
EQ-5D ≥ 0.75
n 1,379 368 988 1,215 1,285
Actual mean EQ-5D 0.8849 0.8862 0.8855 0.8876 0.8816 Linear mean EQ-5D 0.7525 0.7539 0.7299 0.7510 0.7491 Dimension mean EQ-5D 0.7253 0.7317 0.7045 0.7241 0.7230
Linear MAE 0.1524 0.1575 0.1687 0.1560 0.1546
Dimension MAE 0.1651 0.1635 0.1850 0.1692 0.1649
Bold = smallest errors
4.4
Monte-Carlo simulations
24
Figure 5: Distributions of simulated EQ-5D scores
Linear model simulation Dimension model simulation
4.5
Section synopsis and discussion
The magnitude and statistical significance of the coefficients in the models differed by: health condition and dependent variable.
The linear model was more accurate than the dimension models in terms of predicting mean EQ-5D scores for the base year, but less accurate than the dimension models for two of the other four surveys.
The approaches were not particularly accurate at predicting EQ-5D scores across the full range of the EQ-5D index.
The simulations generated using the dimension models replicated the distribution of the actual EQ-5D scores.
The simulations generated using the linear model produced a normally distributed sample with a small proportion of predicted scores outside the bounds of the index.
If the objective is just to examine changes in mean EQ-5D scores across surveys, a linear model obtained using OLS regressions could be viewed as one possible approach. However, out-of-sample predictions will only be accurately predicted within a truncated range of the EQ-5D index. If there are shifts in the underlying distribution of EQ-5D scores across the surveys, this approach may produce inaccurate predictions with substantial errors. This has implications with regard to confidence in a case-mix adjustment which is formed on the basis of ratios of individual level predictions.
0
.5
1
1
.5
2
2
.5
D
e
n
si
ty
0 .2 .4 .6 .8 1
OLS simulation LLTI
0
1
2
3
D
e
n
si
ty
-.5 0 .5 1
25
The errors in the expected predictions were not normally distributed which violates a basic assumption for OLS regressions and undermines confidence in the statistical significance of the beta coefficients. Due to the time constraints for the project, standard statistical tests were not performed on any of the models generated.
5. RESULTS (Case-mix adjustment)
A number of alternatives to the case-mix adjustment proposed by Lees were considered and these are presented below. The ratio for each year is presented (for 2003 the ratio = 1 as this is the base-case, for subsequent years ratios > 1 indicate ‘technology improvement’). If modelled ratios for 2003 were not equal to unity, all results were scaled so that they did.
5.1
Alternative ratio
‘The average of the individual ratios’ proposed by Lees was replaced with ‘the ratio of individuals summed’.
This was done using three approaches: A. Lees’ original (OLS) approach.
B. Modelling the underlying domains (ordered logit) to derive probabilities of being in each of the 243 health domains, from which a specific health state was chosen (with the probability of being chosen equal to the calculated probabilities). To stabilise results, the average of 1,000 simulations was used.
C. Using ordered logit models as above, but using the expected value (per year) as opposed to the average of the simulated scores.
26
Table 7: Comparing the new ratio adjustment factor with the original ratio adjustment
Year Original adjustment factor
New adjustment factor
Linear (A) Dimension (B) Dimension (C)
2003 1 1 1 1
2004 0.957 0.975 0.959 0.962
2005 1.033 1.018 1.016 1.025
2006 0.988 0.989 0.987 0.990
2008 0.977 0.979 0.988 0.980
5.2
Regression
A regression line was fit to the observed and expected EQ-5D scores. The regression line was forced to pass through the origin and the slope was taken to be the adjustment factor. The same three approaches detailed above were used, except for (C), where the expected value was calculated per patient, not per year.
Again, in the majority of cases, the different approaches produced the same results in terms of “improvement” or “deterioration” relative to the base year, but again there were differences in the magnitude of change (Table 8). The most noticeable difference in the results across all the alternatives was the factor obtained from the 2005 survey. It is not clear which of the approaches gives the “correct” adjustment factor.
Table 8: Comparing the new regression adjustment factor with the original ratio adjustment
Year Original adjustment factor
New adjustment factor
Linear (A) Dimension (B) Dimension (C)
2003 1 1 1 1
2004 0.957 0.987 0.958 0.974
2005 1.033 1.014 0.999 1.014
2006 0.988 0.993 0.977 0.993
2008 0.977 0.981 0.972 0.980
6. RESULTS (Regressions using Performance Indicator)
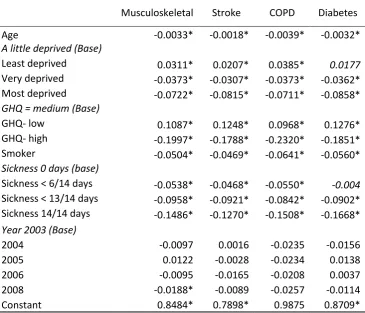
6.1
Statistical models with survey year as a performance indicator
27
the coefficients for least deprived (p=0.32) and sickness <6/14 days (p=0.88) for the diabetes model. With the exception of the year 2008 for the musculoskeletal linear model, none of the coefficients for the survey years were statistically significant.
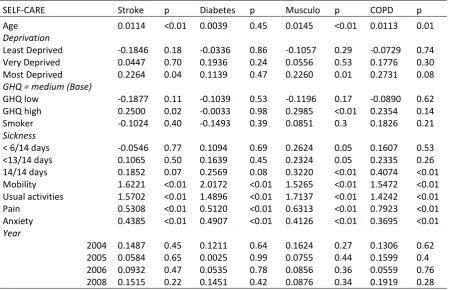
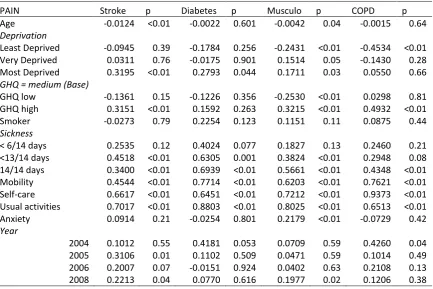
The condition specific PI dimension models (Appendix Tables A6-A10) demonstrated that the magnitude and statistical significance of the coefficients were condition and health dimension specific. For example, the coefficients for age ranged from 0.0472 (p<0.05) for the mobility PI dimension model in the sub-group with COPD, to -0.0022 (p=0.60) for the pain PI dimension model in the sub-group with diabetes.
When comparing the coefficients in the PI dimension models with those in the PI 2 part model (Appendix Tables A12-A16), and looking at the same health dimension and condition, the coefficients in the 1 part model varied substantially from their counterpart in the 2 part model. For example, for the mobility PI dimension models for COPD, the coefficient for GHQ low was 0.1182 (p=0.43) compared to -0.0045 (p=0.98) for the PI 2 part model.
28
Table 9: Coefficients of the PI linear models
Dependent variable: EQ-5D
Musculoskeletal Stroke COPD Diabetes
Age -0.0033* -0.0018* -0.0039* -0.0032*
A little deprived (Base)
Least deprived 0.0311* 0.0207* 0.0385* 0.0177
Very deprived -0.0373* -0.0307* -0.0373* -0.0362* Most deprived -0.0722* -0.0815* -0.0711* -0.0858*
GHQ = medium (Base)
GHQ- low 0.1087* 0.1248* 0.0968* 0.1276*
GHQ- high -0.1997* -0.1788* -0.2320* -0.1851*
Smoker -0.0504* -0.0469* -0.0641* -0.0560*
Sickness 0 days (base)
Sickness < 6/14 days -0.0538* -0.0468* -0.0550* -0.004 Sickness < 13/14 days -0.0958* -0.0921* -0.0842* -0.0902* Sickness 14/14 days -0.1486* -0.1270* -0.1508* -0.1668*
Year 2003 (Base)
2004 -0.0097 0.0016 -0.0235 -0.0156
2005 0.0122 -0.0028 -0.0234 0.0138
2006 -0.0095 -0.0165 -0.0208 0.0037
2008 -0.0188* -0.0089 -0.0257 -0.0114
Constant 0.8484* 0.7898* 0.9875 0.8709*
* p<0.05
6.2
Predictive abilities of the performance indicator models
29
Table 10: Comparing the predictive abilities of the performance indicator models for COPD
Condition: COPD 2003 2004 2005 2006 2008
n 621 187 495 584 644
Actual mean EQ-5D 0.6693 0.5901 0.6303 0.6319 0.6171 Predicted mean EQ-5D
PI linear 0.6693 0.5901 0.6303 0.6319 0.6171
PI dimension 0.6425 0.5696 0.6133 0.6147 0.5971
2 part 0.6431 0.5792 0.6018 0.6120 0.5923
Mean Errors
PI linear 0.0000 0.0000 0.0000 0.0000 0.0000
PI dimension 0.0268 0.0205 0.0170 0.0173 0.0200
2 part 0.0262 0.0108 0.0285 0.0199 0.0248
Mean Absolute Errors
PI linear 0.1933 0.2289 0.1995 0.2083 0.2101
PI dimension 0.1265 0.1480 0.1290 0.1401 0.1368
2 part 0.2116 0.2483 0.2144 0.2247 0.2233
Mean Squared Errors
PI linear 0.0652 0.0812 0.0664 0.0720 0.0733
PI dimension 0.0262 0.0317 0.0272 0.0317 0.0297
2 part 0.0723 0.0937 0.0720 0.0780 0.0789
Bold = most accurate results and smallest errors for the survey year
6.3
Ability of PI models to identify shifts in EQ-5D scores over time
6.3.1 Expected vales
30
Figure 6: Actual and predicted PI expected EQ-5D scores
Actual EQ-5D scores Diabetes PI Linear model expected EQ-5D scores Diabetes
PI Dimension model expected EQ-5D scores Diabetes
PI 2 part model expected EQ-5D scores Diabetes
6.3.2 Comparing results using random Monte-Carlo simulations
Again using the diabetes data as an example, and comparing the data for the 2003 and 2004 surveys, the shift at the top and the bottom of the actual EQ-5D index is clearly visible in the histograms (Figure 7). When comparing the samples generated using Monte-Carlo simulations (Figure 7) for the PI Linear models, it is clear there was a difference in the distributions, but as the model only predicted a truncated range it was not able to accurately reflect the correct shift in the distribution for the 2004 survey. Conversely, the distributions sampled using the PI dimension model were close approximations of the two actual distributions (Table 7).
-. 5 0 .5 1 Ac tu a l EQ -5 D sc o re s re sp o n d e n ts w it h D ia b e te s
2003 2004 2005 2006 2008
.2 .4 .6 .8 1 PI L in e a r EQ-5 D sc o re s re sp o n d e n ts w it h D ia b e te s
2003 2004 2005 2006 2008
-. 2 0 .2 .4 .6 .8 PI D ime n si o n EQ-5 D sc o re s re sp o n d e n ts w it h D ia b e te s
2003 2004 2005 2006 2008
.2 .4 .6 .8 1 PI 2 p a rt EQ-5 D sc o re s re sp o n d e n ts w it h D ia b e te s
31
Figure 7: Distributions of actual and predicted EQ-5D scores for Diabetes
Actual Year 2003 Actual Year 2004
PI Linear Simulation Year 2003 PI Linear Simulation Year 2004
PI Dimension Simulation Year 2003 PI Dimension Simulation Year 2004
6.4
Comparing the accuracy of the PI models across the EQ-5D index
When comparing the accuracy of the models across the full range of the EQ-5D index, with the exception of the category: 0.5 ≤ EQ-5D < 0.75, the PI dimension models produced the most accurate predictions across the full range of the EQ-5D index in terms of the mean errors (Table 11). The PI
0 1 2 3 4 D e n si ty
-.5 0 .5 1
Actual EQ-5D Diabetes Year 2003
0 .5 1 1 .5 2 2 .5 D e n si ty
-.5 0 .5 1
Actual EQ-5D Diabetes Year 2004
0 .5 1 1 .5 2 2 .5 D e n si ty
.2 .4 .6 .8 1
PI Linear Simulation Diabetes Year 2003
0 .5 1 1 .5 2 2 .5 D e n si ty
.2 .4 .6 .8 1
PI Linear Simulation Diabetes Year 2004
0 .5 1 1 .5 2 2 .5 D e n si ty
-.5 0 .5 1
PI Dimension Simulation Diabetes Year 2003
0 1 2 3 D e n si ty
-.5 0 .5 1
32
dimension models produced the smallest MAEs irrespective of EQ-5D category or health condition (Table 11, Tables A20-A22).
Table 11: Errors across the distribution for the diabetes PI dimension models
Diabetes 2003 2004 2005 2006 2008
EQ-5D < 0
n 38 18 35 36 56
Actual Mean EQ-5D score -0.0932 -0.1281 -0.0797 -0.1251 -0.1228
Predicted mean EQ-5D score
PI Linear 0.4342 0.3881 0.4077 0.3752 0.3827 PI Dimension 0.1436 0.1171 0.1296 0.1135 0.0841
2 part 0.4013 0.3561 0.3925 0.3506 0.3507
Mean Errors
PI Linear -0.5275 -0.5162 -0.4874 -0.5003 -0.5055 PI Dimension -0.2368 -0.2452 -0.2093 -0.2386 -0.2070
2 part -0.4946 -0.4842 -0.4722 -0.4757 -0.4735
Mean Absolute Errors
PI Linear 0.5275 0.5162 0.4874 0.5003 0.5055 PI Dimension 0.2368 0.2452 0.2093 0.2386 0.2074
2 part 0.4946 0.4842 0.4722 0.4757 0.4735
0≤ EQ-5D < 0.5
n 53 39 57 84 98
Actual Mean EQ-5D score 0.1810 0.1595 0.1552 0.1697 0.1589
Predicted mean EQ-5D score
PI Linear 0.4971 0.4438 0.5040 0.5061 0.4735 PI Dimension 0.4107 0.3793 0.3975 0.3741 0.3913
2 part 0.4647 0.4186 0.4814 0.4739 0.4393
Mean Errors
PI Linear -0.3162 -0.2844 -0.3488 -0.3364 -0.3146 PI Dimension -0.2297 -0.2199 -0.2423 -0.2044 -0.2324
2 part -0.2838 -0.2591 -0.3263 -0.3042 -0.2804
Mean Absolute Errors
PI Linear 0.3185 0.2863 0.3514 0.3389 0.3201 PI Dimension 0.2440 0.2388 0.2552 0.2248 0.2458
33
Table 11: Errors across the distribution for the diabetes PI dimension models (cont’d)
Diabetes 2003 2004 2005 2006 2008
0.5 ≤ EQ-5D < 0.75
n 187 71 187 224 283
Actual Mean EQ-5D score 0.6550 0.6434 0.6655 0.6614 0.6554
Predicted mean EQ-5D score
PI Linear 0.5895 0.5238 0.6152 0.5835 0.5705
PI Dimension 0.5631 0.5257 0.5852 0.5698 0.5563
2 part 0.5596 0.5053 0.5923 0.5626 0.5371
Mean Errors
PI Linear 0.0654 0.1197 0.0503 0.0780 0.0849
PI Dimension 0.0919 0.1178 0.0803 0.0916 0.0991
2 part 0.0954 0.1381 0.0732 0.0989 0.1183
Mean Absolute Errors
PI Linear 0.1422 0.1423 0.1037 0.1490 0.1412 PI Dimension 0.1050 0.1242 0.0910 0.1007 0.1082
2 part 0.1602 0.1842 0.1535 0.1772 0.1796
EQ-5D ≥ 0.75
n 132 54 160 161 175
Actual Mean EQ-5D score 0.8760 0.8717 0.8870 0.8792 0.8916
Predicted mean EQ-5D score
PI Linear 0.6899 0.6516 0.7149 0.7003 0.6910 PI Dimension 0.7807 0.7643 0.7931 0.7924 0.7915
2 part 0.6830 0.6561 0.7417 0.6959 0.7015
Mean Errors
PI Linear 0.1861 0.2201 0.1721 0.1789 0.2006 PI Dimension 0.0953 0.1074 0.0940 0.0868 0.1001
2 part 0.1930 0.2156 0.1453 0.1833 0.1901
Mean Absolute Errors
PI Linear 0.1984 0.2235 0.1826 0.1842 0.2043 PI Dimension 0.1016 0.1096 0.1016 0.0952 0.1063
2 part 0.2433 0.2551 0.2082 0.2384 0.2446
6.5
Section synopsis and discussion
None of the coefficients for the performance indicator (Survey year) were statistically significant in the condition specific PI linear models.
Several of the coefficients for the performance indicator (Survey year) were statistically significant in the condition specific PI dimension models.
The magnitude and statistical significance of the coefficients for the other explanatory variables were condition and health dimension specific.
The PI linear models were the most accurate in terms of predicting the mean survey EQ-5D across all four prevalent LLTIs.
34
In general, the PI dimension models performed better across the full range of the EQ-5D index when compared in terms of the mean errors and MAEs.
The PI dimension approach produced distributions which reflected the skewed nature of the actual EQ-5D data.
The PI linear models predicted scores over one, covered a truncated range and did not capture the characteristics of the actual data.
The results from the PI models suggested that it may be possible to identify a variable (such as year of survey) to assess changes in mean EQ-5D scores over time. As in the previous analyses, these PI results illustrated the potential hazards associated with using a linear EQ-5D model for anything other than predicting mean EQ-5D scores. They also reiterated the earlier findings that the errors in the predicted EQ-5D scores could be substantial for values outside 0.5 ≤ EQ-5D < 0.75. Again, this finding undermines confidence in using the individual patient level predictions to obtain a ratio for a case-mix adjustment.
7. DISCUSSION
When examining changes in HRQoL over time, there are many aspects of interest. One may want to concentrate on an aggregate, single summary statistic, or examine changes in the various aspect of HRQoL, or perhaps to understand more about how HRQoL has changed within different disease areas. In all cases, the methods for doing so, using data from different populations, have to take account of changes in the case-mix. Moreover, when trying to correct for this, the structure of the data must be taken into account.
35
In this study, the linear models performed well in terms of predicting mean EQ-5D scores but they predicted a very truncated range at the bottom of the index, and scores larger than the maximum of the EQ-5D index. They also did not perform well in comparison to the dimension models when examining the distribution of the EQ-5D index. The linear predictions did not capture the characteristics of the actual data and as such may be sub-optimal to examine potential shifts in the distribution over time, either in terms of the overall HRQoL or the individual dimensions of health. Conversely, the simulated dimension models did capture the distributions of the actual scores and could potentially be used to examine shifts in the distributions over time. While the dimension models were far more accurate than the linear models across the extremes of the index, the errors in the expected scores could also be substantial.
The errors in the individual predicted EQ-5D scores should raise concerns with regard to the appropriateness of using a case-mix adjustment that is obtained using a ratio of observed and expected scores generated on an individual level. Although an alternative method is offered in the form of a ratio generated from the totals of the observed and the expected, this does not make any adjustment for the errors in the predicted scores at the extremes of the EQ-5D index. A case-mix adjustment based on a ratio is not necessarily the most appropriate method for EQ-5D data due to the problems with fitting a statistical model which captures the relationship accurately across the full index.
Regressions which incorporate an explanatory variable representing a PI (i.e. the survey year) are suggested as a possible alternative as these do not rely on accuracy in the individual level predictions and thus may be more appropriate. While the PI beta coefficients in the linear model were not statistically significant, this was not always the case in the PI dimension models. It is possible that the PI dimension models could be improved in terms of the explanatory variables included, as the relationships reported here were specific to both condition and health dimensions.
36
Caveats / additional research:
Due to time constraints associated with this project, no formal assessment of any of the models was conducted. In addition, the health dimensions approach was not fully explored and there are several areas which would benefit from additional research:
1) To enable comparison with the earlier work the explanatory coefficients were retained in the models irrespective of statistical significance. Additional research to identify significant predictors specific to each of the five health dimensions could improve the results.
2) The responses to the health dimensions could be correlated and will be condition specific. An alternative that would be useful to explore would be a multivariate ordered logit model which incorporates all five health dimensions within the same structure. Although there are currently not any freely available STATA commands or do-files to generate this form of model, it may be possible to programme this in STATA.
3) Additional research to explore the 2 part model approach is recommended.
37
8. APPENDIX
EQ-5D SUMMARY STATISTICS
Table A1: Number of respondents with each LLTI
All years 2003 2004 2005 2006 2008
At least one LLTI 13,540 3,397 966 2,623 3,167 3,398
Cancer 648 147 26 159 156 160
Diabetes 2,148 410 182 439 505 612
Mental disorder 1,342 320 128 200 323 371
Epilepsy 1,515 402 95 256 361 401
Eye 816 218 55 181 169 193
Ear 726 193 31 146 176 180
Stroke 4,154 949 266 953 948 1,038
COPD 2,531 621 187 495 584 644
Digestive 1,583 411 117 315 360 380
Kidney 759 196 59 149 190 165
Skin 415 112 22 88 113 80
Musculoskeletal 7,716 1,960 472 1,595 1,797 1,892
Infectious Disease 68 19 10 15 10 14
Blood 267 62 21 51 56 77
Other condition 104 16 12 20 18 38
Table A2: Numbers of respondents with any LLTI on each level of the five health dimensions
Mobility All 2003 2004 2005 2006 2008
none 6,048 1,596 486 1,087 1,395 1,484
some 7,440 1,798 459 1,532 1,756 1,895
extreme 52 3 10 4 16 19
Anxiety All 2003 2004 2005 2006 2008
none 8,720 2,189 489 1,838 2,047 2,157
some 4,089 1,039 387 683 929 1,051
extreme 731 169 79 102 191 190
Self-care All 2003 2004 2005 2006 2008
none 11,033 2,839 780 2,124 2,572 2,718
some 2,346 532 151 471 552 640
extreme 161 26 24 28 43 40
Usual Activities All 2003 2004 2005 2006 2008
none 6,454 1,655 494 1,234 1,474 1,597
some 6,154 1,512 396 1,192 1,488 1,566
extreme 932 230 65 197 205 235
Pain All 2003 2004 2005 2006 2008
none 3,644 981 250 675 867 871
some 8,021 1,983 557 1,597 1,869 2,015
38
Table A3: Proportions of respondents with any LLTI on each level of the five health dimensions
Year: 2003 2004 2005 2006 2008
n 3,397 955 2,623 3,167 3,398
Mobility
none 47 51 41 44 44
some 53 48 58 55 56
extreme 0 1 0 1 1
Self-care
none 84 82 81 81 80
some 16 16 18 17 19
extreme 1 3 1 1 1
Usual Activities
none 49 52 47 47 47
some 45 41 45 47 46
extreme 7 7 8 6 7
Pain
none 29 26 26 27 26
some 58 58 61 59 59
extreme 13 15 13 14 15
Anxiety
none 64 51 70 65 63
some 31 41 26 29 31
extreme 5 8 4 6 6
39
Table A4: EQ-5D scores (respondents with 4 most prevalent LLTIs)
2003 2004 2005 2006 2008
Musculoskeletal
n 1960 472 1595 1797 1892
mean 0.5855 0.5255 0.5884 0.5690 0.5525
st.dev 0.3085 0.3465 0.3036 0.3182 0.3236
min -0.3490 -0.5940 -0.4290 -0.4290 -0.5940
max 1 1 1 1 1
Stroke
n 949 266 953 948 1038
mean 0.6126 0.5495 0.6053 0.5853 0.5905
st.dev 0.2993 0.3478 0.3078 0.3178 0.3107
min -0.2390 -0.5940 -0.3490 -0.5940 -0.4840
max 1 1 1 1 1
COPD
n 621 187 495 584 644
mean 0.6693 0.5901 0.6303 0.6319 0.6171
st.dev 0.3096 0.3700 0.3223 0.3370 0.3369
min -0.3490 -0.4290 -0.2390 -0.3490 -0.4840
max 1 1 1 1 1
Diabetes
n 410 182 439 505 612
mean 0.5955 0.5311 0.6206 0.5930 0.5722
st.dev 0.3169 0.3467 0.3182 0.3202 0.3348
min -0.2390 -0.3490 -0.3490 -0.4290 -0.5940
40
Table A5: Proportion of respondents reporting problems in the five health dimensions
(4 most prevalent LLTIs)
Musculoskeletal Stroke COPD DM
n 7,716 4,154 2,531 2,148
% (range) % (range) % (range) % (range)
Mobility
none 33 (32,36) 32 (30, 37) 45 (38, 51) 36 (34, 40)
some 66 68 55 63
extreme 0 1 0 1
Self-care
none 77 (75,79) 76 (74, 78) 80 (78, 83) 77 (75, 79)
some 22 22 19 21
extreme 1 2 1 2
Usual Activities
none 40 (38,42) 40 (38, 42) 49 (47, 51) 42(39, 45)
some 53 51 43 49
extreme 8 10 8 9
Pain
none 13 (11, 14) 22 (19, 24) 32 (30, 36) 22 (17, 25)
some 67 63 53 61
extreme 20 15 15 17
Anxious
none 67 (50, 71) 64 (45, 71) 62 (47, 69) 62(47,72)
some 29 32 32 33
41
[image:41.595.71.510.106.402.2]PERFORMANCE INDICATOR MODELS
Table A6: Coefficients for the Mobility PI Dimension models
MOBILITY Stroke P Diabetes p Musculo p COPD p Age 0.0371 <0.01 0.0440 <0.01 0.0421 <0.01 0.0472 <0.01
Deprivation
Least Deprived 0.0351 0.78 -0.0635 0.72 -0.0129 0.88 0.0867 0.64 Very Deprived 0.2377 0.05 0.1686 0.31 0.2044 0.02 0.6538 <0.01 Most Deprived 0.3168 0.01 0.2861 0.09 0.3480 <0.05 0.3597 0.02
GHQ = medium (Base)
GHQ low -0.0782 0.46 -0.0828 0.58 -0.1088 0.15 0.1182 0.43 GHQ high 0.1823 0.17 0.3241 0.07 0.0951 0.33 0.2433 0.15 Smoker 0.4609 <0.01 0.0431 0.8 0.2132 0.01 0.3714 <0.01
Sickness
< 6/14 days 0.2109 0.28 -0.4949 0.05 -0.0236 0.86 0.2532 0.28 <13/14 days 0.0426 0.82 0.0991 0.68 0.1042 0.42 0.1335 0.53 14/14 days 0.3043 0.02 0.3633 0.04 0.2297 0.01 0.5447 <0.01 Self-care 1.3896 <0.01 1.6141 <0.01 1.4136 <0.01 1.4369 <0.01 Usual activities 1.4042 <0.01 1.4210 <0.01 1.4019 <0.01 1.3991 <0.01 Pain 0.4645 <0.01 0.7456 <0.01 0.6161 <0.01 0.6661 <0.01 Anxiety -0.3111 <0.01 -0.3215 0.01 0.0495 0.48 -0.2678 0.02
Year
2004 -0.0689 0.73 -0.1032 0.68 0.1102 0.44 -0.2779 0.27 2005 -0.0581 0.66 0.0247 0.9 -0.0748 0.42 -0.1564 0.4 2006 0.0478 0.72 0.0277 0.88 0.1361 0.13 -0.2182 0.21 2008 -0.1124 0.38 0.1225 0.49 0.0828 0.35 -0.2243 0.19
Table A7: Coefficients for the Self-care PI Dimension models
SELF-CARE Stroke p Diabetes p Musculo p COPD p
Age 0.0114 <0.01 0.0039 0.45 0.0145 <0.01 0.0113 0.01
Deprivation
Least Deprived -0.1846 0.18 -0.0336 0.86 -0.1057 0.29 -0.0729 0.74 Very Deprived 0.0447 0.70 0.1936 0.24 0.0556 0.53 0.1776 0.30 Most Deprived 0.2264 0.04 0.1139 0.47 0.2260 0.01 0.2731 0.08
GHQ = medium (Base)
GHQ low -0.1877 0.11 -0.1039 0.53 -0.1196 0.17 -0.0890 0.62 GHQ high 0.2500 0.02 -0.0033 0.98 0.2985 <0.01 0.2354 0.14 Smoker -0.1024 0.40 -0.1493 0.39 0.0851 0.3 0.1826 0.21
Sickness
< 6/14 days -0.0546 0.77 0.1094 0.69 0.2624 0.05 0.1607 0.53 <13/14 days 0.1065 0.50 0.1639 0.45 0.2324 0.05 0.2335 0.26 14/14 days 0.1852 0.07 0.2569 0.08 0.3220 <0.01 0.4074 <0.01 Mobility 1.6221 <0.01 2.0172 <0.01 1.5265 <0.01 1.5472 <0.01 Usual activities 1.5702 <0.01 1.4896 <0.01 1.7137 <0.01 1.4242 <0.01 Pain 0.5308 <0.01 0.5120 <0.01 0.6313 <0.01 0.7923 <0.01 Anxiety 0.4385 <0.01 0.4907 <0.01 0.4126 <0.01 0.3695 <0.01
Year
[image:41.595.74.525.448.738.2]42
Table A8: Coefficients for the Usual Activities PI Dimension models
USUAL ACTIVITIES Stroke p Diabetes p Musculo p COPD p Age 0.0037 0.22 0.0059 0.15 0.0053 <0.01 0.0080 0.01
Deprivation
Least Deprived -0.0011 0.99 -0.0029 0.99 -0.0403 0.59 -0.0958 0.54 Very Deprived 0.1273 0.19 0.0787 0.57 0.1200 0.09 0.1284 0.34 Most Deprived 0.1258 0.2 0.3560 0.01 0.0879 0.22 0.0771 0.54
GHQ = medium (Base)
GHQ low -0.6777 <0.01 -0.6694 <0.01 -0.7131 <0.01 -0.7338 <0.01 GHQ high 0.3984 <0.01 0.5827 <0.01 0.2838 <0.01 0.2390 0.07 Smoker -0.0681 0.5 -0.0325 0.82 -0.0486 0.47 -0.0613 0.6
Sickness
< 6/14 days 0.1024 0.51 0.0476 0.83 0.3810 <0.01 0.1175 0.55 <13/14 days 0.3660 0.01 -0.0002 1 0.2726 0.01 0.3477 0.04 14/14 days 0.5698 <0.01 0.4265 <0.01 0.6517 <0.01 0.5090 <0.01 Mobility 1.5025 <0.01 1.5132 <0.01 1.4439 <0.01 1.5180 <0.01 Self-care 1.6001 <0.01 1.4445 <0.01 1.7857 <0.01 1.5043 <0.01 Pain 0.6581 <0.01 0.8335 <0.01 0.7765 <0.01 0.5927 <0.01 Anxiety 0.0640 0.37 0.1428 0.16 0.0434 0.43 0.1511 0.11
Year
2004 -0.3935 0.02 -0.6108 0.01 -0.4210 <0.01 -0.3477 0.1 2005 -0.1447 0.18 -0.0088 0.96 -0.1643 0.04 0.0073 0.96 2006 -0.0900 0.4 -0.0109 0.94 -0.0688 0.36 -0.1235 0.38 2008 -0.1133 0.27 -0.0706 0.64 -0.1471 0.05 -0.1105 0.43
Table A9: Coefficients for the Pain/discomfort PI Dimension models
PAIN Stroke p Diabetes p Musculo p COPD p
Age -0.0124 <0.01 -0.0022 0.601 -0.0042 0.04 -0.0015 0.64
Deprivation
Least Deprived -0.0945 0.39 -0.1784 0.256 -0.2431 <0.01 -0.4534 <0.01 Very Deprived 0.0311 0.76 -0.0175 0.901 0.1514 0.05 -0.1430 0.28 Most Deprived 0.3195 <0.01 0.2793 0.044 0.1711 0.03 0.0550 0.66
GHQ = medium (Base)
GHQ low -0.1361 0.15 -0.1226 0.356 -0.2530 <0.01 0.0298 0.81 GHQ high 0.3151 <0.01 0.1592 0.263 0.3215 <0.01 0.4932 <0.01 Smoker -0.0273 0.79 0.2254 0.123 0.1151 0.11 0.0875 0.44
Sickness
< 6/14 days 0.2535 0.12 0.4024 0.077 0.1827 0.13 0.2460 0.21 <13/14 days 0.4518 <0.01 0.6305 0.001 0.3824 <0.01 0.2948 0.08 14/14 days 0.3400 <0.01 0.6939 <0.01 0.5661 <0.01 0.4348 <0.01 Mobility 0.4544 <0.01 0.7714 <0.01 0.6203 <0.01 0.7621 <0.01 Self-care 0.6617 <0.01 0.6451 <0.01 0.7212 <0.01 0.9373 <0.01 Usual activities 0.7017 <0.01 0.8803 <0.01 0.8025 <0.01 0.6513 <0.01 Anxiety 0.0914 0.21 -0.0254 0.801 0.2179 <0.01 -0.0729 0.42
Year
[image:42.595.77.511.418.707.2]