GAS PRICES
1978-1980
eurostat
DE EUROPÆISKE FÆLLESSKABERS STATISTISKE KONTOR
STATISTISCHES AMT DER EUROPÄISCHEN GEMEINSCHAFTEN
STATISTICAL OFFICE OF THE EUROPEAN COMMUNITIES
OFFICE STATISTIQUE DES COMMUNAUTÉS EUROPÉENNES
ISTITUTO STATISTICO DELLE COMUNITÀ EUROPEE
BUREAU VOOR DE STATISTIEK DER EUROPESE GEMEENSCHAPPEN
L u x e m b o u r g - K i r c h b e r g , Boite postale 1907 — Tél. 4 3 0 1 1 , Télex : Comeur Lu 3423
GAS PRICES
1978-1980
This publication is also available in French. A translation into German and Italian may be had on demand.
NOTE: In the Statistical Annex, the continental practice of using a comma for the decimal point is adopted.
C O N T E N T S
Page
5 I - INTRODUCTION
6 II - CONDITIONS AND METHODS
6 1. Scope of the study and locations 6 2. Units of measurement of energy 8 3. Standard consumers
9 4· Definition of the price levels recorded
11 III - UNITS OP VALUE
13 IV - SUPPLY, CONSUMPTION AND GENERAL DATA
17 18 24 31 37 42 48 53 59 63
V - GAi 1. 2. 3. 4- 5-6. 7. 8.
9-3 PRICES IN THE PR Germany Prance Italy
Netherlands Belgium Luxembourg United Kingdom Ireland
Denmark
a) Situation in the gas industry b) Taxes
c) Household prices - tariffs d) Household prices - analysis e) Industrial prices - tariffs f) Industrial prices - analysis
67 VI - COMMUNITY COMPARISON AND CONCLUSIONS
Statistical annex
Tables
I - INTRODUCTION
The present publication is an updating of gas prices in the Community up to and including I98O. It follows on as quickly as possible from previous publications, which are still available i
GAS PRICES I976-I978 EUROSTAT 1979 cat. « CA 28-79-326 GAS PRICES I97O-I976 EUROSTAT 1977 cat. - CA 22-77-120
In order to make things easier for users, these volumes from a published series with the same layout and the same system of distribution. They also have similar définitions »methods and coverage and thus form a homogeneous
set. Together, these three publications monitor trends in gas prices and tariffs in the Community countries from 1970 to I98O, and are available in four languages, namely English, French, German and Italian.
In order to avoid repetition, only the general outlines of the survey are set out below in the section entitled "Conditions and methods". If
necessary, reference can always be made to the previous publications.
However, a number of changes have been made to the presentation of the text of this updated version. As there are seldom any changes in the organization of the gas industry and the relevant regulations in each country, the corresponding two sections have been replaced by a section entitled "Situation in the gas industry", which outlines recent
developments which may affect gas prices.
As in the past, this study considers three aspects :
- firstly, description of the tariff systems currently in force on which the prices are based;
- secondly, taxes on gas sales;
- finally, the recording and analysis of price levels, with comments on recent trends.
The whole thing is rounded off by an international comparison, accompanied by a number of conclusions.
II - CONDITIONS AND METHODS
1. Scope and locations
As in the previous study, the survey covers the nine Member States of the Community and the prices were recorded in 27 towns or conurbations:
- PR Germany: Hamburg, Hannover, Düsseldorf, Prankfurt, Stuttgart, München;
- Prance : Lille, Paris (l), Strasbourg, Marseille, Lyon, Toulouse; - Italy : Milan, Turin, Genoa, Rome, Naples;
- Netherlands:Rotterdam;
- Belgium : Antwerp, Brussels, Liègef - Luxembourg: Luxembourg city;
- United Kingdom: London (2), Leeds, Birmingham; - Ireland : Dublin;
- Denmark : Copenhagen.
Three years are covered by this study:
I978 - 1979 - I98O.
The prices are recorded and calculated in accordance with the tariffs, conditions and rules in force at the beginning of each year. I978 is included as a link with the previous study, and also enables any necessary corrections to be made to prices.
2. Units of measurement of energy
Following international resolutions adopted by the General Conference on Weights and Measures, which resulted in the "International System of Units of Measurement" (Si), a number of Council Directives (71/354,
76/770 and 80/I8I) laid down the rules to be followed with regard specifically to units of measurement of energy.
The use of the calorie and its derivatives are now prohibited. Only two units of energy may be used, namely the Joule and the kilowatthour. These two units are derived from the same basic definition, since 1 Joule equals 1 watt/second. However, a concession was granted to the United Kingdom and Ireland, which may continue to use the therm for a transitional period.
(1) Paris region
Four units of measurement are therefore still found in the current gas tariffs, i.e.:
the Joule (Belgium)
the kilowatthour (FR Germany, France)
the D P (Italy, Netherlands, Luxembourg, Denmark) the therm (United Kingdom, Ireland)
(the m is in turn defined by an energy content expressed in Joules).
With a view to standardization and simplification, the Joule (or its decimal multiples) was chosen by the SOEC as the common unit of measurement.
The decimal multiples of the Joule are as follows :
Kilojoule (kj) » 1 000 Joules Megajoule (MJ) « 1 000 000 Joules Gigajoule (GJ) « 1 000 000 000 Joules Terajoule (TJ) - 1 000 000 000 000 Joules.
In the present study, gas prices are expressed in terms of monetary units per Gigajoule.
The table below can be used for conversion from one unit of measurement to another:
1 Gigajoule t
1 Gigawatt hour:
1 Gigacalorie :
1 therm :
GJ
1
3 600
4.186
0.1055
GWh
0.00027771
0.001163
0.0000293
Goal 0.2390
860
1
0.0252
th
9.478134 120
39.683
1
In addition, as a guide, one Gigajoule of gas may be said to be
approximately equivalent to 35 kg of saleable coal and 25 kg of light fuel oil or heating oil.
Finally, the unit of energy used in this study is measured on the basis of the gross calorific value (GOV), as is the practice in the gas
industry and gas tariffs. This method of measurement departs from that used in energy statistics and for other sources of energy, where the net calorific value (NOV), which is closer to the energy that can
actually be used be the consumer, is always used. For gas, the difference between gross and net calorific value is around 10$. The gas prices
3. Standard consumers
The survey is based on the system of standard consumers, i.e. the prices
are recorded for certain levels of gas consumption and under certain
conditions of supply, chosen as being representative of the population of
gas consumers. These standard levels of consumption remain fixed from one
year to the next and for all the countries, this being one of the primary
conditions for spatial and temporal comparability of prices.
Por domestic uses, the standard consumers are determined by the annual
volume of consumption. Five standard consumers, coded D, to D. and
defined as follows, have been taken:
"
ANNUAL CONSUMPTION
EQUIPMENT
2 326 kWh or 2 Goal)
4 652 kWh or 4 Goal)
23 260 kWh or 20 Gcal)
34 890 kWh or 30 Goal)
29 750 kWh or 25O Goal
}
cooking and water heating
Ìcooking, water heating
J and central heating
block central heating for
at least 10 dwellings
For industrial uses, an important factor apart from the annual quantity
consumed is the regularity with which the consumer takes gas from the
network. This is the concept of modulation (or load factor). The daily
modulation indicates the number of days it would take to reach the
annual consumption if the maximum were consumed each day. The hourly
modulation indicates the number of hours it would take to reach the
annual consumption if the maximum were consumed each hour. These factors
thus determine the peaks in consumption or the consumer's maximum daily
and hourly offtake.
Por example, in the case of a user who consumes 41 86O GJ a year, a load
factor of 200 days means that the maximum daily offtake is 209 GJ
(41 860 divided by 200), and a load factor of 1 6OO hours means that the
maximum hourly offtake is 26 GJ (4I 86O divided by 1 6OO).
Seven standard industrial consumers, coded L· to I,. and defined as follows, have been taken:
XV1
ν?
Vi
J4-2h
418.6
4 186 41 860 41 860 418 600 418 600 4 186 000
ANNUAL ( GJ (i.e.
GJ (i.e. GJ (i.e. GJ (i.e. GJ (i.e. GJ (i.e. GJ (i.e.
CONSUMPTION
1
1
116 300 kWh or
163 000 kWh or 11.63
11.63 116.3 116.3 163
GWh or GWh or GWh or GWh or GWh or
100 Gcal)
1 000 Gcal) 10 000 Gcal) 10 000 Gcal) 100 Teal) 100 Teal) 1 000 Teal
LOAD FACTOR no load factor
laid down 200 days
200 days 1 600h 250 days 4 OOOh 25Ο days 4 000 h 330 days 8 000 h 330 days 8 000 h
It can be seen that certain standard consumers have the same load factor for different volumes of consumption or, conversely, different load
factors for the same volume of consumption; the reason for this is to enable the effect of these conditions of supply on the level of prices to be observed. The higher the load factor (in days or hours) the more regular the offtake of gas, thus in some cases, enabling the consumer to obtain favourable prices.
Moreover, the load factor gives some idea of the use made of instal lations consuming gas. Thus, a very high load factor, e.g. of
8 000 hours, is obviously equivalent to an installation functioning practically non-stop, day and night, throughout the 8 76Ο hours in the year.
All the prices recorded in this study for standard industrial consumers normally relate to non-interruptible supplies, i.e. the seller of gas must supply the quantities demanded by the consumer (whose peaks are determined by the modulation laid down for standard consumers). In some cases there are interruptible contracts, under which the seller of gas can reduce the quantities supplied to the consumer at certain peak times when the network is overloaded. In return for this reduction of supply, the customer pays a reduced price.
It should be noted finally that the standard industrial consumers
referred to in this study include neither power stations nor industries using gas for non-energy purposes, e.g. the chemical industry.
4. Definition of the price levels recorded
The prices include meter rental, the standing charge, the commodity rate, etc. They are shown per unit of gas sold, i.e. per Gigajoule (GJ, GCV). This unit price is obtained by dividing the total amount paid by the user for the level of consumption in question by the number of units
In each case, three values are shown: - the price net of tax
- the amount of tax
- the selling price (inclusive of all taxes).
The taxes referred to above are those levied directly on the sale of gas to the consumer. The taxes levied prior to this, such as direct company tax or income tax (which obviously contribute to the manufacturing costs), are not shown separately in this study.
In all but a few cases (which are clearly indicated) the amount of taxes shown in this study corresponds to value added tax. With this dual
presentation of prices, VAT may thus be either included or excluded, depending on the aims of the economic analysis being carried out.
The results for each country are shown in national currencies at current prices, i.e. at face value.
III. UNITS OP VALUE
Gas prices are recorded and presented in national currencies whose real value - or purchasing power - depreciates to a greater or lesser degree in the course of time because of the general trend towards inflation. These price measurement units are therefore not stable, in contrast to scientific quantitative units which have a fixed
definition and a constant value. For example a joule represented
exactly the same amount of energy in 1973 as in I98O, whereas the Lira would not buy the same volume of goods or energy in I98O as in 1973. Consequently, the unit price of energy expressed in a national
currency conceals an unstable ratio which is gradually eroded in the course of time. This presents a problem of comparability in time.
In addition, comparisons between countries of prices expressed in national courrencies necessitate conversion into a common unit. There is no doubt that the usefulness of market exchange rates for this conversion is declining. To resolve this problem, a unit which allows more useful comparisons between countries should used. Purchasing power parities would be best suited to these purposes; i.e. a unit of measurement of values which takes into account the relative
purchasing power of the currencies of the countries being compared. Such a unit therefore eliminates under- and over-estimates of
exchange rates on the international market and is based on the general price levels of the countries concerned. It shows the purchasing capacity of each currency in relation to that of other currencies.
The purchasing power parity is the ratio between two currencies which shows, for example, the number of Belgian Francs equivalent to one Deutsche Mark. A Purchasing Power Standard was defined in order to facilitate compari ¿on between countries and with the European Unit of Account.
It is defined as follows: The purchasing power parity between the Purchasing Power Standard and each national currency expresses the number of national currency units required to purchase in each country of the Community the same volume of goods and services as would be obtained with one Purchasing Power Standard (PPS) in the Community.
The purchasing power of the currencies compared with the PPS was calculated in 1975 from the basic parities of some 1 000 goods and services, comprising 7OO products included under the final
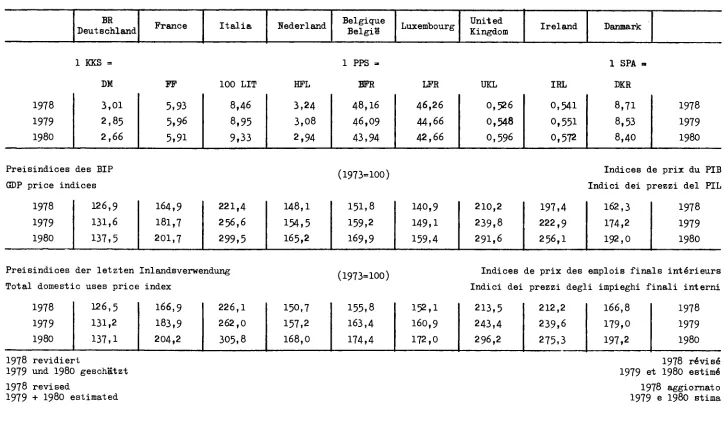
consumption of households, 200 under gross fixed capital formation and 100 under collective consumption of general government. These rates were then extrapolated, taking into account the evolution of price levels in the different countries. The conversion factors between national currencies and PPS for the years covered by this study are given in Table n° 29 in the Annex.
These current PPSs can only be used for comparisons between countries in a given year, because they do not eliminate the general increase in prices in the nine member states which takes place in the course of time. To take this general inflation into account a correction factor or a "deflator" which compensates for monetary depreciation must be used. The deflator chosen for this study is the implied index of
prices for total domestic uses. It is very similar to the implied gross domestic product price index, but is more closely connected to the PPS.
With the help of this index, it is possible to draw up a price series corrected for inflation during the period considered. The total
domestic uses indices for each country of the Community are given in Table n° 29 in the annex, with 1973 as the base year.
The deflated price series was calculated as follows:
1) the prices in national currencies are converted to indices (1973 = 100)
2) these indices are deflated by the total domestic uses price index of each country.
Thus a price index, based on 1973 and corrected for the effects of general inflation in each country, is obtained.
On the basis of this description, the results of this survey of gas prices in the Community are presented using three chronological series:
1) A series of gas prices at face value in the national currency of each country (Tables 1 to 28 in the Annex). This series allows regional comparisons within a country and comparisons in time at face value (apparent price).
2) A series of gas prices in current PPSs (Tables 30, 31, 33 and 34 in the Annex) which allows international comparisons of price levels at a given date.
IV. SUPPLY, CONSUMPTION AND GENERAL DATA
This chapter gives some general information relative to the supply and consumption of gas in the Community countries.
Table A, which applies to natural gas only, shows production, external trade and the consumption of the three main consumer sectors i.e. industry, powerstations, and households. These figures come from the harmonised balancesheets drawn up by the Statistical Office of the European Communities. More detail can be found in the "Energy Statistics Yearbook" - edition EUROSTAT 1979 and I98O. In these
balancesheets the dinstinction between industry and households does not always correspond to the field of application of the various tariffs and thus to the prices recorded.
Continuing on from this, table Β gives some further information relating to households, which is intended to show the penetration of gas in this sector and where possible to give an idea of the extent of gas heating.
Table C brings together some information on industry, to show the importance of the use of gas in industrial activity.
A. S U P P L Y A N D D E L I V E R I E S O P N A T U R A L G A S 1 9 7 7 / 7 3 / 7 9
1000 TJ (GOT)
Production ( l ) Imports
/'NETHERLANDS 1 NORWAY J ALCERIA F r o m /
j LIBYA J USSR 1 OTHERS Exports D e l i v e r i e s of which:
I n d u s t r y (3) Power S t a t i o n s Households
FR GERMANY
1 673.0
8340 36.9 1959 6.2 1 726.5
5990 573.4 284.3
1 9 7 7 PRANGE
2 9 3 9
456.0 16.8 IO5.6 1.2 795.1 27Ο.6 92.Ο I95.O ITALY
5 2 6 . I
139.5 939 256.Ο 997.2 446.9 113·. 8 303.6 NETHER LANDS
3 407.4
10.2 1 910,2 1 4325 3 0 4 . I 4490 4331
BELGIUM
1.3
338.5 1 0 . 3 336.1 143.9 883 3 5 . 3
LUXEM BOURG 193 13.8 3.8 6.8 3.0 UNITED KINGDOM
1 534.3
36.7 33.7 1 543.0
4599 65.3 690.5 FR GERMANY 720.0 713.1 204.7 300,3 10.2 1 331.7 631.9 647.9 341.3
1 9 7 8 PRANCE
3O7.I
4 5 I . 5 68.2 117.6 844.8 298.6 61.2 2 2 0 . 1 '
ITALY 526.0 138.7 94.9 303.5 LO27.O 431.5 107.9 344.2 NETHER LANDS
3 120.2
6 I . 9 1 691.3 1 494.0 306.7 400.0 470.2 BELGIUM 13 3410 549 383.3 139.5 73.2 101.3 LUXEM BOURG
2 1 . 1
2 Ο . 7 10.6 6.3 3.6
UNITED KINGDOM
1 517.6
I7O.6 28.7 1 613.4
453.4 4 7 . 1 764.1
1 9 7 9 ( 2 ) FR GERMANY 741.9 309.8 263.7 351.6 6.7 FRANCE 3OI.5
4 3 5 . I 7 9 . 5 120.0 ' ITALY 5OO.O 163.6 79.6 315.9 NETHER LANDS
3 308,8
9 8 . 4 1 339.4
BELGIUM
1 3
354.0 8 0 . 0 _ _ LUXEM BOURG 22.0 _ _ _ UNITED KINGDOM
1 493.0
_ 322.Ο 25.Ο _ _
( l ) i n c l u d i n g gas recovered from coalmines and sewage gas ¿2) p r o v i s i o n a l
Β. GENERAL DATA CONCERNING HOUSEHOLDS I978
Population
No. of households 'No. of domestic
gas customers Gas consumption of households
Average consumption per customer
No. of homes with gas c e n t r a l heating No. of dwellings with c o l l e c t i v e heating hy gas
Units
1 000 1 000 1 000 1 000 TJ
GJ 1 000 1 000
FR Germany
61 326.5 23 940
7 200 34I.3
47.4O
(2 600
1
France (Gaz de
France) 53 277.3 17 750
7 680 286.5
37.3 2 127
866
I t a l y
56 713.8 15 990
7 256 344.2
47,4 . .
Netherlands
13 94I.7 4 400 4 157 470.2
113.1 3 550
•
Belgium
9 839-5 3 24O 1 719 101.3
58.9
( l 000
I
Luxem bourg
357.6 100
59 3.6 • • •
United Kingdom
55 902.4 18 550 13 963 764.I
54.7 5 500
•
I r e l a n d
3 311.2 730
I52 2.3 I 5 . I 21
—
(1) (1) (1) (1)
Denmark
5 104.2 1 800
470 (2) 4.2 (3) 9.0 (3) 2 (2)
•
C. GENERAL DATA CONCERNING INDUSTRY I978
Turnover of industry Persons employed i n i n d u s t r y
Gas consumption of industry (2)
Numbers'^of i n d u s t r i a l gas customers
Average consumption per customer
Units
106 PPS (1)
1 000
1 000 TJ
1 000
GJ
PR Germany
387 999 8 681
631.9
U . I
44 816
Prance (Gaz de
France)
260 919 6 952
282.2
14.3
19 734
I t a l y
199 900 4 061
431.5
21
20 540
Nether-lands
56 035 1 175
304.1
I7.5
17 377
Belgium
46 368 973
139.5
•
•
Luxem-bourg
2 155 5O.7
10.6
•
•
United Kingdom
322 147 8 864
453,4
70
6 477
Ireland
11 654 2 115
0.61 (3)
3 (3)
204 (3)
Denmark
16 333 405
0.68 (4
5.5
123 (4
(1) see d e f i n i t i o n s i n chapter I I I (2) power s t a t i o n s not included (3) Dublin
1. FR GERMANY
a) Situation in the gas industry
Several hundred gas undertakings operate in PR Germany and may he classified into three categories:
n° - producéis of natural gas
- gas transporters (Ferngasgesellschaften) - gas distrihutors
5
9
474
The producers and transporters sell gas to certain large consumers and also supply the distrihutors.
The latter are therefore mainly retailers although 94 of them also produce gas.
Gas sales made up as follows!
BUYERS
Industry and Power Stations Households Commerce and handicraft Public Admin. Heating stations and others
Natural gas Producers
9
-_
-0
SELLERS Gas
Transporters
30
0
0
0
0
Distributors
28
214
4
4
TOTAL
67
214
4
FR GERMANY
In 1979 the number of gas customers was as below:
Households
of which: tariffs contracts Commerce, small industries Public Administration Industry
Others
1 000 n
7 210 (4 600) (2 600)
285
31
14
Standard consumers
D1D2 D3D4
h h
h h b
Also, more than 500 000 households were heated by heating stations run
on gas.
The largest number of customers receive gas via the distributors. The
producers and transporters supply directly only a small number of large
consumers: 50 power stations, 1 300 industries and around 1 000 public
admi ni st rat i ons.
The six locations chosen for this study, which correspond to six
distribution companies, represent a quarter of the gas sold in
FR Germany by the distributors.
In 1979 natural gas dominated the market with 95
%
of the consumption,
as opposed to 5
%
manufactured gas (not including cokeries gas and blast
furnace gas which are used by their manufacturers). Therefore this study
refers only to natural gas prices.
The sources of supply of natural gas continued to diversify in 1979:
domestic production 34
f
0imports from:
Netherlands
USSR
Norway
38
%
16
%
12 *
100
%
b) Taxes
Sales of gas are subject to value added tax (VAT). On 1 July 1979 the
rate of this tax, which applies to the price before tax, was raised from
12
%
to 13
fo.
This tax is deductible for industrial and commercial
FR GERMANY
c) Household prices - tariffs
According to law the distributors must offer small customers several two-part tariffs, presenting different ratios between the standing charge and the commodity rate.
In general three tariffs are available: a) small users (Kleinverbrauchstarif)
b) two-part tariff n° 1 (Grundpreistarif l) c) two-part tariff n° 2 (Grundpreistarif 2)
with an increasing standing charge and a decreasing commodity rate.
Several examples of these tariffs, valid at the beginning of 198O, are given below:
Location
Hamburg
Düsseldorf
Frankfurt
München
Tariff
a)
a)
c) a)
c) a) b) c)
Standing Charge DM/month
2.85 8.10 13.60 4.5O I2.5O 29.00 6.10 14.75 18.65 2.80 4.20
8.45
Commodity Rate Pf/kWh
9.8O 5.67 4.30 7.12 3.95 3.09 8.06 4.O5 3.71 6.54 5.24 3.92
In some towns a two-part block tariff combines the three tariffs above and leads to slightly cheaper prices for the customer.
In some cases, the standing charge depends on the number of rooms in the dwelling (for example, Hannover). These tariffs apply only to D, and D-(sometimes D.,). Above this level of consumption special contracts
(Sondervertrage) exist for individual central heating and the heating of an appartment block (collective heating).
d) Household prices - analysis
The results are given in Tables n° 1-3 in the annex.
With one exception only, the increase in prices during the reference period remains moderate - 1 to 8 % for small consumers (D, D?) and 1 to
10 % for individual central heating, depending on the location. These increases took place during 1979 as no changes in tariffs occurred between January 1978 and January I979. In certain towns the increase
(l %) comes solely from the increase in the rate of VAT (Düsseldorf, Stuttgart, Hamburg for D.. D? ). The smallest increases were applied to
FR GERMANY
Hamburg Hannover Düsseldorf Frankfurt Stuttgart München
1978 - 67 %
- 59
i
- 64
fo
- 7 0 <fo - 63 % - 62 <f0I98O - 64 %
- 58 %
-64%
- 69 %- 63 %
- 52 %$
V
Di
Without taking changes in tax into account, a certain stability in tariffs, and thus prices, is noticeable. The prices without tax remained unchanged between
V
1977 - I98O in Hamburg (except for D.1976 - I979 in Hannover " 1976 - I98O in Düsseldorf
1978 - I98O in Stuttgart
1976 - 1979 in München (except for D )
This period of calm contrasts with the sharp increases noted after the 1973 crisis. However further increases have been agreed for during I98O.
Price differences between towns depend on the level of consumption as the tariffs and the degression curves vary from one town to another. However, prices in München and Hannover are consistently low. The range of prices remains large e.g. + 50 % difference between the extreme locations for D,. This dispersion is less for larger consumers, + 37 % for individual central heating and + 12 % for collective heating (D.). A comparison may be attempted between the Gross Domestic Product price indices, the average receipts from sales to households and the
selling price of gas in Düsseldorf (chosen as being fairly representative).
1978
1979
1980
* estims (1) Wesi
126.9 131.6* I37.5*
ited ; Germany
average(l) receipts
I46.5
D
l
152.4 I52.4 I53.8D
2
I39.2 I39.2 I4O.5D
3
176.7 176.7 178.31973 = 100
D-.-U D .
3b 4 171.3 176.9 171.3 176.9 173.O 178.4
The indices of gas prices remain above those for all goods and services, although prices have been almost stagnant for the last four years. The average receipts have increased by less than selling prices because of the increase in the average consumption per customer (the effect of tariff degression). Between 1973 and 1978 the average consumption per domestic customer increased by 75 %·
FR GERMANY
e) Industrial prices tariffs
Por industrial consumers no tariffs are published, except for some tariffs for professional uses (Gewerbetarif) which may be applied in some cases to the smallest nondomestic customers (I,)·
Apart from these, selling prices result from special contracts which generally take into account three parameters:
1) standing charge, fixed and independant of consumption 2) offtake charge, which depends on either the capacity
of the installations or the maximum daily or hourly offtake (modulation)
3) commodity rate, most often a single price per unit consumed.
These contracts are revised periodically so as to keep prices in line with those of competing fuels. In general gas prices are aligned, with
some time lag, with prices of fuel oils.
f) Industrial prices analysis
The results are given in Tables n° 46 in the annex.
In this study the data has been completed to the extent that prices representative of the whole of industry are now available, with the exception of some very large industries (I and over) which are
directly supplied by the transmission companies which did not take part in this study.
In Table 5 prices for Ιη in Frankfurt are for special contracts which are now more common.
Except for 1^ whose prices developped in line with domestic tariffs, industrial prices have increased quite sharply during the period
I978I98O. These increases vary from one standard consumer and location to another. Stuttgart had the smallest increases (10 13 %) although it remains the most expensive location. Düsseldorf suffered the largest increases (35 48 %) and consequently becomes one of the more
expensive locations.
Hannover remains the cheapest location. With a few isolated exceptions the largest increases took place during 1979»
Tariff degression has continued to fall i.e.
Hamburg Hannover Düsseldorf Frankfurt Stuttgart München
I978
61
i
-
46
%-
53
% 33
i
23
i
38
i
1980
54
io
-
27 f>- i i i
16
i
14
i
-
27
i
FR GERMANY
The differences in prices noted between I . 1^ _ and I. I -respectively depend either on the modulation or on the ^~ ^~ installed capacity, which is often taken into account in the contracts.
As the contracts and degression curves differ largely from one location to another the regional dispersion remains large and variable depending on the standard consumer.
A comparison between the Gross Domestic Product price index (GDP) and selling prices gives the following results:
1978 1979 1980 * estimai
G. D. P. 126.9 I 3 I . 6 * 137.5* ;ed
h
136.8 136.8 138.IM s s
h
173.8 173.8 239.6eldorf
-V
I86.4 I86.4 252.5
s e l l i n g p r i c e
h*
I85.6 I85.6 252.6
V
229.8 248.5 337.5
1973 - 100
h-2
230.7 250.9 341.3
With the exception of the smallest industrial consumers (ï,), the price of gas to industry has increased by much more than prices for all goods and services, as represented by the GDP price index. Therefore in real terms gas has become more expensive.
2. FRANCE
a) Situation in the gas industry
In France gasworks gas has almost disappeared from the market and
therefore this study covers only natural gas.
Natural gas sales may be broken down as follows:
%
CUSTOMERS
Domestic uses
(individual and
collective)
industry
public power
stations(EDF)
commercial and
other uses
TOTAL
(1)
Gaz de
France
33
32
13
78
(2)
Private
societies
and"regies"
2
0
0
2
SELLERS
(3)
Société
Gaz du
SudOuest
7
7
CEFEM
6
6
SNEA(P)
2
5
7
TOTAL
35
47
5
13
100
(1) represented in this study by Toulouse (except I. I^), Lille, Paris,
Lyon and Marseille.
" ■*
FRANCE
Therefore the national enterprise Gaz de France dominates the domestic and industrial market. The following table gives further information on the sales of this enterprise, in 1979s
Domestic uses: heating tariffs other tariffs Commercial and similar (l) Industry
Sales
lo
28
6
24
42
Customers 1 000 n
2 621 5 059
258
14
Standard consumers
D
3 Df
D
4
h h
^ τΑ IC
3 4 5
The expansion of natural gas sales continues and the number of customers is expected to exceed 8 100 000 during I98O.
This expansion was accompanied by changes in supply:
- imported natural gas accounted for 70 % of supplies in 1979»
- supplies of natural gas are diversifying as regards both origin
and point of entry (in 1979s south-west France 30 %,
Netherlands 49 % Algeria 13 % Norway 8 <f).
At the end of 1979 natural gas began to arrive from the USSR.
b) Taxes
Gas sales are subject to I7.6 % value added tax, based on the price net
of tax. VAT is recoverable in the case of industrial and commercial consumers.
c) Household prices - tariffs
The tariffs for"retail" or "semi-wholesale" sales are of the two-part type. The range of tariffs has been simplified and standardized
throughout Prance. In places supplied with natural gas, the range also includes standardized prices for tariffs for small consumers and a limited number of price levels for tariffs for larger consumers.
As an example, the table below shows the tariff components applicable in the whole area supplied by Gaz de France at the beginning of I98O.
Standard consumer
DD
Κ K-h
ν
Tariff
Bo 3G Bp Heating
Standing charge FF/year I44.OO 897.48 1 547.64
Commodity rate FF/GJ
4Ο.56 2I.7I 21.96
Tarif Bp applies also to commercial uses and similar (standard
consumers I, and Ip in this study).
(l) including collective heating
FRANCE
d) Household prices-analysis
The results are given in Tables n° 7-9 in the annex.
Since 4th January I98O prices for Gas de France domestic customers have been unified and only one tariff system now exists (with the exception of Strasbourg which is not served by Gaz de France, and operates a separate tariff system).
In order to arrive at this unified tariff system the rates of increase varied from one region to another. Between the beginning of 1978 and the beginning of I98O, prices have increased as follows:
D;
D' D ,3*39,5 - 41,2 i 40,9 f
44,5 - 53,6 i 48,1 - 56,7 % 52,3 - 56,4 i
The prices rises were irregular: a rise of 10 % in May 1978 and
varying increases during 1979 and at the beginning of I98O (4th January), which affected the large consumers most, and reduced tariff degression.
Degression (the reduction in unit price when consumption increases from 8,37 GJ to 1 047 GJ) has decreased from - 63 % in I978 to - 59,5 # in I98O.
In Strasbourg, during this period, price increases ranged from 25 f>
(for D, ) to 40 io (for D. ). This means that prices of gas for heating is now lower than the rest of
are higher. )f the country and prices for small consumers
These large increases in selling prices are caused by the cost price of imported gas, which increased by 65 i in one year.
A comparison between the selling price of gas, the gross domestic product (GDP) price index and the average receipts of Gaz de France, gives the following results:
1978
1979
1980
GDP index
I64.8 181.7(2' 206.7(2
Average receipts
159 166(2)
•
D
l
162.3 I78.6 226.4
Selling price
-D2 D3
161.6 177.8 227.6
I69.2 I87.5 251.4
1973 = 100 Paris region
D,. D. 3b 4
I75.3 220.3 195.9 241.9 268.1 344.6
[I]
Gaz de France - all domestic uses, provisional and estimated.It can be seen that prices for small consumers (D,, D«) developped more or less in line with the GDP price index, which means that price
FRANCE
However this is not the case for those who use gas for heating
(standard consumers D. and D.); their gas prices always increased by more than the GDP price index, which means that gas has become more
expensive not only in current terms but also in "constant currency" terms.
The average income per unit sold tended to increase at a slower rate than selling prices, because of the increase in the average consumption per customer (the result of tariff degression). In spite of the price rises, the average consumption per customer continues to rise (by around 35 % since 1973Ìbecause natural gas for heating is still attractively priced compared with domestic heating oil..
e) Industrial pricestariffs
The locations chosen for this study represent the three tariff systems:
Lille, Paris, Lyons, Marseilles, Toulouse (I, Ip I..): Gaz de France Toulouse (I. le): Société du Gaz du Sud Ouest
Strasbourg : Municipal company.
For Gaz de France two types of tariff exist: the type Β for small
industrial consumers (I, I?) and type S or suscription tariffs for larger industrial consumers (ï.. I. Ic) .
v 3 4 Ύ
The Β tariff is already explained in section C as it is also applied to heating.
The tariffs for large industrial consumers I-> I. 1^ have a more complex structure than those described above: they are S tariffs, which can be offered up to the maximum potential supply and subject to special supply conditions.
New subscription tariffs were introduced on 1 December 1979, the old ones being abolished on the same date. The rules for the application of the new tariffs are exactly the same as the previous ones.
The old subscription tariff structure had been drawn up when the Lacq field was developed, and were subsequently extended to the whole of the transmission grid. The structure of these tariffs was no longer a
satisfactory reflection of trends in costs, the conditions of competition and the diversification of the sources of supply.
In particular, the differences in tariff levels for the major transmission routes, which were justified when the latter were supplied continuously from a single source, were no longer suitable for an interconnected grid in which the flows of gas are reversed according to the season, the existence of underground reservoirs or supplies.
For some years, the extent of these differences had been limited when the price increases authorized by the public authorities were imposed, although this had had an adverse effect on the simplicity of the tariff structure.
The structure of the new subscription tariffs is simpler than that of the old tariffs. It comprises:
FRANCE
an identical annual subscription for every point on the grid; a daily standing charge on the customer's daily demand (kWh/day); a commodity charge per kilowatt hour for two blocks of consumption.
These tariffs have two versions corresponding to the type of network to which the customer's installations are connected, namely the SR tariff for installations connected to the public distribution network and the ST tariff for installations connected directly to the transmission grid.
A single tariff is applied to the major interconnected transmission routes linking the country's sources of gas; prices for the minor routes are obtained by adding the charges specific to each one to this tariff.
Like the old tariffs, the new subscription tariffs relate to the index N as defined by the formula:
N
50F + ¿0Ç Fo Cowhere C represents the wholesale price of French raw coal as published by the Institut National de la Statistique et des Etudes
Economiques ; et
F represents half the sum of the Atlantic and Mediterranean zone exrefinery prices for N° 2 heavy fuel oil on the wholesale market.
Co and Fo are the value of C and F at 31 January 1959·
As at 1 December 1979, their components corresponded to a value of 426 for the index N.
The index N applies to all elements of the tariff formulae. Also, the commodity rates vary not only according to N, but also by adding a supplement to the absolute value per kWh.
As an example, the table below shows the tariff components applicable in the Paris region:
N = 426
Standard consumer
Σ3
h
h
Tariff
SR
ST
Annual suscription charge
FF 24 000
FF 24 000
Standing charge
(1)
FF 4 3 . 4 2 / G J
FF 3 3 . 6 9 / G J
Commodity rate
Up to 24 χ 10 kWh/year
FF 1 3 . 2 3 / G J
excess
FF 1 2 . 6 8 / G J
Up to 24 χ 10 kWh/year FP 13.09/GJ
excess FF 12.54/GJ
(l) per GJ maximum daily offtake
FRANCE
f) Industrial prices - analysis
The results are given in Tables n° 10-12 in the annex.
With the exception of Strasbourg, tariffs for small industrial
consumers I, and I? are uniform throughout the country, as of 4th
January I98O. During the period under consideration these consumers suffered rises of between 36 and 66 $, the largest increases being applied during 1979, and being applied to the regions which were originally cheapest, in order to arrive at a uniform national tariff.
For Gaz de France's larger industrial consumers (I, I I,.) prices were unchanged between January I978 and January 1979, but ^suffered the following increases during 1979s
3-1 3-2 r4-i
4-2
35
-
51f
51 -
66 i
65
-
80
i
75
-
82
i
80
-
87
i
These increases are due to changes in the index Ν which is influenced by the price of oil.
Gas supplied to Toulouse industry (I«, 1^) by Gaz du Sud Ouest is
cheeper than Gaz de France because of the proximity of the French gas fields.
Nevertheless, the regional price differences are small, around 5 % in
I98O.
As the largest price increases were applied to the larger consumers tariff degression was considerably reduced. Thus, the reduction in unit price between standard consumers at either end of the range (L· and I-) fell
from - 51 % to - 36 % in Paris between I978 and I98O. ' ->
The modulation (maximum daily offtake) has a small influence on prices,
for example, prices are reduced by around 3 % when the modulation is
increased from 200 days to 250 days, and by 2,5 70 when modulation passes
from 250 days to 330 days (standard consumers I, and
V·
A comparison between the Gross Domestic Price index (GDP) and the selling prices of gas gives the following results:
1973 - 100
GDP
price index selling price "3-1 Paris region J
3-2
V l
4-2 19781979 I98O
I64.8 I8I.7 2OI.7
I57.I I5I.4 23O.6 232.2 229.3 161.6 154.4 230.6 232.2 229.3 225.9 222.3 347.5 384.9 413.9
231.7 246.2 231.7 246.2 421.3 46O.9
(The average receipts for industrial consumers is not available).
FRANCE
With the exception of small industrial consumers (L. I?) the selling
price of gas increased by more than prices for the whole of goods and services, as measured by the GDP price index. Natural gas has become more expensive not only in current terms, but also in real terms.
In spite of these price increases the average consumption of
3. ITALY
a) Situation in the gas industry
The structure of the gas industry, which has a considerable influence on price formation, has two levels:
SNAM, a company of the ENI group, which is the sole producer, importer, transporter and wholesale distributor of natural gas. In particular, SNAM supplies gas directly to industries consuming over 70O 000 nß a year (l) (i.e. approximately 27000 GJ), as well as to the distribution undertakings.
The gas distributors, whose function is to distribute gas to small consumers. They receive natural gas from SNAM and resell it either as it is or mixed with other gases. In some cases, they also produce manufactured gases. These distributors (approximately 1 300 local
networks in 1980) are either local authorities, municipal undertakings or concessionary companies.
SNAM applies a standard national tariff. On the other hand, each
distributor issues its own tariffs according to a method introduced in 1973 by the Interministerial Price Committee (CIP), which takes into account not only the costs of raw materials but also a series of other factors which vary from one local authority to another. This leads to a profusion of tariffs, which would be impossible to describe in this study and which explains the differences in prices for small consumers from one location to another.
In 1979 gas ressources comprised 98 % natural gas (produced domestically or imported) and 2 % works gas (excluding cokeoven gas and blast
furnace gas, which the works retain for their own use).
Natural gas sales are made up by the following:
SNAM direct sales
Γ industry
i.e. ■< power stations C chemical synthesis SNAM sales to distributors
¿# β # f household uses ^ Nonhousehold uses
sales as motor fuel
%
62
(45) (8,1) (8,9)
37
(34) (3)
1
Standard consumer
τι τΛ Ic
3
_45
V 2
D3
D4
1 Io
2
ITALY
In 1979 the number of subscribers was broken down approximately as follows:
Supplied by SNAM 4 500
Supplied via distributors 7 400 000
industry
chemical synthesis other
distribution companies
households (l) shops
small industries
3 000 22 228 1 250
7 256 000 126 000 18 000
(l) Including collective heating
Over the past few years the sources of natural gas supplies have diversified, to the detriment of national production:
Domestic production Netherlands
USSR Libya
19J8 48 i 13 i 30 $
9
io1979 47 $
15,5
i
30 $7-5
i
b) Taxes
An order in Council of 7 February 1977 introduced a consumption tax (imposta di consumo) on sales of natural gas for household uses, at a , rate initially fixed at LIT 30 per m3 and increased to LIT 36.50 per m from September 1979« This tax also applies to natural gas mixed with other gases. Manufactured gas is also subject to this consumption tax in proportion to the percentage of natural gas used in its manufacture (circular n° 59 of July 1977).
Thus in I98O, the consumption tax on the manufactured gas included in this study is as follows:
LIT I4.5O per m^ in Milan (20 63O kj/m5)
LIT 12.80 per m in Rome
the differing rates being due to the different composition of the two gases.
In addition, value added tax (VAT) is levied at the rate of 6 % for household uses and I4 f> for other uses, to ba calculated on the price net of VAT but including the consumption tax. VAT is deductible in the case of commercial and industrial consumers.
c) Household prices - tariffs
ITALY
depending on the tariff degression curves determined by the ratio between fixed and commodity costs.
This leads to two- or three-part tariff formulae, comprising: meter rental
standing charge (quota di servizio)
commodity rate (sometimes in block form).
The first two components of the formulae depend on the number of "flames", which represent the user's equipment and, therefore, consumption capacity. The contractual number of flames taken into account is determined freely by each distribution undertaking,
provided the statutory limits are observed. This number may therefore differ from one location to another. It may also differ between the component relating to meter rental and the standing charge (quota di servizio). The standing charge is degressive and although differing according to the number of flames, is not directly proportional.
For guidance, the number of flames corresponding to the standard consumption levels is roughly as follows:
D, 10 flames
D2 10 - 20 flames
D- 20 - 40 flames D~. 40 - 50 flames D^ 100 - 300 flames.
The price of natural gas is affected by SNAM's tariff for sales to distributors. The commodity rate in this tariff varies according to the selling price of heating oil (agreement of 15 February 1979, which provides for LIT 0.8l per m-^ to be passed on to the price of natural gas for each lira increase in the free-to-consumer price per kg of heating oil.
d) Household prices - analysis
The results are given in tables n°s 13, 14, 15 in the annex. The figures for Naples for 1978 have been revised.
In spite of the differing tariff systems in force throughout the country trends in prices have been the same, moderate rises (even reduction in prices in Rome) during 1978, followed by much larger increases during 1979· Natural gas prices increased as much as manufactured gas prices. The rates of increase vary from one location to another and from one
standard consumer to another. Most cities applied smaller increases to the smaller customers, for social reasons. Tariff degression is low around -13 % (D. D, ) in all locations (but -23 % in Genoa and - 38 % in Naples) and does not seem to be affected by the type of gas.
Manufactured gas is still quite a bit more expensive than natural gas and the difference in the types of gas is the main reason for the large regional differences in prices.
33
ITALY
In spite of the diversity of prices a comparison may he attempted with the Gross Domestic Product price index (GDP). In general the selling price of gas to the smallest consumers did not increase by much more than the prices for the whole of goods and services. This was not the case for gas used for heating purposes.
1978
1979
1980
GDP
221.4
256.6 *
300.0 *
D
l
233.9
208.O
312.4
s e l l i n g p r i c e s :
D
2
315.5
267.8
393.4
Rome,
D
3
430.2
363.2
580.5
1973
n a t u r a l gas
46O.6
387.4
622.3
= 100
D
4
6 I 5 . 5
515.6
796.6
» estimated and provisional
β) Industrial prices tariffs
A distinción must be made between the two systems of gas supply.
1) Small industrial consumers (I,, I?) who are supplied by the urban networks of the local distribution companies and for whom the tariffs differ from city to city (the tariffs are two or threepart, with a standing charge, a charge for meter rental and a degressive
commodity rate);
2) Other industrial consumers (ï,, I, L ) who are supplied mainly by SNAM, which applies a standardize' id n a t ional tariff.
Since January 1978 SNAM's prices for noninterruptible supplies have been based on a tariff divided into consumption blocks, directly linked to the price of heavy fuel oil:
Consumption block
< 3 000 000 m3/year
3 25 000 000 πκ/year
> 2 5 000 000 n r / y e a r
P r i c e
P
Tm
Ρ
χ
1.03
Ρ
» Ρ
ρ
ϊϊι "
Ρ
Χ
°'
961
with Ρ - 0.845 χ 1.077 (0.7 ATZ + 0.3 ΒΤΖ + 0.8 Τ) χ 0.9842, where
of
Ρ · price of natural gas in LIT per standard m" 38 100 kJ (GCV) (9 100 kcal GCV)
Ο.845 ■ ratio of calorific equivalence, in terms of NCV,
between natural gas and fuel oil;
I.O77 ■ factor of qualitative advantage of natural gas over fuel oil
ATZ, ΒΤΖ «. average price of 1 kg of high and lowsulphur fuel oil respectively at coastal depot, charged by the Milan branch office of AGIP during the month preceding consumption of the gas.
ITALY
The values of Ρ are as follows: 1978 Ρ - 69.86 1979 Ρ - 71.154 1980 Ρ - 125.121
For interruptible types of industrial consumption, the price is given by the formula:
Ρ = ATZ χ 0.91 Accordingly, Ρ = 65.282 in I979
Ρ = 118.114 in I98O.
These tariff formulae do not apply to either supplies to power stations (ENEL tariff) or deliveries to local gas distribution undertakings.
The price of gas for chemical synthesis (use for non-energy purposes) is aligned on that of the tariff for non-interruptible types of industrial consumption, except for gas to be used in the manufacture of fertilizer for the domestic market, for which the price was fixed at LIT 58.2/ standard m3 in I98O (as against LIT 38.2 in 1978).
It can be seen that SNAM1s industrial tariffs do not include any
component for the regularity of gas offtake (modulation or load factor). Consequently, the price levels vary solely as a function of the volume of consumption.
f) Industrial prices - analysis
The results are given in tables n° 16 - 18 in the annex.
Because small industrial consumers (L.and I? in this study) are supplied
by local distribution companies prices vary widely from one city to another. However the trends have been similar in all cities, little change in prices during 1978, followed by large increases during 1979« This was caused by a sharp increase in the price charged by SNAM to the distributors. The difference in price between natural gas and
manufactured gas is not as large as in 1978. For example the difference in price for Turin (natural gas) and Milan (manufactured gas) was
+ 60 i for I in 1978 and + 45 % in I98O.
Tariff degression remains low.
For larger consumers, supplied by SNAM, prices are uniform througout the whole country. Between 1978 and I980 SNAM prices for direct sales,
non-interruptible, to industry increased by 83 % for all customers.
The largest increase took place during 1979, and was because the tariff incorporates the price of heavy fuel oil. Modulation (regularity of offtake) has no effect on prices. Table n° 18 gives an example of prices applied by a local distributor (Genoa) to large industry, which is
exceptional. The prices differ little from those applied by SNAM.
There has been no appreciable change in tariff degression. When
consumption increases one hundred times I, to 1^ the price is reduced by only 5 fo. J 5
ITALY
Finally, a comparison may be made between the GDP price index and the selling prices of natural gas.
1978
1979
1980
GDP
22I.4
256.6 *
300 *
h
489
498
897
Selling price
502
511
920
1973 - 100
(SNAM)
X
5
495
504
908
* estimated and provisional
4. NETHERLANDS
a) Situation in the gas industry
The gas industry has three levels: 1) natural gas production (NAM )
2) transporting, importing and selling to very large consumers connected to the main transmission grid (GASUNIE)
3) distribution (local societies or communal enterprises).
Direct sales by GASUNIE represent around 45 % of the volume of gas sold (20 % of which goes to power stations), the remaining 55 % is supplied to the public via the distribution companies.
GASUNIE supplies 136 distribution companies, 29 power stations and 389 large industrial enterprises.
For the distribution companies the number of customers and gas sales may be broken down as follows:
- Small Consumers 4 2 1 Gj/year i.e. 21-6000 Gj/year
reduced tariffs (of which domestic
consumers) - Large Consumers
( > 6OOO Gj/year)
TOTAL
Customers 1 000 n
4
375606
3
7663
(4
160)
18
4
393Sales
*
§1
1
63
1
(53)
3¿
100
Standard consumers
D D
D
3
\ h h
D
l - *
D4h h h
Although the distribution system is decentralised, the tariff system is uniform (with reductions, however, in the areas close to the Groningen gas fields) and prices indicated for Rotterdam are respresentative for the whole country.
The Groningen gas fields remain the principal source of natural gas consumed in the country. However, during the last three years imports of gas from Norway have been increasing, as part of the policy to conserve national ressources.
NETHERLANDS
These imports from Norway reached:
in 1978 - 62 000 TJ i.e. 4% of inland consumption
in 1979 - 98 000 TJ i.e. 6 % of inland consumption.
b) Taxes
The rate of value added tax (Belasting toegevoegde waarde) was
increased from 4 % to 18 % of the price net of tax with effect from
1 April 1978. VAT is deductible in the case of industrial and commercial consumers.
In addition, a special air pollution levy (Heffingbrandstoffen
luchtverontreiniging) is charged on household tariffs only, at a rate of 0.03 cents per ΠΗ, i.e. approximately HFL 0.01/Gigajoule.
c) Household prices - tariffs
All small consumers(domestic, commercial, industrial, etc.) with an annual consumption of up to I70 000 m3 are charged according to a simple two-part tariff system, the rates of which are revised periodically.
The general tariff, which applies to standard consumers D.., D? and D-,
is as follows:
Date
January I978
January I979
January I98O
Blocks of Annual Consumption
0 - 600 m3 60I - I70 000 πΓ
0 - 600 ffi3 601 - 170 000 nr
0 - 600 m3 60I - I70 000 m"3
Standing Charge HFL/year
45 69
45 57
48
Commodity Rate cents/m3
27 23
27 25
29
There is also a tariff for collective central heating
(Bldsrerwarmingsta-rief), which applies to standard consumer D.:
Date
January I978 January 1979 January I980
Standing Charge HFL/year 12n(minimum I50) 12n(minimum 150) 15n(minimum I80)
Commodity Rate cents m3
23 25 29
η t= number of appartments
NETHERLANDS
d) Household price - analysis
The results are given in Table n°. 19 in the annex.
Between the beginning of 1978 and the beginning of I98O prices for
domestic customers have increased by between 22 % and 43 %· The largest
increases were during 1978 and were due largely to increases in the rate
of VAT, as prices before tax showed little change during that period.
The rate of increase rises as consumption rises, leading to a reduction
in tariff degression. The relative difference in unit price between
D., and D. has been reduced from - 49 $ in I978 to - 40 % in I98O. Nevertheless this degression is still large and encourages the use of
gas for heating. At present, 95 % of customers use gas for heating their
dwelling. Moreover, the price of natural gas remains very attractive
compared with heating gas-oil.
A comparison with the Gross Domestic Product (GDP) price index gives
the following results:
1978
1979
1980
GDP price index
I48.I 154.5 * 165 *
D
l
UI
160 171, D2
135 154 165
Selling price
B3
I89 227 257
1973
-D31>
212 257 293
100
D
4
278 343 398* provisional and estimated
Gas prices have increased by more than prices for all goods and services,
represented by the GDP price index. Gas has therefore become more
expensive in real terms. Although the difference is not significant for
the smallest consumers (D.. Dp) they represent only a very small part of the clientele.
e) Industrial prices - tariffs
The tariff system introduced on 1 January 1978 is still in force, with a number of minor changes. The tariff is based on blocks of consumption and indexed to fuel oil prices.
Blocks of annual consumptior
0 - I70 000 m3
170 000 - 1 million m:? 1 - 1 0 " m~ 10 - 50 " nu
y
50 " nr
Pri 1978
16.0 + 2.8 + C 16.0 + 2.2 + C 16.0 + 1.8 + C 16.0 + 1.7 + C
ce
a
in
ho\
cents/m3
1 1979 and I98O
is ehold tariff 16.0 + 2.8 + C 16.0 + 2.2 + C 16.0 + 1.4 + C 16.0 + 0.0 + C
These tariffs are based on a standard m of 35.17 MJ (GCV).
NETHERLANDS
C is the adjustment coefficient linked to the price of fuel oil:
C (16.0 χ Ρ ) 16.0. 200
Ρ is the annual average price of fuel oil with a viscocity greater than 65 Cst at 50° C and a net calorific value of 41*45 Mj/kg, for
deliveries of at leasts 2 000 tonnes per quarter.
Ρ is calculated annually by the Central Statistical Office (CBS).
As bills are sent every quarter, the prices are calculated on the basis of a provisional value of Ρ estimated by Gasunie. The annual balance is settled at a later date; consumers are contractually exempted from making good any underpayments, whereas any overpayments must be refunded to them.
The value of Ρ is as follows:
1978: Ρ = 197.19 1979: Ρ = 210
19¿0: Ρ = 295 (provisional).
Customers consuming more than 1 million m /year, whose load factor is less than I50 days, pay an additional charge of ( 1 load factor)
cents/m3. I50
From now on, all contracts will be concluded on the basis of these tariff formulae, which result in a degressive price depending on the volume of consumption and do not include a component based on the regularity of offtake, except in the case of a low load factor ( < I50 days), which does not apply to the standard consumers considered in this study.
f) Industrial pricesanalysis
The results are given in Table n° 20 in the annex.
The prices published in the previous study for the beginning of 1978, which were based on a provisional value of P, have had to be corrected.
In fact the final value of Ρ was below the provisional value and,according to the tariff regulations, the excess had to be repaid to the customers. This has been taken into account in this study as the aim is to present prie es actually paid by the consumer.
During the two years under study, industrial gas prices have become more expensive, by from 4I % to 62 %. This was caused largely by the increase in VAT during 1978, and rapidly rising petrol prices during 1979,
especially for standard consumers I, I. I, whose prices are pegged to fuel oil prices by the coefficient P.
Prices without tax increased by from 24 i to 43 % depending on consumption during the same two years.
NETHERLANDS
It can be seen that the rates of increase differ according to the volume consumed, in general the largest consumers are subjected to the largest increases. However, the increases for the largest consumers (i^) have been limited to some extent as can be seen in the table in the annex.
In spite of this, tariff degression, i.e. the reduction in unit price between the extreme standard consumers (I, 1^) has been reduced to 17 % in I98O, as opposed to 25 % in I978. If we consider prices within one tariff group (ï, I. IR) , degression is only 9 i in I98O, between I, and I,, although"., although1 1^ consumes one hundred times as much lì
annually as I
3*
As the tariffs do not contain any elements which depend on the regularity of offtake, modulation does not effect prices and thus prices for I and I,_p a r e identical, as are prices for Ι Λ and
I42*.
It should be noted also, that a reduction of 0.75 cents/m , i.e. 22 cents/GJ is given in the three northern provinces close to the gas fields.
A comparison between the Gross Domestic Product (GDP) price index and the selling prices gives the following results:
1973 = 100
GDP price index
Selling price
4
I978 1979 1980
148.1
154.5 *
165
*
258
316
365
284
350
406
235 283 372
237 283 384
292 329 457
* provisional and estimated
In all cases, selling prices have increased by much more than prices for all goods and services (GDP) with several differences visible between the two types of tariff.