This is a repository copy of Does Personality Influence Engagement in Mobile ‘Phone Tasks?.
White Rose Research Online URL for this paper: http://eprints.whiterose.ac.uk/84454/
Version: Accepted Version
Proceedings Paper:
Merat, N and Coleman, J (2013) Does Personality Influence Engagement in Mobile ‘Phone Tasks? In: PROCEEDINGS of the Seventh International Driving Symposium on Human Factors in Driver Assessment, Training, and Vehicle Design. 7th International Driving Symposium on Human Factors in Driver Assessment, Training and Vehicle Design, 17-20 Jun 2013, New York, USA. , 502 - 508.
Reuse
Unless indicated otherwise, fulltext items are protected by copyright with all rights reserved. The copyright exception in section 29 of the Copyright, Designs and Patents Act 1988 allows the making of a single copy solely for the purpose of non-commercial research or private study within the limits of fair dealing. The publisher or other rights-holder may allow further reproduction and re-use of this version - refer to the White Rose Research Online record for this item. Where records identify the publisher as the copyright holder, users can verify any specific terms of use on the publisher’s website.
Takedown
If you consider content in White Rose Research Online to be in breach of UK law, please notify us by
COVER PAGE
Name of author 1: Natasha Merat Name of author 2: James Coleman
Organization of Authors: Institute for Transport Studies, University of Leeds
Name of contact author: Natasha Merat
Mailing address: Institute for Transport Studies, University of Leeds, Leeds, LS2 9JT, U.K.
Phone number: +44 113 343 6614
Fax number: +44 113 343 5334
Email address: [email protected]
Presentation Type Requested: Poster or hybrid
Keywords:
Mobile telephone engagement Driving simulator
DOES PERSONALITY INFLUENCE ENGAGEMENT IN MOBILE ‘PHONE TASKS?
Natasha Merat and James Coleman Institute for Transport Studies,
University of Leeds, U.K.
Summary: Drivers’ propensity to engage in a telephone conversation and text messaging was observed in a driving simulator study and compared to self-reported engagement in such tasks in the real world. As sensation seeking has been linked to unsafe driving behaviours and self-reported driving violations, drivers were preselected for the study using the Arnett Inventory of Sensation Seeking. In general, drivers’ observed engagement with their mobile phone was not as high in the driving simulator as their self-reported declarations. Some differences were found between the high and low sensation seekers, with more phone calls executed by the high sensation seekers and more text messages performed by the low sensation seekers. Self-report results showed higher engagement in hands-held conversations and text messaging by high sensation seekers.
INTRODUCTION
The prevalence of mobile phone use while driving continues to be significant despite widespread legislation restricting the activity (see Jamson, 2013). Varying levels of
engagement with mobile devices are reported in Europe and globally: around 60% of drivers use their mobile phones while driving in New Zealand, Australia, Spain and the United States (Gras et al.2007; Stutts et al., 2003; McEvoy et al.2006; Young & Lenné, 2010), whilst engagement in Canada is somewhat lower at 40% (Laberge-Nadeau et al., 2003). Sweden reports the lowest levels of engagement with mobile phones while driving at 30% (Thulin & Gustafsson, 2004).
The negative effect of engaging in mobile phone conversations on driving performance and vehicle control is now well established. Examples include poor lateral deviation of the vehicle (Young, Salmon & Cornelisson, 2012) and inadequate reaction to hazards (Burns, et al., 2002) during text messaging and hand-held telephone conversations.
In terms of an engagement in distracting tasks (during driving) by certain groups or
the age of 25 are most likely to use their mobile phones whilst driving (Brusque & Alauzet, 2008; Korpinen & Pääkkönen, 2012).
In the UK, legislation introduced in 2003 advises against the use of hands-held telephones whilst driving. However, a comprehensive observation survey commissioned by the UK Department for Transport found that 2.9% of drivers were indeed still using their mobile phones whilst driving (Department for Transport, 2009). A more recent observation study (conducted during day light hours only) reports an increase in this initial figure, with 4.3% of the 7168 observed occupants using their mobile phone during driving (Sullman, 2012)
For this study, we compared drivers’ self-reported feedback of mobile device use in driving, with their actual engagement in such tasks, during a driving simulator experiment. Drivers were provided with the choice of engaging in a mobile telephone conversation and
responding to a series of text messages. As some studies suggest that driver characteristics may play a role in their propensity to engage in mobile devices whilst driving, participants were pre-selected for this study, using a web survey, with questions based on the Arnett Inventory of Sensation Seeking (AISS, Arnett, 1994). Sensation seeking (SS) has been used extensively in personality and driving studies, and has for instance been shown to predict unsafe driving behaviours and self-reported driving violations (Dahlen & White, 2006; Jonah, 1997). We hypothesised that high sensation seekers were more likely to engage in a mobile ‘phone task, responding to the phone calls and text messages more often than those scoring low on the sensation seeking scale.
METHOD
Recruitment of volunteers for this study took place in two stages. In the first instance, an email was sent to all staff at the University of Leeds, who were asked to complete a short (20 questions) sensation seeking scale on-line questionnaire (Arnett, 1994). To enhance the number and range of responses, social networking resources (Twitter and Facebook) were also used, requesting participation from drivers in Leeds and the surrounding areas. Ninety eight drivers completed this questionnaire. Two groups of low and high sensation seekers were then formed by inviting all those within 9 score points of the upper (80) and lower (20) range of the sensation seeking scale to the University of Leeds Driving Simulator (UoLDS). Participants
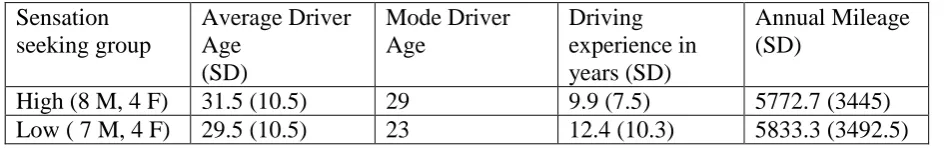
[image:4.595.64.539.653.729.2]Twenty three volunteers (11 low sensation seekers and 12 high sensation seekers) participated in the driving simulator study. Drivers’ age and driving experience is summarised in Table 1.
Table 1 –Drivers’ age and licence information
Sensation seeking group
Average Driver Age
(SD)
Mode Driver Age
Driving experience in years (SD)
Annual Mileage (SD)
Design and Procedure
The motion based University of Leeds Driving Simulator was used for this study (Figure 1). A within-participants design was used, whereby all participants were asked to drive a 2-lane section of motorway. Traffic was randomly generated from a selection of lorries and cars, each with a variable speed, and with freedom to overtake, if appropriate. Participants were also able to pass the traffic, if desired.
The driving study began with a twenty minute familiarisation period with the researcher present in the car. Participants were then asked to drive the motorway in isolation (~45 minutes), whilst the researcher interacted with them from the control room, calling and texting them on their own mobile telephone. Before commencing the drive, participants were told that the researcher would contact them on their mobile telephone and that they were not obliged to respond to the call or text and should behave as they would in the real world. To maintain a similar level of engagement from participants and good control on the contents of the ‘phone conversation’,
participants were asked to engage in a Twenty Questions Task (TQT) by the researcher (see Merat & Jamson, 2012). Following the TQT, participants’ willingness to generate a call was tested by a telephone call from the researcher, asking the driver to call him back. Finally, a series of text-based exchanges between the researcher and the driver were initiated. Here five short (4/5 word) sentences were sent asking participants simple questions such as: “What day is it?” Or “What is the capital of France?”
Following the driving simulator study, participants were asked to complete a short 20 item questionnaire, where their opinion on the distracting effects of a number of in-car tasks was sought. The questions were based on a paper by Lansdown (2012), and responses were marked on a 5 point Likert scale for distraction rating, (‘1’ –not distracting to ‘5’ – very distracting). As well as stating how distracting they judged a particular activity to be,
participants were also required to record how often they actually engaged in these distracting activities (daily, weekly, monthly and yearly: 1-4 respectively). The main purpose of
administering this questionnaire was to compare drivers’ self-reported engagement with various distracting tasks, compared to engagements observed in the driving simulator study.
RESULTS
[image:5.595.322.538.187.330.2]The low sensation seekers’ score on the AISS ranged between 40 and 49 (mean: 45.4) and the high sensation seekers scored between 62 and 71 (mean: 65.2). In terms of engagement in the mobile phone tasks during the simulated drive, three out of eleven (27%) of the low SSs and 5 out of 12 (42%) of the high SSs responded to the first telephone call. However, whilst all three of the low SSs engaged in the TQT, only 3 out of 5 of the high SSs continued to talk to the researcher after answering the phone, with two high SSs talking for around 30 seconds,
disengagement. The difference between response of the high and low sensation seekers to the telephone call was not significant [ 2 (1, N=23) = 9.9, p = .99].
With respect to text messages, 16 messages were sent by the low SSs and 10 by the high sensation seekers. However, this difference in text message engagement was not found to be statistically significant ( 2 (1, N=115) = 69.32, p = .99). The time taken to respond to these text messages was found to be 300 ms for the high and 610 ms for the low SSs (all responses were correct).
[image:6.595.86.515.289.571.2]With respect to the post-test questionnaire, both high and low sensation seekers rated “writing a text message” as the most distracting activity, followed closely by “talking on a hands-held telephone”. These ratings are similar to those found by Lansdowne (2012) with ‘writing a text message” rated as the most distracting activity by his survey respondents. The activities scored to be the least distracting in our study were “interacting with other passengers” and “using the in-car entertainment system” (See Figure 2Error! Reference source not found.).
Figure 2 - Drivers’ rating and actual engagement in distracting tasks
Participants from both groups provided very similar ratings for the level of distraction imposed by each activity, with no significant difference in distraction rating between the two groups (p =.47). However, analyses showed a statistically significant difference between the two groups, in terms of their actual engagement in these activities (t (14) = 3.1, p < .001). As shown in Figure 2Error! Reference source not found., high sensation seekers admitted to engaging in telephone conversations (both hands-held and hands-free) more often than low sensation seekers and also used add on media devices more often than low sensation seekers.
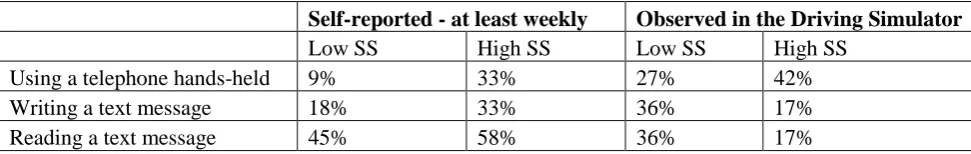
percentage of high sensation seekers admitted to using a hands-held telephone and reading/writing text messages on a weekly basis, although this was not observed in the driving simulator. Chi squared comparisons did not show any significant differences between the two groups, or between the observed and reported results.
Table 2 – Percentage of drivers participating in mobile phone activities
Self-reported - at least weekly Observed in the Driving Simulator
Low SS High SS Low SS High SS
Using a telephone hands-held 9% 33% 27% 42%
Writing a text message 18% 33% 36% 17%
Reading a text message 45% 58% 36% 17%
CONCLUSIONS
This study was devised to compare drivers’ actual engagement in mobile telephone conversations and text messaging in a driving simulator environment, with their self-reported/self-confessed engagement in such tasks during real-world driving. Drivers’
perception of the distracting effects of interacting with mobile devices was also sought, using a short questionnaire. As previous research has suggested that driver personality may play a role in propensity to engage in riskier driving behaviour (such as engagement in distracting activities), participants were pre-selected using a short questionnaire based on the AISS (Arnett, 1994).
The observation study found that less than half the drivers in each group engaged in the mobile telephone conversations during the simulated drive, and although a larger number of high sensation seekers responded to the researcher’s telephone call than the low sensation seeking group, this difference was not significant. On the other hand, low sensation seekers participated in more text messages than high sensation seekers, but the difference in number of text messages was not found to be statistically significant between the two groups.
Although more than half of the drivers in each group admitted to using a hands-held phone at least weekly when driving in the real world, for both groups, a lower proportion actually engaged in such activities when observed in the driving simulator.
It was interesting to note that although both groups scored texting and talking on a mobile telephone as the most distracting activities in a driving environment, over half of the drivers in each group admitted to engaging with a hands-held phone or texting, at least weekly, in the real world. Therefore, despite being aware of the distracting effects of such engagement, drivers continue to interact with their mobile telephones whilst driving.
increased familiarity with the simulator may have further encouraged their engagement with the mobile phone task. The low ecological validity of the TQT task in our study may also explain the lack of engagement from this group of drivers in the mobile phone tasks. When asked to give reasons for engaging in a mobile phone task, drivers have quoted ‘catching up with colleagues/friends’, ‘checking voicemail’, ‘talking with significant other’, ‘discussing current events or sports’ and ‘wanting or needing to know something instantly’ as some of the motivators for engaging in mobile phone activities (Nelson, Atchley, Little, 2009). Therefore, further research with more naturalistic telephone conversations may yield a better correlation between observed and reported propensity to engage in mobile telephone tasks during driving. Additional research to examine the validity of the different types of phone activity undertaken by the two groups of sensation seekers is also warranted. As reading and writing text messages is perhaps not as noticeable in the vehicle as engaging with a hand-held telephone, low sensation seekers may be more inclined to engage in this activity. An
important issue for researchers and policy makers alike is an understanding of the motivation of drivers engaging in such activities, when they are clearly aware of their distracting and deleterious effects on driving safety.
REFERENCES
Arnett, J. (1994) Sensation seeking: a new conceptualization and a new scale. Personality and Individual Differences, 16, 289-296
Brusque, C. & Alauzet., A. (2008) Analysis of the individual factors affecting mobile phone use while driving in France: Socio-demographic characteristics, car and phone use in
professional and private contexts. Accident Analysis and Prevention, 40, 35-44
Burns, P., Parkes, A., Burton, S., Smith, R., Burch, D. (2002) How dangerous is driving with a mobile phone? Benchmarking the impairment to alcohol. TRL (Transport Research
Laboratory) report: TRL547. Woking, UK.
Dahlen, E.R., & White, R.P. (2006). The Big Five factors, sensation seeking, and driving anger in the prediction of unsafe driving. Personality and Individual Difference, 41 (5) 903– 915.
Department for Transport (2010). Mobile phone use by drivers: 2009 Survey results for England.
http://www.dft.gov.uk/adobepdf/162469/221412/221549/564852/mobileusedrivers.pdf
Gras, E., Cunill, M., Sullamn, M., Planes, M., Aymerich, M., Font-Mayolas, S. (2007) Mobile phone use while driving in a sample of Spanish university workers. Accident Analysis and Prevention, 39, 347-355
Jamson, S.L. (2013). What impact does legislation have on drivers’ in-vehicle use of nomadic devices? Transportation Research Part F, 16, 138-150.
Korpinen, L., & Pääkkönen, R. (2012) Accidents and close call situations connected to the use of mobile phones. Accident Analysis and Prevention, 45, 75-82.
Laberge-Nadeau, C., Maag, U., Bellavance, F., Lapairre, S., Desjardins, D., Messier, S., Saidi, A., (2003) Wireless telephones and the risk of road crashes. Accident Analysis and Prevention, 35, 649-660.
Lansdown, T. (2012) Individual differences and propensity to engage with in-vehicle distractions – A self-report survey. Transportation Research Part F, 15, pp. 1-8.
McEvoy, S., Stevenson, M., Woodward, M. (2006) Phone use and crashes while driving: a representative survey of drivers in two Australian states. The Medical Journal of Australia, 185, 630-634.
Merat, N., & Jamson, A.H. (2012). Highly automated driving, secondary task performance and driver state. Human Factors, 54: 762-771.
Nelson, E., Atchley, P., Little, T.D. (2009) The effects of perception of risk and importance of answering and initiating a cellular phone call while driving, Accident Analysis and Prevention, 41, 438–444.
Reason, J., Manstead, A., Stradling, S., Baxter, J., Campbell, K. (1990). Errors and violations on the roads: A real distinction? Ergonomics, 33, 1315–1332
Sullman, M.J. (2012). An observational study of driver distraction in England, Transportation Research Part F: Traffic Psychology and Behaviour, 15, 272–278.
Stutts, J., Hunter, W., Huang, H. (2003) Cell Phone Use While Driving: Results of a
Statewide Survey Transportation Research Board 2003 Annual Meeting CD-ROM. Available at: http://www.ltrc.lsu.edu/TRB_82/TRB2003-001872.pdf
Thulin, H., Gustafsson, S. (2004) Mobile Phone Use while Driving: Conclusions from four investigations. VTI rapport 490A (Swedish National Road and Transport Research Institute). Linkoping, Sweden. Available at: http://www.vti.se/sv/publikationer/pdf/anvandning-av-mobiltelefon-vid-bilkorning.pdf
Walsh, S., White, K., Hyde, M., Watson, B. (2008) Dialling and driving: Factors influencing intentions to use a mobile phone while driving. Accident Analysis and Prevention, 40, 1893-1900.
Young, K. & Lenné, M. (2010) Driver engagement in distracting activities and the strategies used to minimise risk. Safety Science, 48, 326-332