White Rose Research Online URL for this paper:
http://eprints.whiterose.ac.uk/136291/
Version: Published Version
Monograph:
Bojke, Chris orcid.org/0000-0003-2601-0314, Castelli, Adriana
orcid.org/0000-0002-2546-419X, Grasic, Katja et al. (2 more authors) (2013) NHS
productivity from 2004/5 to 2010/11. Working Paper. CHE Research Paper . Centre for
Health Economics, University of York , York, UK.
[email protected] https://eprints.whiterose.ac.uk/
Reuse
Items deposited in White Rose Research Online are protected by copyright, with all rights reserved unless indicated otherwise. They may be downloaded and/or printed for private study, or other acts as permitted by national copyright laws. The publisher or other rights holders may allow further reproduction and re-use of the full text version. This is indicated by the licence information on the White Rose Research Online record for the item.
Takedown
If you consider content in White Rose Research Online to be in breach of UK law, please notify us by
NHS Productivity from
2004/5 to 2010/11
NHS productivity from 2004/5 to 2010/11
Chris Bojke
Adriana Castelli
Katja Grasic
Andrew Street
Padraic Ward
Centre for Health Economics, University of York, UK
CHE Discussion Papers (DPs) began publication in 1983 as a means of making current research material more widely available to health economists and other potential users. So as to speed up the dissemination process, papers were originally published by CHE and distributed by post to a worldwide readership.
The CHE Research Paper series takes over that function and provides access to current research output via web-based publication, although hard copy will continue to be available (but subject to charge).
Acknowledgements
This paper is funded by the Department of Health. The views expressed are those of the authors and not necessarily those of the funder.
Disclaimer
Papers published in the CHE Research Paper (RP) series are intended as a contribution to current research. Work and ideas reported in RPs may not always represent the final position and as such may sometimes need to be treated as work in progress. The material and views expressed in RPs are solely those of the authors and should not be interpreted as representing the collective views of CHE research staff or their research funders.
Further copies
Copies of this paper are freely available to download from the CHE website www.york.ac.uk/che/publications/ Access to downloaded material is provided on the understanding that it is intended for personal use. Copies of downloaded papers may be distributed to third-parties subject to the proviso that the CHE publication source is properly acknowledged and that such distribution is not subject to any payment.
Printed copies are available on request at a charge of £5.00 per copy. Please contact the CHE
Publications Office, email [email protected], telephone 01904 321405 for further details.
Centre for Health Economics Alcuin College
University of York York, UK
www.york.ac.uk/che
Contents
Executive Summary ... ii
1. Introduction ... 1
2. Methods and data ... 2
2.1 Measuring output ... 2
2.2 Measuring input ... 4
2.3 Measuring productivity ... 7
3. Output growth ... 8
3.1 Hospital activity ... 8
3.2 Mental health and community care ... 10
3.3 Primary care ... 12
3.4 Other activities ... 14
3.5 Output growth ... 15
4. Input growth ... 16
4.1 Staff numbers ... 16
4.2 Input use derived from expenditure data ... 18
4.3 Input growth ... 23
5. Productivity growth ... 24
References ... 26
Appendix 1: Deflators ... 27
Appendix 2: Organisational expenditure ... 28
Executive Summary
Overview
2010/11 was the first full financial year of a Coalition government committed to meeting the
N £20bn efficiency savings in projected NHS expenditure by
2015. Securing improvements in NHS productivity is seen as a key element in meeting this challenge. In what follows we report year-on-year changes in productivity from 2004/5 to 2010/11.
Methods
Productivity change is measured by comparing year-on-year growth in output against growth in inputs. Output comprises the total volume of services provided to all NHS patients treated in
hospital, outpatient, accident & emergency, diagnostic, mental health, community, and primary care settings. The quality of care is measured by inpatient and outpatient waiting times, 30-day hospital survival rates, health outcomes and blood pressure control.
Inputs include the staff, equipment and capital resources that contribute to the production of care.
We also assess how sensitive estimates of productivity change are to the choice of data used to populate the output and input indices.
Output growth
Since 2004/5 the volume of NHS activity across almost all settings has increased year-on-year. The exception is in primary care where survey data suggest that the number of consultations in 2010/11 has fallen back to 2006/7 levels.
In terms of quality, 30-day survival rates have improved year-on-year since 2004/5 as has
management of blood pressure in primary care. Waiting times reached their lowest levels in 2008/9, since when they have been increasing.
Output growth increased by 27% between 2004/5 and 2010/11. Between 2009/10 and 2010/11, output growth amounted to 4.57%.
Input growth
There have been year-on-year increases in staffing levels, though these have flattened out recently. Growth in capital utilization peaked in 2007/8 and has been declining subsequently. There has been marked year-on-year growth in the use of intermediate inputs, such as drugs & gases, services & supplies, and energy.
Input growth increased by 18% between 2004/5 and 2010/11. Between 2009/10 and 2010/11, input growth amounted to 1.33%.
Productivity growth
Between 2004/5 and 2010/11 there has been an 8% increase in NHS productivity although year-on-year productivity growth tends to fluctuate around zero from positive to negative.
1.
Introduction
The productivity of the health care sector is measured by comparing the total amount of health care
E W
construct indices for both output and input growth in order to calculate productivity growth for the English National Health Service over pairs of years from 2004/5 to 2010/11.
Output consists of the volume of all health care services provided to NHS patients and also accounts for quality improvements.
The volume of NHS outputs across all health care settings is captured as
comprehensively as possible, using the Hospital Episode Statistics and Reference Cost database and other data sources;
The quality of NHS outputs is captured by inpatient and outpatient waiting times, 30-day
hospital survival rates, and improved blood pressure control in primary care.
Inputs include the staff, intermediate goods and services, and capital resources that contribute to the production of health care.
The volume of NHS labour is measured using data from the Electronic staff record
The volume of prescriptions is measured using data by chemical composition from the
Prescription Pricing Authority;
The volume of all other inputs are derived from expenditure data compiled from NHS
organisational accounts;
The output and input indices are consistent in how they account for services procured
from non-NHS bodies.
We explore alternative ways of populating the input index, which vary according to the data source used.
2.
Methods and data
Total factor productivity growth is calculated by dividing an index of output growth by an index of input growth:
TFP
I Z
1
(1)Where TFP is total factor productivity growth, Iis the index of output growth and Zis the index
of input growth. In order to estimate total factor productivity, it is therefore necessary to correctly define and measure the output and input indices.
2.1
Measuring output
Our index of NHS output growth captures all the activities undertaken for NHS patients. The datasets we use are comprehensive with the exception of consultations in primary care, for which we rely on nationally representative survey data.
Table 1 below summarises the data sources used to calculate the amount of activity undertaken and for cost weights for each activity type.
Table 1 Summary of output data sources
Output type Activity source Cost source Quality Notes
Elective HES RC 30-day survival; Health outcomes; Waiting times
Updated method to calculate CIPS
Non-elective HES RC 30-day survival; health outcomes
Updated method to calculate CIPS
Mental health HES & RC RC 30-day survival; Health outcomes; Waiting times
Updated method to calculate CIPS
Outpatient RC RC Waiting times Waiting times 2009/10 from DH Post-2009/10 from Outpatient Minimum Dataset
Community care RC RC N/A Other (1) RC RC N/A Primary care Pre-2009/10 from
QResearch Post-2009/10 for GP patient survey
PSSRU Unit Costs of Health and Social Care
QOF data QResearch discontinued so switch to GP Patient Survey
Prescribing Prescription cost analysis system
Prescription cost analysis system
N/A
Ophthalmic and dental services
IC N/A
NHS Direct and NHS Choices
DH N/A Activity not included in baseline estimates
Notes HES: hospital episode statistics; RC: Reference costs; CIPS: Continuous Inpatient Spells; PSSRU Personal & Social Services Research Unit; IC NHS Information Centre; DH Department of Health (1) A&E, Radiotherapy & High Cost Drugs, Diagnostic Tests, Hospital/patient Transport Scheme, Radiology, Rehabilitation, Renal Dialysis, Specialist Services
The Hospital Episode Statistics (HES) is the source of data for both the amount of activity and for the
measures of the quality of elective, non-elective and mental health care delivered in hospitals.1 HES
comprise over 18.5 million patient records for 2010/11. We convert HES records into Continuous
1
Inpatient Spells (CIPS) and then count the number of patients (ie CIPS) in each Healthcare Resource Group (HRG), which form the basic means of describing different types of hospital output. The cost of each CIPS is calculated on the basis of the most expensive FCE within the CIPS, with costs for each HRG derived from the Reference Cost data. We then calculate the national average cost per patient in each HRG.
The HES records include waiting times and can be linked to ONS death registry records. This allows us to calculate waiting times and 30-day survival which are used to assess the quality of hospital care.
An official algorithm for calculating CIPS has recently been published by the NHS Information Centre2
and we have now adopted this, replacing the procedure that we had adapted from Lakhani et al (Lakhani et al., 2005, Castelli et al., 2008). The main difference between the algorithms is in how emergency readmissions are attributed to CIPS, and this has greatest impact on the amount of non-elective activity that is counted. To ensure like-with-like comparisons, output growth up to and including 2008/9-2009/10 is based on our previous algorithm while the growth rate for 2009/10-2010/11 is based on the new method.
The Reference Cost returns (RC) are used to capture activity in all settings except hospitals and primary care, as well as for the costs weights for these activities. The Reference Costs capture data about activities conducted in mental health and community care settings, outpatient and accident and emergency departments, and diagnostic facilities. These activity data are reported in various ways, including attendances, contacts, bed days, and number of tests. We use costs to weight these diverse activities in order to convert them into a common metric that permits aggregation.
There have been concerns about the accuracy of the reference cost data. In order to identify data error we have implemented a systematic procedure that allows us to identify substantial changes between adjacent years. For some types of Reference Costs categories there are implausibly large changes in volumes or costs from one year to the next. In Table 2 we have listed the reference costs which represent the biggest absolute cost difference between the years 2009/10 and 2010/11. These are included in the output index but these are weighted by the lowest reported cost across the two years.
Table 2: Candidate reference cost categories for omission from output index
2010/11 2009/10
Setting Activity Code Service Code Activity Cost Activity Cost Cost difference
Outpatient clfunff TCMDT_C 1 £22,723 1 £201,975 £179,252
Outpatient clfunff TCMDT_SpU 1 £9,184 1 £130,907 £121,723
Outpatient opproc MA17C 1035 £37,903 874 £347 £37,556
Other rdna HB15G 4 £653 1 £20,511 £19,858
Other rdna FZ21Z 1 £304 2 £14,914 £14,609
Other rdna CZ17V 1 £8,115 1 £182 £7,933
Chemo/Radiotherapy & High Cost Drugs
rdthyother SC26Z 505 £1,246 17 £7,364 £6,118
In the past, outpatient waiting times were based on data published on the Department of Health (DH) performance website, but these no longer appear. Instead, we calculate waiting times for first
2
attendances using the outpatient minimum dataset3. These waiting times are somewhat higher than those reported previously, but the year-on-year trends are virtually identical. Consequently, the move to the new data series will not have an impact on the estimates of output growth. To ensure consistent comparisons, growth rates up to and including 2008/9-2009/10 are based on the previous data. The growth rate for 2009/10-2010/11 is based on the data constructed from the outpatient minimum data.
Comprehensive data on the activities performed in primary care settings remain unavailable. In their
absence, nationally representative survey data have been used instead4. For the period
2004/05-2008/09 the volume of GP consultations was obtained from QResearch (QResearch, 2009, Fenty et al., 2006). This survey has since been discontinued, and the GLS (General Lifestyle Survey) no longer includes a question about visits to the doctor. Instead we have used the data from the annual GP
Patient Survey5, using the percentage of patients answering "in the past 3 months" to the question
"When did you last see a doctor at your GP surgery or health centre?" We used these percentages to estimate the volume of consultations in the current period, taking the 2008/9 volumes as the baseline. The Patient Survey does not provide a breakdown by type of consultation so we have assumed that the mix of consultations observed by QResearch in 2008/9 remained the same in 2010/11, these types being GP home visits, GP telephone consultations, GP surgery consultations, GP other consultations, Practice Nurse consultations and other consultations.
U P““‘U U C H “
Care.6 Data about the quality of primary care activity are obtained from the Quality and Outcomes
Framework (QOF), which reports disease prevalence and achievement in reducing blood pressure for patients with coronary heart disease, transient ischaemic attacks or stroke and hypertension (The Information Centre for Health and Social Care, 2011).
Data about community prescribing are taken from the Prescription Cost Analysis (PCA) system, supplied by the Prescription Pricing Authority. The data are based on a full analysis of all prescriptions dispensed in the community, summarised into more than 8,000 categories defined according to chemical composition.
2.2
Measuring input
Inputs into the health care system consist of:
Labour, such as doctors, nurses, technicians and managers;
Intermediate goods and services, such as drugs and clinical supplies;
Capital, such as buildings and equipment with an asset life of more than a year
We construct a comprehensive index of input growth, using the workforce data and financial returns made by all NHS organisations to quantify the amount of all inputs used in the production of care provided to NHS patients. These data sources are summarised in Table 3.
3
http://www.hesonline.nhs.uk/Ease/servlet/ContentServer?siteID=1937&categoryID=890 4
We expect to obtain more exact data from April 2014 onwards, once the General Practice Extraction Service (GPES) is implemented.
5
http://www.gp-patient.co.uk/results/download/y5q4/y5q4_Summary.pdf. 6
http://www.pssru.ac.uk/project-pages/unit-costs/2011/index.php Table 10.8b for GP costs; Table 10.6 for Nurse
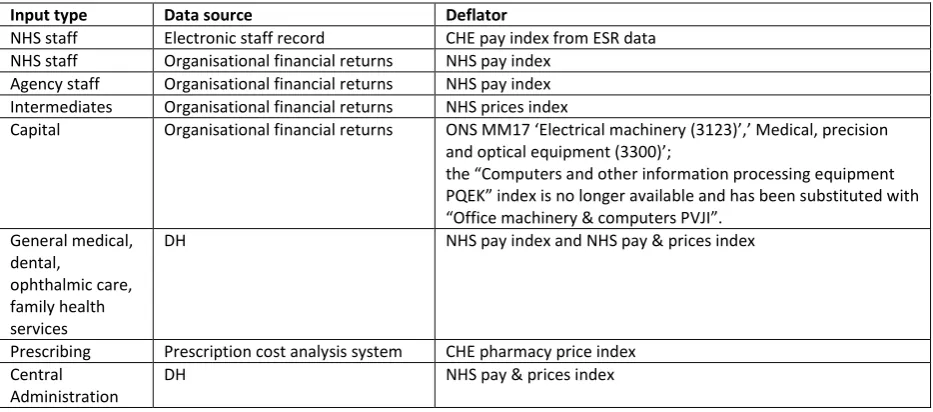
Table 3 Summary of input data sources
Input type Data source Deflator
NHS staff Electronic staff record CHE pay index from ESR data NHS staff Organisational financial returns NHS pay index
Agency staff Organisational financial returns NHS pay index Intermediates Organisational financial returns NHS prices index
Capital Organisational financial returns ON“ MM E M
C
PQEK no longer available and has been substituted with
O PVJI
General medical, dental,
ophthalmic care, family health services
DH NHS pay index and NHS pay & prices index
Prescribing Prescription cost analysis system CHE pharmacy price index Central
Administration
DH NHS pay & prices index
NHS staff data
Workforce and earnings data are obtained from the NHS iView database (https://iview.ic.nhs.uk/ )
which draws data directly from the Electronic Staff Records (ESR), and combined payroll and Human Resources system for the NHS. The data contain numbers of full time equivalent (FTEs) staff and earnings by 480 different occupational groups for all staff employed in the NHS.
These data do not capture agency staff, self-employed GPs and practice staff. We account for agency staff and GPs using expenditure data. For reporting purposes only, we use the data on the GPs and GP practice staff from the Workforce census.
We use the national average earnings for each occupational group to construct a pay index by which to aggregate the total number of FTEs across occupational groups into a measure of total NHS labour input (see Appendix 1).
Expenditure data
We analyse financial data for all NHS organisations to construct our index of input use:
Labour: the financial returns detail expenditure on both NHS and agency staff by broad
categories of labour input.
Intermediate inputs: include drugs and gases used in hospital, clinical supplies, catering,
hotel services, uniforms, laundry, bedding, energy, establishment and premises costs. We use price deflators to wash out price changes in order to assess the amount of each type of input used.
Capital: we account for depreciation on assets and for current outlays on equipment,
making assumptions according to the asset in question about what proportion is employed in the current period.
Expenditure on non-NHS bodies
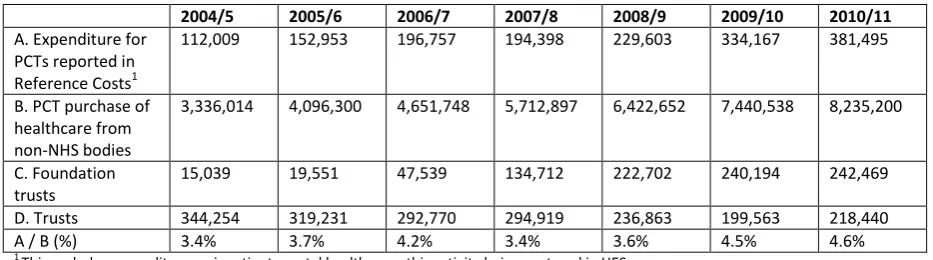
[image:13.595.65.532.236.366.2]The financial returns for all NHS organisations include purchases of health care from non-NHS bodies. This category accounts for the largest share of expenditure by Primary Care Trusts, capturing care purchased from the voluntary sector, charitable institutions and local authorities for older people and those with mental or physical disabilities, and acute care for NHS patients purchased from the private sector (Zerdevas, 2009, Bojke et al., 2012). Many of these services are not captured in the Reference Costs, particularly those that are social care rather than health care services. In recognition of this, our baseline estimates of productivity growth are based on activity (output) and expenditure (input) reported in the Reference Costs. As a sensitivity analysis, the expenditure reported by PCTs is used in the input series.
Table 4 Current expenditure on services from non-NHS providers (pounds 000s)
2004/5 2005/6 2006/7 2007/8 2008/9 2009/10 2010/11
A. Expenditure for PCTs reported in Reference Costs1
112,009 152,953 196,757 194,398 229,603 334,167 381,495
B. PCT purchase of healthcare from non-NHS bodies
3,336,014 4,096,300 4,651,748 5,712,897 6,422,652 7,440,538 8,235,200
C. Foundation trusts
15,039 19,551 47,539 134,712 222,702 240,194 242,469
D. Trusts 344,254 319,231 292,770 294,919 236,863 199,563 218,440 A / B (%) 3.4% 3.7% 4.2% 3.4% 3.6% 4.5% 4.6% 1
[image:13.595.75.443.532.752.2]This excludes expenditure on inpatient mental health care, this activity being captured in HES
Table 4 reports the total value of services from non-NHS providers that are included in the Reference Costs collection and the total value of purchases made by PCTs, Trusts and Foundations Trusts as reported in their financial returns. Many trusts became Foundation Trusts in recent years; therefore the reported expenditure has risen sharply in the Foundation Trusts and has fallen in the case of Trusts. Looking at PCTs, both the A and B expenditure series have increased rapidly over time, with (current) expenditure in 2010/11 almost 3.5 times that in 2004/5. From the Figure 1 we can see that the former series has risen more erratically than the latter. The fraction of PCT purchases from non-NHS bodies that are captured in the Reference Cost collection has been growing over the years, however it is still very small (4.6%). This means that the vast majority of services procured from non-NHS bodies are not captured in the output index.
Figure 1: Growth in expenditure on non-NHS bodies (base=2004/5)
0 50 100 150 200 250 300 350 400
2004/5 2005/6 2006/7 2007/8 2008/9 2009/10 2010/11
A. Expenditure reported in Reference Costs
2.3
Measuring productivity
We report estimates for four different formulations of the productivity index. Our MIXED indices of productivity growth measure growth in NHS labour inputs using information recorded in Electronic Staff Records; and organisational expenditure data for non-NHS staff, all intermediates (other than community prescription items), and for capital. Two forms of this index are presented, depending on how expenditure on services procured from non-NHS bodies is dealt with.
3.
Output growth
3.1
Hospital activity
Summarised data on the amounts of elective, non-elective and outpatient activity are reported in Table 5, together with information about mean costs, 30-day survival rates, and waiting times.
Table 5: Hospital output Data
Source
NHS Activity Year
2004/05 2005/06 2006/07 2007/08 2008/09 2009/10 2009/10(a) 2010/11(a)
H o sp it a l e p is o d e s ta ti st ic s (H E S ) Hospital output Elective and day cases Volume of
activity 6,433,933 6,864,612 7,194,697 7,598,796 8,148,229 8,474,088 8,465,757 8,755,081 Average cost 1,031 1,041 1,036 1,090 1,092 1,154 1,087 1,106 30-day
survival rate 99.38% 99.47% 99.51% 99.72% 99.74% 99.76% 99.76% 99.78% Mean age 53.6 53.9 54.4 54.6 55 55.3 55.3 55.7 Mean life
expectancy 23.7 23.7 23.6 23.5 23.2 23.4 23.4 23.4 80th
percentile
waiting times 104 95 89 74 60 65 65 76 Mean
waiting times 71 67 65 57 51 57 57 62
Non-electives Volume of
activity 6,009,802 6,291,117 6,363,388 6,593,136 6,826,035 7,151,256 6,951,379 7,109,358 Average cost 1210 1,241 1,244 1,237 1,295 1,352 1,355 1,397 30-day
survival rate 95.16% 95.49% 95.65% 95.79% 95.85% 96.05% 96.07% 96.05% Mean age 41.6 41.6 41.6 41.4 41.9 42.3 42.1 42.2 Mean life
expectancy 34.1 34.3 34.6 34.7 34.4 34.4 34.6 34.8
R e f co st s Outpatient Volume of
activity 52,724,302 60,541,477 63,453,507 69,678,564 74,421,017 76,761,100 81,263,904 Average cost 106 103 93 94 98 99 105 Mean
waiting times(weeks)
7.4 6.5 5.9 3.4 3.1 3.4
5.3 (b) 4.8 (b) 5.1 (b) 5.3 (b)
Figure 2 illustrates the consistent upward trend in elective and non-elective activity (2004/5=100). Growth in elective activity has been particularly strong, increasing by 36% from 2004/05 to 2010/11. Non-elective activity has increased by 18% over the same period.
Figure 2 Trends in hospital activity
The broken series are due to the change in the CIPS algorithm that was introduced in 2009/10. As can be seen the revision has an impact on the number of CIPS recorded, particularly for non-electives. Between 2009/10 and 2010/11, the number of elective patients increased from 8.5m to 8.8m and non-elective activity increased from 7.0m to 7.1m. There has been a 28.3% growth in first outpatient attendances over the full period, from 52.7m in 2004/5 to 81m in 2010/11.
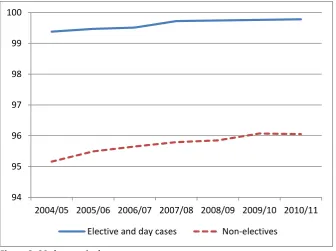
[image:16.595.72.409.445.696.2]Along with the upward trend in activity, 30-day survival rates has also improved year-on-year, as indicated in Figure 3. For elective patients, the 30-day survival rate was 99.78% in 2010/11, up from 99.38% in 2004/5. The rate for non-elective patients was 96.05% in 2010/11 compared to 95.16% in 2004/5.
Figure 3: 30-day survival rates
Trends in inpatient and outpatient waiting times are depicted in Figure 4. Waiting times declined year-on-year from 2004/5 to 2008/9. But, as can be seen, inpatient waiting times (measured at the
80 100 120 140
160 Elective and
day cases Elective and day cases -new method Non-electives
Non electives -new method
94 95 96 97 98 99 100
2004/05 2005/06 2006/07 2007/08 2008/09 2009/10 2010/11
80th percentile) increased from their lowest level of 60 days in 2008/9 to 76 days in 2010/11. The
trend in mean waiting times matches that for the 80th percentile (see Table 5).
Outpatient waiting times also fell year-on-year between 2004/5 and 2008/9, before starting to increase in 2009/10. Reporting of these data was then discontinued. But waiting times calculated
from the outpatient data set exhibit t
[image:17.595.72.384.187.389.2]which the two series overlap. The waiting time for a first outpatient attendance in 2010/11 was 5.3 weeks, compared to 4.8 weeks in 2008/9.
Figure 4: Trends in waiting times
3.2
Mental health and community care
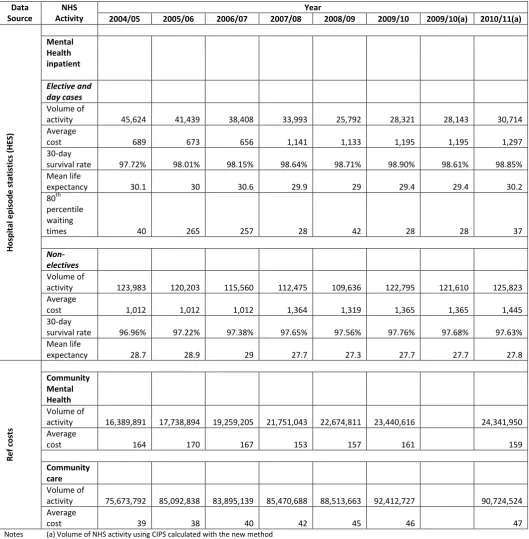
A summary of mental health and community care activity is reported in Table 6. This shows gradual reductions in the amount of elective mental health care activity being undertaken in hospital settings, while non-elective activity has been fairly constant over time, despite some year-on-year volatility. In contrast there has been a steady increase in the amount of mental health care delivered in community settings, the number of contacts increasing from 16m in 2004/5 to 24m in 2010/11. The provision of other forms of community care has also increased over time, rising from 75m contacts in 2004/5 to almost 91m in 2010/11. These trends are depicted in Figure 5.
0 10 20 30 40 50 60 70 80
2004/05 2005/06 2006/07 2007/08 2008/09 2009/10 2010/11
Elective and day cases Outpatient
Table 6: Output in mental health and community care Data Source NHS Activity Year
2004/05 2005/06 2006/07 2007/08 2008/09 2009/10 2009/10(a) 2010/11(a)
H o sp it a l e p is o d e s ta ti st ic s (H E S ) Mental Health inpatient Elective and day cases Volume of
activity 45,624 41,439 38,408 33,993 25,792 28,321 28,143 30,714 Average
cost 689 673 656 1,141 1,133 1,195 1,195 1,297 30-day
survival rate 97.72% 98.01% 98.15% 98.64% 98.71% 98.90% 98.61% 98.85% Mean life
expectancy 30.1 30 30.6 29.9 29 29.4 29.4 30.2 80th
percentile waiting
times 40 265 257 28 42 28 28 37
Non-electives Volume of
activity 123,983 120,203 115,560 112,475 109,636 122,795 121,610 125,823 Average
cost 1,012 1,012 1,012 1,364 1,319 1,365 1,365 1,445 30-day
survival rate 96.96% 97.22% 97.38% 97.65% 97.56% 97.76% 97.68% 97.63% Mean life
expectancy 28.7 28.9 29 27.7 27.3 27.7 27.7 27.8
R e f co st s Community Mental Health Volume of
activity 16,389,891 17,738,894 19,259,205 21,751,043 22,674,811 23,440,616 24,341,950 Average
cost 164 170 167 153 157 161 159
Community care
Volume of
activity 75,673,792 85,092,838 83,895,139 85,470,688 88,513,663 92,412,727 90,724,524 Average
cost 39 38 40 42 45 46 47
Figure 5 Trends in mental health and community care (* There was change in calculating CIPS in year 2009/10)
3.3
Primary care
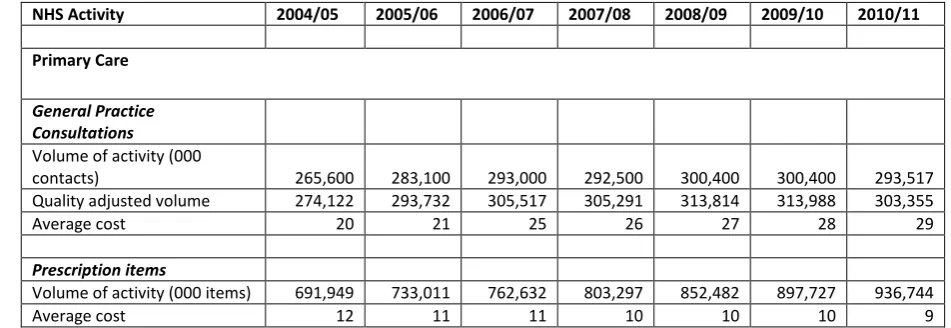
[image:19.595.56.532.437.601.2]We have two broad measures of activity in primary care: the number of consultations and the number of prescription items dispensed. Data for both of these measures is summarised in Table 7. The number of prescription items has been gradually increasing from 2004/05, amounting to 937m items in 2010/11.
Table 7: Output in primary care
NHS Activity 2004/05 2005/06 2006/07 2007/08 2008/09 2009/10 2010/11
Primary Care
General Practice Consultations
Volume of activity (000
contacts) 265,600 283,100 293,000 292,500 300,400 300,400 293,517 Quality adjusted volume 274,122 293,732 305,517 305,291 313,814 313,988 303,355 Average cost 20 21 25 26 27 28 29
Prescription items
Volume of activity (000 items) 691,949 733,011 762,632 803,297 852,482 897,727 936,744 Average cost 12 11 11 10 10 10 9
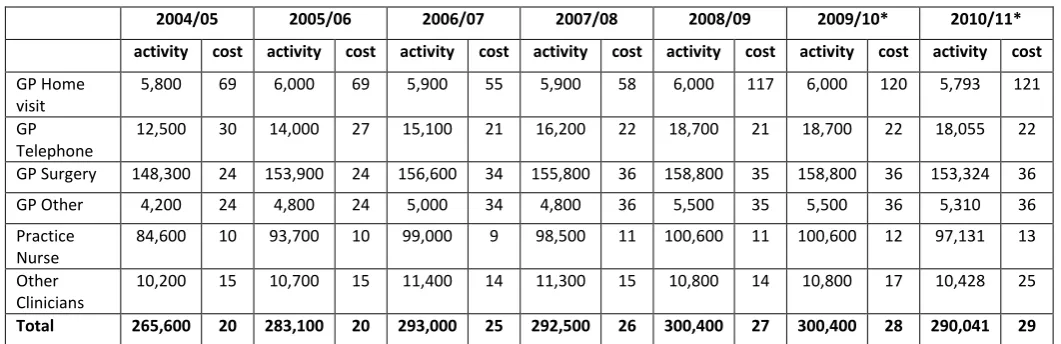
Data about the number and cost of consultations are reported in Table 8, broken down by consultation type. From 2004/5 to 2008/9, the activity data were derived from QResearch. With these data being discontinued, data from 2009/10 are derived from the GP Patient Survey. The QResearch data suggest year-on-year increases in primary care consultations from 2004/5 to 2008/9. The GP Patient Survey suggests that consultation rates were unchanged between 2008/9
and 2009/107
visited their GP in the previous 3 months, compared to 58% in the 2009/10 survey.
7
As do data from the General Lifestyle Survey
0 20 40 60 80 100 120 140 160
Mental Health Elective
Mental Health Non-Elective
Community Mental Health
Table 8 Consultations by type
2004/05 2005/06 2006/07 2007/08 2008/09 2009/10* 2010/11*
activity cost activity cost activity cost activity cost activity cost activity cost activity cost
GP Home visit
5,800 69 6,000 69 5,900 55 5,900 58 6,000 117 6,000 120 5,793 121
GP Telephone
12,500 30 14,000 27 15,100 21 16,200 22 18,700 21 18,700 22 18,055 22
GP Surgery 148,300 24 153,900 24 156,600 34 155,800 36 158,800 35 158,800 36 153,324 36 GP Other 4,200 24 4,800 24 5,000 34 4,800 36 5,500 35 5,500 36 5,310 36 Practice
Nurse
84,600 10 93,700 10 99,000 9 98,500 11 100,600 11 100,600 12 97,131 13
Other Clinicians
10,200 15 10,700 15 11,400 14 11,300 15 10,800 14 10,800 17 10,428 25
Total 265,600 20 283,100 20 293,000 25 292,500 26 300,400 27 300,400 28 290,041 29
* The data for 2009/10 and 2010/11 are calculated from the GP Patient Survey. Proportion of patients who visited their GP in the last 3 months is 58%, 58% and 53% for the years 2008/09, 2009/10, 2010/11 respectively.
Figure 6: Trends in growth in primary care
Table 9 reports the trends in prevalence and achievement in reducing blood pressure for patients with CHD, stroke and hypertension. Achievement rates have increased year-on-year. We account for these improvements in measuring primary care output, as specified by Derbyshire et al (Derbyshire et al., 2007). Allowance for quality suggests that primary care output increased 9.2% between 2004/5 to 2010/11.
Table 9 Rates of prevalence and achievement in reducing blood pressure
Prevalence QOF achievement
CHD Stroke Hypertension CHD Stroke Hypertension
2004/05 3.57 1.63 10.41 78.60 73.13 64.33
2005/06 3.57 1.66 11.48 84.44 81.22 71.05
2006/07 3.54 1.61 12.49 88.86 86.92 77.62
2007/08 3.50 1.63 12.79 89.41 87.51 78.35
2008/09 3.47 1.66 13.13 89.68 87.88 78.56
2009/10 3.44 1.68 13.35 89.77 88.12 78.72
2010/11 3.40 1.71 13.52 90.16 88.57 79.30
80.00 90.00 100.00 110.00 120.00 130.00 140.00
Prescription Items Consultations
3.4
Other activities
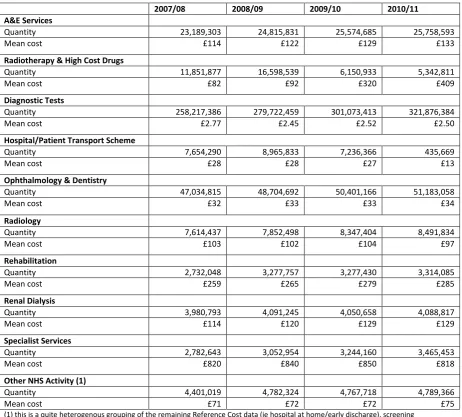
Other types of activity reported in the Reference Costs are summarised in Table 10. The ways of classifying these activities has changed somewhat over time, so only data from 2007/8 are reported. Details for previous years are provided in a previous report (Castelli et al., 2008). For all but two of these broad groups of activity there have been year-on-year increases in volumes.
One of the exceptions is Radiotherapy & High Cost Drugs, for which there has a reclassification of how these services are described. This has resulted in lower amounts of activity being recorded, but these activities are now of higher cost.
[image:21.595.68.531.320.737.2]In 2010/11, there was a marked reduction in the Hospital/Patient transport scheme, from 7m to 435k journeys. The reduction stems from concerns raised about the quality of these data, and work is being carried out to improve the data collection methodology (Department of Health, 2010). In the meantime, by and large the data have been excluded from Reference Costs in order to reduce the data collection burden. We have performed a sensitivity analysis to assess the implications inclusion/exclusion has on estimates of output growth.
Table 10 Other types of activity
2007/08 2008/09 2009/10 2010/11
A&E Services
Quantity 23,189,303 24,815,831 25,574,685 25,758,593
Mean cost £114 £122 £129 £133
Radiotherapy & High Cost Drugs
Quantity 11,851,877 16,598,539 6,150,933 5,342,811
Mean cost £82 £92 £320 £409
Diagnostic Tests
Quantity 258,217,386 279,722,459 301,073,413 321,876,384
Mean cost £2.77 £2.45 £2.52 £2.50
Hospital/Patient Transport Scheme
Quantity 7,654,290 8,965,833 7,236,366 435,669
Mean cost £28 £28 £27 £13
Ophthalmology & Dentistry
Quantity 47,034,815 48,704,692 50,401,166 51,183,058
Mean cost £32 £33 £33 £34
Radiology
Quantity 7,614,437 7,852,498 8,347,404 8,491,834
Mean cost £103 £102 £104 £97
Rehabilitation
Quantity 2,732,048 3,277,757 3,277,430 3,314,085
Mean cost £259 £265 £279 £285
Renal Dialysis
Quantity 3,980,793 4,091,245 4,050,658 4,088,817
Mean cost £114 £120 £129 £129
Specialist Services
Quantity 2,782,643 3,052,954 3,244,160 3,465,453
Mean cost £820 £840 £850 £818
Other NHS Activity (1)
Quantity 4,401,019 4,782,324 4,767,718 4,789,366
Mean cost £71 £72 £72 £75
3.5
Output growth
[image:22.595.66.346.172.301.2]Output growth is measured by combining activities of different types into a single index using costs to reflect their values. This generates our cost-weighted output growth index. We then re-scale each type of cost-weighted output according to changes in survival rates, health improvements and waiting times. This generates our quality-adjusted index.
Table 11: Output growth
Output growth All NHS
Cost-weighted growth Quality adjusted CW growth
2004/5-5/6 6.53% 7.11% 2005/6-6/7 5.88% 6.50% 2006/7-7/8 3.41% 3.66% 2007/8-8/9 5.34% 5.73% 2008/9-9/10 3.44% 4.11% 2009/10-10/11 3.61% 4.57%
Growth including hospital/patient transport scheme
2009/10-10/11 3.31% 4.27%
4.
Input growth
4.1
Staff numbers
Summarised from 480 staff categories in ESR data, Table 12 reports NHS staff numbers (as Full Time Equivalents) aggregated in major staff groups for each year from 2004/5, while Figure 7 and Figure 8 present the information graphically. For years prior to 2007/08, we use the data from Workforce Census, 2007/08 being an overlapping year. Data for GPs and practice staff are always taken from the Workforce Census but, as noted earlier, these are not used in the construction of the input series because these are accounted for in the primary care expenditure data (see Figure 16) and are reported here merely for information.
[image:23.595.38.572.308.686.2]The data show gradual growth over time in most staffing groups. The exception is for practice staff, numbers of which peaked in 2006/7. In 2010/11, the NHS employed 1.16m FTEs, up from 1.04m in 2004/5, an increase of some 10.9% over the seven years. Annual growth in FTEs has been uneven, with an increase of 1.5% between 2009/10 and 2010/11.
Table 12 Full time equivalent NHS staff numbers
2004/5 2005/6 2006/7 2007/8
(a) 2007/8 2008/9 2009/10 2010/11
Medical staff 78,462 82,568 85,975 84,226 82,790 88,647 91,604 95,077 GPs* 31,021 31,901 33,384 33,384 33,384 33,730 34,043 36,085 GPs Practice staff* 72,006 72,990 76,977 75,085 75,085 73,292 72,153 73,306 Ambulance staff 21,149 23,084 24,489 25,056 Administration and Estates staff 237,264 243,018 262,479 263,723 Health care assistants and other
support staff 101,114 106,406 112,710 114,786 Nursing, midwifery and health
visiting staff 363,344 369,509 377,308 377,938 Nursing, midwifery and health
visiting learners 3,176 2,623 2,533 2,644 Scientific, therapeutic and
technical staff 104,866 111,321 118,935 123,875 Healthcare scientists 36,888 38,735 40,603 41,539
Unknown 1,056 555 428 56
Non-funded staff 3,273 3,046 3,038 3,299 Professionally qualified clinical
staff 412,013 425,044 425,983 425,983 Support to clinical staff 271,347 278,994 273,202 273,202 NHS infrastructure support staff 178,530 186,510 178,230 178,230
TOTAL 1,043,379 1,078,007 1,073,751 1,070,110 1,063,389 1,093,966 1,140,323 1,157,384
Annual Growth FTE 3.32% -0.39% -0.34% -0.63% 2.88% 4.24% 1.50% Labour Index 3.44% 0.64% N/A 0.64% 4.22% 4.55% 1.29%
Figure 7: Trends in growth of medical and dental staff and GPs
Figure 8 Growth in nursing staff, practice staff and support staff (*for the years from 2007/08 onwards, categories from ESR were mapped to the staff categories in the Workforce Census data)
The final row of Table 12 reports the growth in the volume of labour, which takes account of both the number of FTEs and the wage rate for each occupational group. Over time there may be changes in the staffing mix, and a simple count of the numbers employed fails to capture changes in the composition of staffing. The index of labour input growth overcomes this by weighting the number of staff of each type by their respective wages. For the entire period, the index of labour input growth is always greater than the growth in FTEs. This implies that there has been a progressive shift of staff toward higher wage categories. Accordingly, NHS labour input increased by 15.7% between 2004/5 and 2010/11. The growth in labour input between 2009/10 and 2010/11 amounted to 1.29%.
20,000 40,000 60,000 80,000 100,000 120,000
Medical & Dental GPs
50,000 100,000 150,000 200,000 250,000 300,000 350,000 400,000 450,000 500,000
Professionally qualified clinical staff Support to clinical staff
4.2
Input use derived from expenditure data
A summary of current expenditure appears in the top half of Table 13, followed by expenditure in constant terms, growth in which is interpreted as growth in input use. The difference between the
two sets of figures is due to the deflators8 used to wash out price effects and, for capital, to the
[image:25.595.63.535.185.643.2]apportionment of current expenditure over the asset life. A detailed breakdown of current expenditure for Trusts, PCTs and SHAs is provided in Appendix 2.
Table 13 Current and constant expenditure (£000)
2004/5 2005/6 2006/7 2007/8 2008/9 2009/10 2010/11
Current expenditure NHS staff 31,334,252 33,926,746 35,177,509 36,539,984 39,213,454 42,145,100 43,513,839 Agency staff 1,557,282 1,459,936 1,185,244 1,354,520 1,895,452 2,195,295 2,127,889 Intermediates (RC) 8,757,990 10,271,344 11,378,727 13,036,200 13,991,803 14,911,074 16,077,609 Capital 5,115,514 5,839,664 6,568,363 7,784,592 7,426,031 7,635,390 8,025,361 Prescribing 8,094,175 8,013,483 8,250,324 8,303,501 8,376,264 8,621,421 8,880,735 Primary Care 9,569,836 11,162,141 11,209,422 11,697,639 12,074,672 12,683,418 12,962,081 DH Administration 278,000 262,000 229,000 226,000 242,958 241,608 212,245 Total 64,707,050 70,935,314 73,998,589 78,942,436 83,220,634 88,433,307 91,799,759 Constant expenditure NHS staff 38,212,088 39,516,362 39,359,457 39,525,586 41,200,614 43,406,879 43,513,839 Agency staff 1,669,078 1,440,740 1,089,513 1,305,572 1,988,902 2,373,791 2,127,889 Intermediates (RC) 8,908,327 10,650,038 11,640,863 13,367,265 14,140,508 15,427,877 16,077,604 Capital 3,308,036 3,578,676 4,190,683 4,292,293 3,994,568 3,958,031 3,893,374 Prescribing 5,931,102 6,514,497 6,944,133 7,454,440 7,927,564 8,477,307 8,880,735 Primary Care 11,670,405 13,001,164 12,542,013 12,645,671 12,673,068 13,076,604 12,962,081 DH Administration 331,183 300,986 253,689 243,310 251,748 248,856 212,245 Total 70,030,219 75,002,464 76,020,350 78,834,137 82,176,973 86,969,345 87,667,768
To derive estimates of volume growth in input use from the expenditure data, it is necessary to wash out price changes from the expenditure series. By applying a price deflator, current expenditure is converted into constant expenditure. Changes in constant expenditure are driven by changes in the volume not the price of inputs. In Figure 9 the components of this calculation are illustrated for NHS staff. The expenditure series shows that expenditure in current terms has increased considerably over time, from £31bn in 2004/5 to £43.5bn in 2010/11, an increase of 12.5%. But wages have been increasing as well, indicated by the rising NHS pay index. Once these wage increases have been
8
taken into account, the volume of labour input can be calculated as the change in constant expenditure from £38bn in 2004/5 to £43.5bn in 2010/11, an increase of 13.9%. As the graph shows, volume growth has been less pronounced than wage growth over time.
Figure 9 Trends in expenditure, prices and volume of NHS labour
As shown in Figure 10 NH“ L-input
T
by crude growth in FTEs (11.4%) and in labour input calculated from the ESR data (15.7%). The two labour input series track each other closely but, nevertheless, we produce estimates of overall input and productivity growth using the alternative measures of growth in labour inputs.
Figure 10 Comparative trends in NHS staff growth
There have been marked annual changes in the use of agency staff, as Figure 11 indicates. This graph reports the changes in expenditure, prices and volume over time. Price changes are derived from the NHS pay index. The expenditure and volume series are closely related. As can be seen reduced use
80 90 100 110 120 130 140 150
Expenditure Volume Pay
90 95 100 105 110 115 120
2004/5 2005/6 2006/7 2007/8 2008/9 2009/10 2010/11
FTEs
[image:26.595.74.436.453.682.2]was made of agency staff from 2004/5 to 2006/7, followed by three years of increased use. There was a decline in the use of staff between 2009/10 and 2010/11.
Figure 11 Trends in expenditure, prices and volume of agency staff
The trends in expenditure and volume of intermediate input growth track each other almost exactly. At first sight this might seem contrary to expectations, but the reason is due to changes in price. The prices of most intermediate inputs have been rising, as captured by the NHS prices index. But drugs & gases account for around 25% of intermediate inputs, the price of which have been falling steeply over time. The opposite direction of these price changes appear to offset each other.
Figure 12 Trends in expenditure and volumes of intermediate inputs
Trends in expenditure on and use of capital are depicted in Figure 13, indicating growth up to around 2007/8, with decreased utilisation thereafter. The recent divergence between the expenditure and volume series is due to recent increases in the price of capital as reported in the ONS series that we use.
0 20 40 60 80 100 120 140 160
Expenditure Volume Pay
0 20 40 60 80 100 120 140 160 180 200
[image:27.595.73.411.436.637.2]Figure 13 Trends in expenditure and volumes of capital inputs
The trends in use of labour, intermediate and capital resources, as derived from the organisational financial returns, are shown in Figure 14. Since 2004/5, labour input has increased by 14% and capital inputs by 18%. But the use of intermediate inputs has increased considerably, by some 80%.
Figure 14 Use of labour, intermediate and capital resources
Trends in the expenditure and volume of community pharmaceuticals are shown in Figure 15. Note that, because prices have been falling over time, the rise in the volume of pharmaceuticals (50%) exceeds the increase in expenditure (10%).
80 90 100 110 120 130 140 150 160 170
Expenditure Volume
80 100 120 140 160 180 200
[image:28.595.74.435.372.587.2]Figure 15 Trends in expenditure, prices and volumes for pharmaceuticals
Trends in the expenditure and volume of primary care inputs are shown in Figure 16. Apart from a large increase in 2004/05-2005/06, the series has been generally flat. As such the observed increases in overall expenditure are due more to price increases rather than increases in the underlying resource utilisation.
Figure 16: Trends in expenditure and volume in primary care
0 20 40 60 80 100 120 140 160
Expenditure Volume Drug prices
80 90 100 110 120 130 140
[image:29.595.74.435.385.601.2]4.3
Input growth
Our measures of input growth are reported in Table 14, differentiated according to the use of the Mixed or Indirect index and to what data source is used to account for expenditure on services procured from non-NHS bodies. The following are of note:
Estimates of input growth are generally higher if using the Mixed rather than the Indirect input index. This is because the growth rate in labour input is generally higher if based on data from the Electronic Staff Record than if based on expenditure data deflated by the NHS pay index.
Input growth is always lower if expenditure on non-NHS bodies accords with that reported in the Reference Costs rather than that reported in the financial returns.
Table 14 Input growth
Input Growth All NHS
Mixed Mixed Indirect Indirect
Non-NHS spend from RC
Non-NHS spend from TFRs
Non-NHS spend from RC
Non-NHS spend from TFRs
5.
Productivity growth
Productivity growth figures are provided in Table 15. For each of these, output growth includes quality adjustment. The figures suggest that productivity growth in 2009/10 2010/11 was around 2.72% to 3.74%, depending on the input index used.
Table 15 Year-on-year productivity growth
Mixed Indirect
Non-NHS spend from RC
Non-NHS spend from TFRs
Non-NHS spend from RC
Non-NHS spend from TFRs
2004/05 05/06 -0.07% -0.69% 0.01% -0.59% 2005/06 06/07 4.50% 4.05% 5.07% 4.59% 2006/07 07/08 -0.21% -0.85% -0.04% -1.07% 2007/08 08/09 1.44% 1.28% 1.43% 1.27% 2008/09 09/10 -1.25% -1.98% -1.63% -2.31% 2009/10 10/11 3.21% 2.72% 3.74% 3.21%
2009/10 to 2010/11 has seen the lowest growth in inputs used in the NHS across the whole time series, a conclusion that is robust to which ever method of input calculation is used. With growth measured at around 1.3%, the increase is approximately a quarter of the average increase in recent years.
On the other side of the productivity equation, observed output growth has been relatively average with a cost-weighted growth of 3.61% and a quality-adjusted growth rate of 4.57%. As such, the measure of productivity growth in 2009/10 to 2010/11 is positive, this being robust to all alternative measures of input growth. The value of approximately 3% is surpassed only by the 2005/06 to 2006/07 figures, a year with similarly low input growth.
The positive growth continues a fluctuating series of negative/positive productivity estimates over time. The sign associated with the productivity measure seems largely determined by the magnitude of the input growth which shows greater variation over time than output growth. Furthermore, the largest year-on-year increases in inputs (2004/5 - 2005/6; 2008/9 - 2009/10) tend to be followed by lower than average increases in the following period. Thus a fluctuating pattern of above and below average changes in inputs tends to drive the series of productivity change.
Reinforcing this pattern is the observation that output growth seems to demonstrate a degree of lagged response to the input growth. For example, the previous lowest increase in inputs (1.9% in 2005/06 - 2006/07) were followed by the lowest level output growth in 2006/7 - 2007/8 of 3.66%. If there is a lagged effect, the full impact of low input growth this year is likely to more evident in next
H
Figure 17: Outputs, Inputs and Productivity Index, rebased to year 2004/05
Our preferred measure of NHS productivity growth:
Captures both the volume and quality of NHS services in construction of the output index;
Uses direct, rather than expenditure-based, measures of the staff levels in construction of
the input index;
Uses data from the Reference Costs returns to estimate the amount of services procured
from non-NHS bodies and the expenditure on these services, thus making these elements as consistent as possible in the output and input indices.
As figure 17 shows, between 2004/5 and 2010/11, the output growth index increased by 27% andthe input growth index increased by 18%. Comparison of the growth rates of the two indices reveals that NHS productivity increased by 8% between 2004/5 and 2010/11.
Year-on-year productivity growth fluctuates around zero, with years of productivity growth followed by productivity decline. Productivity growth between 2009/10 and 2010/11 amounted to 3.21%. This was driven mainly by a slowdown in input growth, with levels of output growth being maintained.
2004/5 -2005/6
2005/6 -2006/7
2006/7 -2007/8
2007/8 -2008/9
2008/9 -2009/10
2009/10-2010/11
Output Index 1.00 1.06 1.10 1.17 1.22 1.27
Input Index 1.00 1.02 1.06 1.10 1.16 1.18
Productivity Index 1.00 1.04 1.04 1.06 1.04 1.08
References
Bojke C, Castelli A, Goudie R, Street A, Ward P. 2012. Productivity of the English National Health
Service 2003-4 to 2009-10. CHE Research Paper 76. York.
Castelli A, Laudicella M, Street A. 2008. Measuring NHS output growth. CHE Research Paper 43,York.
Castelli A, Laudicella M, Street A, Ward P. 2011. Getting out what we put in: Productivity of the
English National Health Service. Health Economics, Policy and Law. 6;313-335.
Department of Health. 2010. 2010-11 NHS reference costs collection guidance, Leeds, Department of Health.
Derbyshire K, Zerdevas P, Unsworth R, Haslam M. 2007. Further developments in measuring quality adjusted healthcare output, Leeds, Department of Health.
Eurostat. 2001. Handbook on price and volume measures in national accounts, Luxembourg: Office for Official Publications of the European Communities.
Fenty J, Coupland C, Hippisley-Cox J, Gravelle H. 2006. Ddeterminants of consultation rates over time: implications for estimating the national volume of consultations. Nottingham, Qresearch University of Nottingham.
Lakhani A, Coles J, Eayres D, Spence C, Rachet B. 2005. Creative use of existing clinical and health outcomes data to assess NHS performance in England: part 1-performance indicators closely linked
to clinical care. British Medical Journal. 330;1426-1431.
Massey F, 2012. Public service productivity estimates: healthcare, 2010, London, Office for national statistics.
Office for national statistics. 2008. Public service productivity: health care, London, Office for national statistics.
Qresearch. 2009. Trends in consultations rates in general practice 1995-2008 tables. NHS information centre for health and social care.
The information centre for health and social care. 2011. Quality and outcomes framework - 2010-11, England level.
Appendix 1: Deflators
Year
DH Pay Index
DH Prices Index
DH Pay & Prices
index
ONS Medical equipment
ONS Computer machinery
ONS Electrical machinery
CHE pay Index
CHE pharmacy
Index
[image:34.595.65.532.95.245.2]2004/05 0.82 0.87 0.84 0.88 1.20 0.87 1.36 2005/06 0.86 0.89 0.87 0.89 1.12 0.88 1.23 2006/07 0.89 0.92 0.90 0.90 1.05 0.87 1.19 2007/08 0.93 0.93 0.93 0.91 0.97 0.88 1.11 2008/09 0.95 0.98 0.96 0.95 0.94 0.95 0.95 1.06 2009/10 0.97 0.97 0.97 0.97 0.98 0.98 0.98 1.02 2010/11 1.00 1.00 1.00 1.00 1.00 1.00 1.00 1.00
Figure 18: Deflators base year=2010/11
The CHE pay and pharmacy indices are Paasche indices taking the general form:
For the pay index z indicates the number (FTEs) of staff in each occupational group , p
indicates the average wage of staff in the relevant group, and t indexes time.
For the pharmacy index z is the quantity prescribed of drug, defined according to its chemical
Appendix 2: Organisational expenditure
Table 16 Current expenditure on NHS staff and wages (£000)
2004/5 2005/6 2006/7 2007/8 2008/9 2009/10 2010/11
Hospital and ambulance trusts
Total Senior Managers & Managers 1,187,336 1,182,277 1,098,955 919,042 814,855 796,298 836,071
Total Medical Staff (including locums) 5,974,802 5,991,919 5,750,359 5,223,513 4,755,459 4,448,401 4,387,799
Total Dental Staff (including locums) 56,983 52,674 46,746 37,646 35,403 33,140 56,307
Total Nursing Midwifery & Health Visiting Staff 8,477,812 8,538,790 8,204,900 7,321,781 6,410,853 5,923,809 6,120,421
Total Scientific, Therapeutic & Technical Staff 2,942,535 2,994,992 2,904,196 2,581,216 2,310,988 2,192,407 2,394,988
Administrative and clerical 2,452,099 2,505,810 2,408,654 2,163,292 2,021,146 1,934,670 2,028,264
Healthcare Assistants and other Support Staff 1,115,684 1,166,179 1,130,289 1,017,431 944,590 878,497 1,015,203
Maintenance and works staff 219,448 210,717 195,169 173,882 149,775 134,844 119,866
Ambulance staff 662,651 737,866 773,365 832,961 915,701 961,293 977,907
Other employees 73,900 90,480 70,183 98,180 45,036 39,015 46,976
Chairman & Non-Executive Directors 16,125 15,226 12,232 11,560 8,083 6,779 7,465
Total NHS staff - hospital & ambulance 23,179,373 23,486,930 22,595,048 20,380,504 18,411,887 17,349,153 17,991,267
Foundation Trusts
NHS Staff 2,471,600 4,075,900 6,026,996 9,520,162 13,519,900 16,802,900 18,376,975
Chairman & Directors 14,800 26,000 41,969 74,859 109,700 132,000 142,685
30,925
41,226 54,201 86,419 117,783 138,779 150,150
Total NHS staff - FTs 2,486,400 4,101,900 6,068,965 9,595,021 13,629,600 16,934,900 18,519,660
Total NHS staff - all trusts 25,665,773 27,588,830 28,664,013 29,975,525 32,041,487 34,284,053 36,510,927
PCTs
Total Senior Managers & Managers 780,970 863,892 825,938 808,074 891,739 1,041,803 979,417
Total Medical Staff (including locums) 340,367 359,456 386,793 379,779 447,445 449,359 399,512
Total Dental Staff (including locums) 76,315 81,672 79,642 93,216 97,205 104,662 79,489
Total Nursing Midwifery & Health Visiting Staff 2,389,454 2,652,729 2,714,685 2,720,984 2,808,387 2,961,335 2,503,670
Total Scientific, Therapeutic & Technical Staff 815,104 929,085 988,349 1,005,470 1,092,789 1,187,341 1,036,967
Administrative and clerical 772,569 910,954 1,004,588 1,079,280 1,264,287 1,458,809 1,384,532
Healthcare Assistants and other Support Staff 168,873 169,235 172,229 195,796 273,172 345,243 300,808
Maintenance and works staff 19,145 22,261 24,076 21,859 23,607 23,250 22,052
Ambulance staff 95 204 5,103 5,008 3,673 3,272 3,816
Other employees 31,311 49,201 49,731 84,346 71,614 63,784 56,676
Chairman & Non-Executive Directors 88,068 77,949 52,026 42,281 22,660 19,716 17,077
Total NHS staff - PCTs 5,482,270 6,116,638 6,303,160 6,418,594 6,996,578 7,658,575 6,784,016
Total NHS staff - SHAs 186,209 221,279 210,336 145,865 175,388 202,473 218,896
Table 17 Current expenditure on Agency staff and wages (£000)
Table 18 Current expenditure on intermediate inputs (£000)
2004/5 2005/6 2006/7 2007/8 2008/9 2009/10 2010/11
Hospital and ambulance trusts
Medical 299,054 228,969 148,384 155,532 218,586 294,025 339,138
Dental 1,044 3,315 464 155 376 307 240
Nursing, midwifery and health visiting 320,967 246,376 134,055 147,889 200,820 174,988 209,693
Scientific, Therapeutic & Technical Staff 158,854 126,380 86,494 66,054 92,668 113,277 101,122
Administrative & Clerical 114,061 113,867 98,565 131,360 183,103 166,615 134,357
Healthcare Assistants & Other Support Staff 44,408 46,890 35,313 35,010 36,440 39,657 39,947
Maintenance & Works Staff 7,959 4,515 4,008 6,925 7,047 7,013 5,399
Ambulance Staff 198 696 97 1,008 416 3,249 2,889
Other Employees 37,739 45,306 36,632 40,355 32,204 29,214 24,558
Total agency - hospital & ambulance trusts 984,283 816,314 544,012 584,288 771,661 828,345 857,341
Foundation Trusts
Total agency 89,400 132,500 175,419 324,743 622,100 764,100 854,683
Total agency - all trusts 1,073,683 948,814 719,431 909,031 1,393,761 1,592,445 1,712,024
PCTs
Medical 29,963 27,989 28,571 28,186 39,587 54,789 47,168
Dental 1,121 1,703 1,417 1,537 2,556 3,209 1,716
Nursing, midwifery and health visiting 81,324 74,856 59,009 61,113 80,990 91,847 70,358
Scientific, Therapeutic & Technical Staff 57,490 58,500 39,831 41,938 52,931 72,082 47,191
Administrative & Clerical 61,626 72,329 73,640 115,109 239,182 292,571 179,392
Healthcare Assistants & Other Support Staff 11,141 10,339 10,486 7,672 12,376 14,997 15,517
Maintenance & Works Staff 857 793 866 2,859 1,972 1,961 8,750*
Ambulance Staff 4 1 - 2 - - 21
Other Employees 36,579 26,924 28,120 24,218 52,781 40,311 21,273#
Total agency - PCTs 280,105 273,434 241,940 282,634 482,375 571,766 391,383
Total agency - SHAs 203,494 237,688 223,873 162,855 19,316 31,084 24,482
Total agency - NHS 1,557,282 1,459,936 1,185,244 1,354,520 1,895,452 2,195,295 2,127,889 * In 2010/11 Camden PCT increased its expenditure on Maintenance and Works agency staff by £7.4m
# In 2010/11 Croydon PCT decreased its expenditure on "other" agency employees by £10.3m http://www.hsj.co.uk/opinion/columnists/croydons-finance-crisis-is-not-incredible/5051341.article Agency Labour Spend - Current Expenditure (£000)
Intermediate Figures - Current Expenditure (£'000)
2004/5 2005/6 2006/7 2007/8 2008/9 2009/10 2010/11
NHS Hospitals, foundation trusts and ambulance trusts
Drugs & gases 2,591,885 2,647,598 2,814,027 3,115,381 3,460,008 3,773,131 4,111,128 Clinical supplies & services 405,985 594,689 748,493 942,142 1,119,410 1,307,254 1,455,860 General supplies & services 743,426 853,397 911,504 1,045,835 1,119,750 1,177,681 1,226,148 Establishment 951,971 981,559 982,216 1,085,634 1,104,583 1,099,538 1,163,635 Energy & premises 799,962 1,031,786 1,161,463 1,279,173 1,506,901 1,289,767 1,436,318 External purchasing 609,215 669,508 738,923 916,352 962,768 950,531 1,061,324 Miscellaneous 888,577 1,435,572 1,612,571 1,747,727 1,852,820 2,243,732 2,506,806 Total intermediate costs - all trusts 6,991,023 8,214,109 8,969,197 10,132,245 11,126,240 11,841,634 12,961,219
PCTs
Drugs & gases 56,869 113,846 139,378 170,870 187,408 200,988 186,145 Clinical supplies & services 67,404 86,998 73,611 95,094 120,947 124,955 129,315 General supplies & services 125,328 150,141 152,845 152,477 174,110 183,420 165,530 Establishment 426,848 444,423 424,533 480,041 559,159 584,065 501,123 Energy & premises 184,047 266,208 355,355 431,229 517,808 476,204 466,498 External purchasing 3,392,397 4,167,900 4,726,131 5,849,763 6,660,276 7,701,685 8,372,110 Miscellaneous 679,358 703,698 920,175 1,148,231 729,554 792,681 1,053,120 Total intermediate costs - PCTs 4,932,251 5,933,214 6,792,028 8,327,705 8,949,262 10,063,998 10,873,841
Total intermediate costs - SHAs 58,721 67,368 72,493 94,749 109,351 111,812 96,254
[image:36.595.72.532.449.690.2]