Development and validation of a novel high
performance liquid chromatography-coupled
with Corona charged aerosol detector
method for quantification of glucosamine in
dietary supplements
Chhavi AsthanaID1☯, Gregory M. Peterson1☯, Madhur Shastri2☯, Rahul P. PatelID1☯*
1 School of Medicine, Division of Pharmacy, Faculty of Health, University of Tasmania, Hobart, Tasmania,
Australia, 2 School of Health Sciences, Faculty of Health, University of Tasmania, Launceston, Tasmania, Australia
☯These authors contributed equally to this work. *[email protected]
Abstract
Introduction
Glucosamine dietary supplements are commonly used for the management of osteoarthritis (OA). However, clinical trials have reported varying outcomes with regard to joint function and disease progression. One of the possible reasons for variability in observed effects of glucosamine could be that, unlike prescription drugs, the quality of manufactured dietary supplements is not closely monitored in many countries. Therefore, there is the possibility that the actual amount of glucosamine present in a dietary supplement is different from that claimed on the label. The quality control of glucosamine supplements is further complicated by the unavailability of a simple and effective analytical method for the analysis of glucos-amine. Therefore, the aim of this study was to develop a simple analytical method that could be easily adapted by the pharmaceutical industry for routine analysis of glucosamine.
Aims
To develop a novel high-performance liquid chromatography (HPLC) method for the quanti-fication of glucosamine, and determine the amount of glucosamine present in a sample of dietary supplements commercially available in Australia and India.
Methods
Chromatographic separation of glucosamine was achieved using a zwitter-ionic hydrophilic interaction liquid chromatography column with a mobile phase consisting of 60% acetonitrile and 40% of 85 mM ammonium acetate, at a flow rate of 0.3 mL/min and column temperature 40˚C. The developed method was validated for intra- and inter-day linearity, accuracy, preci-sion, and reproducibility. The newly-developed method was subsequently used to analyse 12 glucosamine supplements.
a1111111111 a1111111111 a1111111111 a1111111111 a1111111111
OPEN ACCESS
Citation: Asthana C, Peterson GM, Shastri M, Patel RP (2019) Development and validation of a novel high performance liquid chromatography-coupled with Corona charged aerosol detector method for quantification of glucosamine in dietary supplements. PLoS ONE 14(5): e0216039.https:// doi.org/10.1371/journal.pone.0216039
Editor: Moonis Ali Khan, King Saud University, SAUDI ARABIA
Received: September 18, 2018
Accepted: April 14, 2019
Published: May 6, 2019
Copyright:©2019 Asthana et al. This is an open access article distributed under the terms of the
Creative Commons Attribution License, which permits unrestricted use, distribution, and reproduction in any medium, provided the original author and source are credited.
Data Availability Statement: All relevant data are within the paper.
Funding: The authors received no specific funding for this work.
Results
The developed method was selective for glucosamine, which had a retention time of 5.9 min. The standard curve was linear with a correlation coefficient (r2) exceeding 0.99, over the range of 10–200μg/mL for glucosamine. The relative standard deviations for intra- and inter-day accuracy, precision and reproducibility were all less than 4%. The amount of glu-cosamine determined in six Australian and six Indian gluglu-cosamine supplements ranged between 98.7–101.7% and 85.9–101.8% of the labelled values, respectively.
Discussion
Unlike previous HPLC methods, this newly-developed HPLC technique does not require pre-derivatisation and can separate glucosamine from both hydrochloride and sulphate salts, and from other amino sugars, such as chondroitin sulphate present in dietary supple-ments. This simple and effective technique can be employed by analytical laboratories for the quality control of glucosamine dietary supplements.
Conclusion
The current study has developed a new analytical technique using HPLC-Corona CAD, which can analyse underivatised glucosamine hydrochloride and sulphate within 6 minutes. Using the novel assay, we confirmed that unlike the tested Australian dietary supplements,
only half of the tested Indian products had a glucosamine content within±10% of what was claimed on the label.
Introduction
Osteoarthritis (OA) is a degenerative joint disease commonly affecting the population aged 45
years and above [1]. In OA, the articular cartilage, which is composed of water and substances
such as proteoglycans and collagen, is progressively degenerated. Amino sugars, such as glu-cosamine and chondroitin, are two main components of the glycosaminoglycan that
consti-tutes proteoglycans [2,3]. Therefore, glucosamine is commonly used as a dietary supplement
for the management of OA; approximately 27% patients in America [4], 13% in Canada [5],
6.2% in Ireland [6], 12.2% in Korea [7], 8.8% in France, 14.3% in Spain [8], 26.2% in India [9]
and 22% in Australia use glucosamine supplements for the management of their OA [10].
Randomised double-blinded placebo-controlled studies have indicated that glucosamine is
effective in alleviating symptoms and improving joint movement [11] and can significantly
delay disease progression [12] in patients with mild to moderate OA. On the other hand, some
clinical studies have shown that glucosamine is neither effective in improving the symptoms
associated with OA [13], nor useful in delaying the disease progression [14].
A number of reasons, such as varying dosage forms, salt forms of glucosamine [14,15],
treatment durations [11,12], study end-points, dosage regimens [13,14], concomitant use of
analgesics [11], participants with various stages of disease progression [16,17], and the use of
either pharmaceutical grade or dietary supplement glucosamine [18–20] could be responsible
for the observed discrepancies in reported clinical outcomes. One important reason for the observed inconsistent findings could be that the actual amount of glucosamine present in
investigated the amount of glucosamine present in 15 commercially available dietary supple-ments using high-performance liquid chromatography (HPLC). More than 93% of the tested supplements had a lower amount of glucosamine than what was claimed on the label, with the
amount of glucosamine varying from 41 to 108% of the content stated [21].
HPLC and capillary electrophoresis coupled with ultraviolet (UV) detection are widely used analytical techniques for the analysis of pharmaceutical and dietary supplements. How-ever, the major problem associated with the detection of glucosamine is that it does not con-tain the required UV chromophore. Therefore, pre-derivatisation of glucosamine with
reagents is required to add a UV chromophore before analysis [22]. Similarly, glucosamine has
no peculiar fluorophore and therefore the use of reducing agents are needed prior to its
analy-sis using HPLC coupled with a fluorescence detector (FLD) [23,24]. However, the process of
derivatisation is laborious and time-consuming, and there is a possibility of analytical
compli-cations owing to the presence of by-products and excessive derivatising agent [25,26].
The presence of a chromophore is not a prerequisite when HPLC is coupled with an evapo-rative light scattering detector (ELSD), mass spectrometry (MS) or refractive index (RI) detec-tor. HPLC-ELSD and HPLC-MS have been used to quantify glucosamine present in a mixture
of monosaccharides [27] and plasma [28], respectively. However, they have not been used or
validated to quantify glucosamine in dietary supplements. Way et al. developed a reversed-phase ion-pair HPLC-RI technique for the quantification of glucosamine in one type of dietary
supplement [29]. The main problem associated with the method developed by Way et al. was
its inability to separate glucosamine from chondroitin sulphate, another amino sugar like glu-cosamine, commonly present in many glucosamine-containing dietary supplements. Studies have reported delayed disease progression of OA when glucosamine is used in combination
with chondroitin sulphate, compared to glucosamine alone [12,30].
Thus, there is a need to develop a simple analytical method that can effectively separate and quantify underivatised glucosamine and other ingredients, including structurally similar com-ponents, present in dietary supplements. Therefore, we aimed to develop and validate a simple HPLC method coupled with the Charged Aerosol Detector (CAD) to detect and quantify glu-cosamine. The developed method was validated and its application was demonstrated by ana-lysing the glucosamine content of a sample of dietary supplements commercially available in Australia and India.
Experimental
HPLC instrumentation
A Dionex 3300 HPLC system (Thermo Fisher, California, USA) consisting of Dionex Ultimate 3000 RS pump with an internal degasser was used to pump and automatically mix mobile phase from separate chambers. Samples were auto-injected, and the temperature was con-stantly maintained with a Dionex Ultimate 3000 RS Autosampler. A Dionex Ultimate 3000 RS Column Compartment was employed to keep the column at a stable temperature. The analytes were detected using a Dionex Corona Ultra RS Charged Aerosol Detector (CAD). Chromeleon 7 Chromatography software was used to control the operations of the instrument and to run data acquisition.
HPLC assay
A chromatographic separation was performed using a Zwitterion hydrophilic interaction
liq-uid chromatography (ZIC-HILIC) column with a 200-Åpore size (SeQuant ZIC-HILIC, 150
For Corona CAD, nebuliser temperature was set at 25˚C. Nitrogen gas was used as carrier gas at 2 L/minute flow rate to evaporate mobile phase and to produce particles of analytes. The data collection rate, power function and filter time constant were kept at 100 Hertz, 1 and 3 seconds, respectively. The temperature of the sample compartment was set at 10˚C and the
col-umn compartment was either 25˚C or 40˚C. The injection volume was 5μL.
Method development
The stock solution of glucosamine (2 mg/mL) was prepared by dissolving 20 mg of glucos-amine reference standard (glucosglucos-amine hydrochloride or glucosglucos-amine sulphate, Sigma Aldrich, NSW, Australia) in 10 mL of Milli-Q water and diluted with mobile phase to obtain a
concentration of 80μg/mL. For the method development, the mobile phase consisted of either
100, 85 or 80 mM of ammonium acetate (Sigma Aldrich, NSW, Australia) (mobile phase A) and various compositions of acetonitrile (50%, 60%, 65%, 75%, or 80%; Sigma Aldrich, NSW, Australia) (mobile phase B). The mobile phase A was prepared by dissolving 7.708 g, 6.55 g or 5.66 g of ammonium acetate in 1 L of Milli-Q water (Millipore Corporation, MA, United States) to prepare 100, 85 or 80 mM solutions, respectively. The mobile phase was filtered
using a Millipore vacuum equipped with a 0.45μm filter. The filtered mobile phase was
degassed by ultrasonic bath (Sonorex RK-100, Bandelin Electronic, Berlin, Germany) for 10 minutes prior to its use. An isocratic elution of analytes was carried out using different compo-sitions of mobile phase-A and mobile phase-B (40:60, 35:65, 30:70, 25:75 or 20:80 v/v). The mobile phase flow rate was set at either 0.3, 0.4 or 0.5 mL/minute.
When 100 mM ammonium acetate was employed, the composition of mobile phase B (ace-tonitrile) varied from 50–80%, the column temperature was either 25˚C or 40˚C and the flow rate varied from 0.3–0.5 mL/minute. When 85 mM or 80 mM ammonium acetate was
employed, the composition of mobile phase B was 60%, the column temperature was 40˚C and the flow rate was 0.3 mL/minute.
HPLC assay performance
Linearity
The stock solution (2 mg/mL) of glucosamine reference standard was serially diluted with Milli-Q water to obtain six different calibration standards containing 10, 20, 80, 160, and 200μg/mL of glucosamine. The relationship between analyte concentration and the Corona-CAD response was determined by analysing glucosamine calibration standards. Calibration graphs were generated by plotting peak areas versus glucosamine concentrations and used to
determine the linear regression coefficient (r2). Each sample was prepared in triplicate and
analysed in triplicate.
Accuracy, precision and reproducibility
Calibration standards with a low, medium and high concentration of glucosamine
hydrochlo-ride and glucosamine sulphate reference standard (10, 80 and 200μg/mL) were used for the
determination of accuracy, precision and reproducibility. Mean intra- and inter-day (3 conse-cutive days) accuracy values for the glucosamine peak (n = 6) were determined by the regres-sion equation as follows: (observed concentration—expected concentration)/expected
concentration×100. Intra- and inter-day (3 consecutive days) precision values were
HPLC system suitability
The system suitability was investigated using the tailing factor (T), theoretical plate number
(N) (theoretical plate number was calculated using following equation:N = 5.54 × (Rt/W0.5)2/
l,where N = number of theoretical plates per meter,Rt= Retention time of glucosamine,W0.5=
peak width of glucosamine at half-height and l = length of HPLC column in meters, the capacity factor (also known as retention factor; K), and resolution factor (Rs) for the glucosamine peak. The limit of detection and limit of quantification were investigated based on the signal-to-noise (S/N) ratio by establishing the minimum concentration at which the glucosamine could be reliably detected and quantified. Determination of the S/N ratio was performed by
compar-ing the peak height of samples (5, 2.5, 1.25μg/mL of glucosamine reference standard, n = 5)
with those of blank samples (n = 5). The S/N ratio was established using the equation,2H/h,
whereH= peak height of each concentration (5, 2.5, 1.25μg/mL) of glucosamine andh= the
difference between the largest and smallest noise values of the blank sample. Both H and h val-ues were measured between the same time width in chromatograms of the analyte
(glucos-amine reference standard) and the blank samples, respectively [31,32].
HPLC assay robustness
We investigated the robustness of the method by determining the effect of deliberate changes
to pH of ammonium acetate (6.57±0.2), composition of ammonium acetate (85±2 mM),
composition of acetonitrile (60%±2%) and the column temperature (40±5˚C) on peak area
of glucosamine (80μg/mL of glucosamine reference standard, n = 3). These parameters were
selected as per the recommended guidelines [33,34].
HPLC assay application
The newly-developed method was applied to investigate the amount of glucosamine present in twelve different commercially available dietary supplements. Six supplements (capsule, tablet and liquid) were obtained from local pharmacies in Hobart, Tasmania, Australia and six sup-plements (tablet) were obtained from Bengaluru, Karnataka, India. The details of various brands of glucosamine supplements including brand name, type of formulation, salt form, amount claimed on the label, tablets were either film coated or uncoated are provided in
Table 1. Three capsules and tablets were randomly selected and weighed individually, followed by calculation of the percent weight variation (%WV) using the following equation, %WV =
(w/W)×100, where ‘W’ is average weight of three randomly selected capsules or tablets and
‘w’ is the difference between the average weight and individual weight of capsule or tablet. The percentage weight variation calculated for capsules or tablets in each brand was less than 5% in
all the brands as shown inTable 1, which is within the limit recommended by United States
Pharmacopoeia (USP) [35].
Extraction of glucosamine from capsules, tablets or liquid
Glucosamine capsules (n = 3) were weighed individually. The capsule shell was opened, and the content was emptied and weighed. The empty capsule shell was weighed, and its weight was added to its content weight to obtain a final weight value. This weight value was compared to the initial weight of the whole capsule to analyse any loss of capsule content during the process of emptying
and weighing. The maximum percentage loss of capsule content was�0.02%. The capsule content
Glucosamine tablet (n = 3), with or without film coating (please refer toTable 1) was placed in a clean porcelain mortar and crushed carefully, as finely as possible, using a pestle. The crushed tablet containing 500, 750, or 1500 mg of glucosamine hydrochloride or sulphate was then mixed with either 10, 15, or 30 mL of Milli-Q water to obtain a mixture expected to con-tain 50 mg/mL of glucosamine hydrochloride or sulphate. Each sample was prepared in tripli-cate and analysed in triplitripli-cate.
One mL of the liquid formulation (n = 3) containing 100 mg/mL of glucosamine hydro-chloride was withdrawn from the amber-coloured glass bottle and mixed with 1 mL of Milli-Q water in a 15 mL plastic tube, to obtain a mixture expected to contain 50 mg/mL of glucos-amine hydrochloride. Each sample was prepared in triplicate and analysed in triplicate.
The mixture (capsule, tablet or liquid) present in the plastic tube was centrifuged (CM-6MT, ELMI Ltd., Riga, Latvia) at 2300 rpm for 15 minutes. The supernatant (3 mL) was with-drawn using a 5 mL plastic syringe fitted with a 21G needle (Terumo Corporation, NSW, Aus-tralia). Following withdrawal of the sample, the needle was removed, and the syringe content
was filtered using a 0.22μm (25 mm) polyether sulphone (PES) syringe filter (Livingstone,
NSW, Australia) to remove any particulate matter. The 10μL aliquot of the collected filtrate
Table 1. Brand name, type of formulation, salt form and amount claimed on the label of glucosamine supplements available in Australia and India.
Product No. Brand name Formulation Glucosamine Salt Claimed Amount % Weight variation�� �
a Wagner Capsulea� Glucosamine sulphate 750 mg <2%
b Nature’s Own Tabletb� Glucosamine hydrochloride 1500 mg <1%
c Nature’s Own Liquidc� Glucosamine hydrochloride 1500 mg Not applicable
d Blackmores Advanced Tabletd� Glucosamine sulphateFC
750 mg <2%
e Healthy Care Capsulee� Glucosamine hydrochloride 1000 mg <1%
f Swisse Tabletf� Glucosamine sulphate 1500 mg <1%
g Lubry-GM Tabletg�� Glucosamine sulphateFC
750 mg <1%
h Jointace Tableth�� Glucosamine sulphateFC 750mg <3%
i Rejoint Tableti�� Glucosamine sulphateFC 500 mg <3%
j Apollo Pharmacy Tabletj�� Glucosamine sulphateFC 1500mg <1%
k Cartigen Forte Tabletk�� Glucosamine sulphateFC
750 mg <2%
l Lubrijoint Plus Tabletl�� Glucosamine sulphateFC 750 mg <2%
�= Australian Brand
��= Indian Brand
���overall percent weight variation in each brand
FC
= Film coated tablets a
= containing 1000 mg of glucosamine sulphate-potassium chloride complex equivalent to 754 mg of glucosamine sulphate with 140 mg of methylsulphonylmethane b
= containing 1500 mg of glucosamine hydrochloride and 100 mg of chondroitin sulphate c
= each 15 mL containing 1500 mg of glucosamine hydrochloride d
= containing glucosamine sulphate-sodium chloride complex (942 mg) equivalent to 750 mg of glucosamine sulphate and 400 mg of chondroitin sulphate e
= containing 1000 mg of glucosamine hydrochloride f
= containing glucosamine sulphate-sodium chloride complex (1.88 mg) equivalent to 1500 mg of glucosamine sulphate with 500 mgZingiber officinaleor ginger equivalent to 2.5 mg gingerols
g
= containing 750 mg glucosamine sulphate-potassium chloride complex h
= containing 750 mg of glucosamine sulphate-potassium chloride complex, equivalent to 446 mg of glucosamine with 250 mg of methylsulphonylmethane and 50 mg of diacerin
i
= containing 500 mg of glucosamine sulphate-sodium chloride complex with 400 mg chondroitin sulphate j
= containing 1500 mg of glucosamine sulphate-potassium chloride complex k
= containing 750 mg of glucosamine sulphate-potassium chloride complex with 100 mg chondroitin sulphate and 250 mg of methylsulphonylmethane l
= containing 750 mg of glucosamine sulphate-potassium chloride complex, equivalent to 444 mg of glucosamine
was mixed with 990μL of Milli-Q water to obtain a stock solution expected to contain a 500μg/mL of glucosamine salt. The appropriate amount of this stock solution was then diluted
with Milli-Q water to obtain a solution containing 80μg/mL of glucosamine salt. Each sample
was prepared in triplicate and analysed in triplicate.
Extraction recovery
A known concentration of glucosamine sulphate reference standard solution (500μg/mL) was
spiked into the capsule content (n = 2, containing glucosamine sulphate) that was emptied into a tube. A known concentration of glucosamine hydrochloride reference standard solution (500μg/mL) was spiked into the crushed tablet (n = 2, containing glucosamine hydrochloride) and into the liquid (n = 2, containing glucosamine hydrochloride) content. Extraction of glu-cosamine from the spiked capsule, tablet and liquid content was performed as described above and a mixture containing 50 mg/mL of either glucosamine sulphate or glucosamine hydro-chloride was obtained.
The spiked mixture was then centrifuged, 3 mL supernatant was collected and then filtered
using a syringe filter. The 10μL aliquot of the filtered spiked solution was mixed with 990μL
of Milli-Q water to obtain a stock solution expected to contain 500μg/mL of glucosamine salt.
The stock solution was then diluted to obtain an expected glucosamine concentration of 80μg/mL. Each sample was prepared in triplicate and analysed in triplicate.
Stability of glucosamine
The stability of glucosamine hydrochloride and glucosamine sulphate was determined at 4˚C
and at room temperature for 48 hrs. The sample (10 mL) containing 200μg/mL of
glucos-amine hydrochloride (n = 3) and 200μg/mL of glucosamine sulphate (n = 3) was prepared and
stored at 4˚C and at room temperature. An aliquot (1 mL) was withdrawn at 0 (immediately after preparation), 2, 12, 24, 36 and 48 hours after the storage. The withdrawn samples were then analysed using the newly developed HPLC-Corona CAD method to determine the change in glucosamine concentration. Each sample was analysed in triplicate.
Sample analysis
A calibration standard solution (n = 2) containing 80μg/mL of either glucosamine
hydrochlo-ride or glucosamine sulphate reference standard was prepared. Glucosamine sample solutions, glucosamine spiked solutions and the reference standard were subjected to HPLC analysis. Each sample was prepared in triplicate and analysed in triplicate.
A calibration curve for both glucosamine hydrochloride and glucosamine sulphate
refer-ence standard was generated (10–200μg/mL). The amount of glucosamine in each sample was
calculated by comparing the peak area of glucosamine sample solution with the peak area of glucosamine reference standard. The extraction recovery of glucosamine was calculated by comparing the peak area of filtered glucosamine reference standard solution and glucosamine spiked solution with the peak area of glucosamine reference standard. Each sample was pre-pared in triplicate and analysed in triplicate.
Results and discussion
Effect of acetonitrile
Acetonitrile is an aprotic solvent and recommended as the preferred organic solvent for the ZIC-HILIC column because it has lower hydrogen binding ability or HILIC strength
has higher HILIC strength than acetone but has comparatively better separation ability [37]. In addition, acetonitrile is also recommended as an organic solvent with CAD due to its
consider-able volatility [38]. Therefore, only acetonitrile was employed as an organic modifier for the
HILIC method development. The effect of different compositions of acetonitrile on separation, retention time, peak width and peak height of glucosamine hydrochloride was investigated by
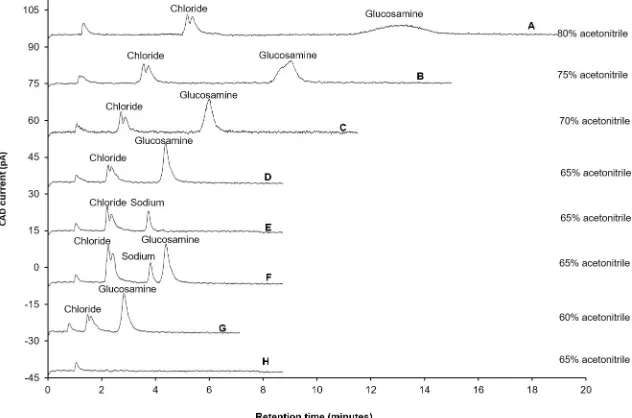
changing the composition of acetonitrile from 80 to 65%, (Fig 1A, 1B, 1C and 1D). The other
parameters, such as composition of ammonium acetate (100 mM), flow rate (0.5 mL/min), col-umn temperature (25˚C) and CAD settings (data collection rate-100 Hertz, power function-1 and filter time constant-3 seconds), were kept constant. When the composition of acetonitrile
was 80%, the retention time of glucosamine was 15 min (Fig 1A). The peak of glucosamine
was broad with a peak width of 1.42 min and peak height of 2.855 pA. The retention time of glucosamine decreased from 15 min to 9 min, 6 min and 4.3 min when the acetonitrile
compo-sition was changed from 80 to 75% (Fig 1B), 70% (Fig 1C) and then 65% (Fig 1D), respectively.
With 75% acetonitrile composition the peak height was increased from 2.855 pA to 8.956 pA, but the peak still appeared to be broad (peak width: 0.672 min). However, the peak height of glucosamine increased by more than 173% (peak height increased: 15.496 pA) and peak width decreased by 32% (peak width: 0.215min) when the acetonitrile composition was decreased
from 75% to 65%. Using the same analytical conditions, sodium chloride (Fig 1E and 1F) was
analysed to confirm that the peak eluting at 2.4 min, near to the solvent peak (Fig 1H), was
chloride. The glucosamine peak eluted very near to the chloride peak and closer to the solvent
front when the acetonitrile composition was decreased to 60% (Fig 1G). Therefore, further
experiments were carried out using 65% acetonitrile composition.
As expected, reducing the composition of an organic modifier in the mobile phase decreased the retention time of glucosamine. In normal phase chromatography, water forms a
pseudo-sta-tionary layer over the polar stapseudo-sta-tionary phase of the ZIC-HILIC column [39]. Glucosamine is
polar in nature; therefore, it is likely to be immobilised in a water-rich pseudo-stationary layer
[image:8.612.201.517.79.288.2][39,40]. The elution rate of immobilised glucosamine depends on the hydrophilicity of the
Fig 1. Influence of various compositions of acetonitrile on separation of glucosamine hydrochloride. Experimental conditions: ZIC-HILIC column (150, 4.6 mm), 200Å, 5μm; mobile phase containing various compositions of acetonitrile (as specified in chromatograms) and 100 mM ammonium acetate; column temperature was 25˚C; detection with Corona-CAD; flow rate-0.5 mL/min; injection volume 5μL.
mobile phase. Therefore, reducing the acetonitrile composition from 80% to 65% weakened the interaction of glucosamine with the pseudo-stationary phase, resulting in a decreased retention time of glucosamine.
Satisfactory separation was achieved when the composition of the mobile phase was 65%
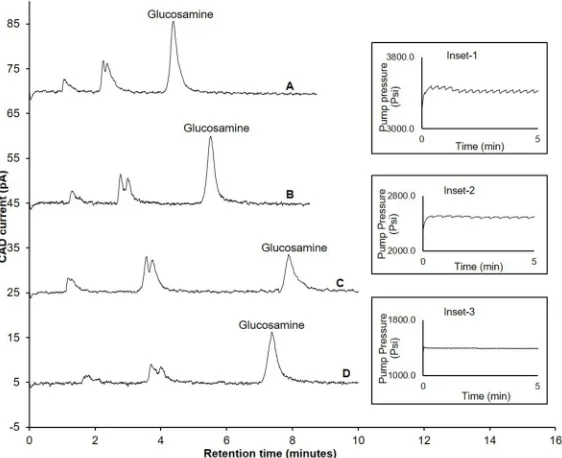
acetonitrile and 35% 100 mM ammonium acetate (Fig 2A). However, with the repeated
injec-tion (n = 10) of glucosamine, the column backpressure increased beyond the maximum allowed limit (5800 psi), resulting in either appearance of spikes during the chromatographic
analysis (Fig 2inset-1) or system error due to sudden termination of the pump operation. This
could be due to two possible inter-related reasons; firstly, the use of a maximum recommended flow rate for the column (0.5 mL/min) and, secondly, a decrease in volatility of the mobile phase when the acetonitrile composition was decreased to 80% from 65%.
Effect of flow rate and temperature on backpressure
To overcome the above-mentioned problem, the flow rate was first decreased from 0.5 mL/ min to 0.4 mL/min, resulting in an increased retention time and acceptable peak symmetry
(Asymmetry factor: 1.4) of (Fig 2B). However, the fluctuation in backpressure was still
observed with repeated injections (n = 10) (Fig 2inset-2) using 0.4 mL/min. Hence, the flow
rate was decreased to a minimum recommended limit (0.3 mL/min). No fluctuation in reten-tion time was observed at this flow rate with repeated injecreten-tions of glucosamine hydrochloride
(n = 10) (Fig 2inset-3). As expected, the retention time of glucosamine was increased (Fig 2C),
[image:9.612.203.484.377.606.2]but the peak appeared to be tailing, compromising the peak symmetry (Asymmetry factor:
Fig 2. Influence of flow rate and temperature on backpressure and retention time of glucosamine hydrochloride. A) Retention time of glucosamine and backpressure of the column (Inset-1) when flow rate was 0.5 mL/min and column temperature was 25˚C; B) Retention time of glucosamine when flow rate was 0.4 mL/min and column temperature was 25˚C; C) Retention time of glucosamine and backpressure of the column (Inset-2) when flow rate was 0.3 mL/min and column temperature was 25˚C; D) Retention time of glucosamine and backpressure of the column (Inset-3) when flow rate was 0.3 mL/min and column temperature was 40˚C; Experimental conditions: ZIC-HILIC column (150, 4.6 mm), 200Å, 5μm; mobile phase containing 65% acetonitrile and 100 mM ammonium acetate; column temperature (as specified above); detection with Corona-CAD; flow rate- (as specified above); injection volume 5μL.
1.7). Therefore, we investigated the effect of temperature on glucosamine retention time and peak symmetry by changing the temperature of the column from 25˚C to 40˚C. At the latter
temperature, glucosamine eluted at 7.9 min (Fig 2D), with acceptable peak symmetry
(Asym-metry factor: 1.4).
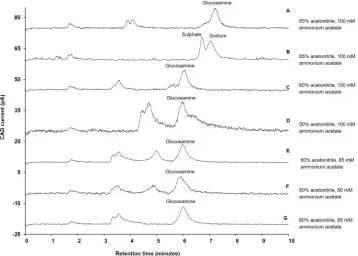
Attempts were made to separate the glucosamine sulphate using the same chromatographic conditions employed to separate glucosamine hydrochloride. The separation of glucosamine
sulphate is shown inFig 3A. It appeared that glucosamine co-eluted with another analyte,
most likely sulphate, present in the sample. The composition of the co-eluted peak was
con-firmed by analysing sodium sulphate (Fig 3B). To overcome this problem, the composition of
acetonitrile was changed from 65% to 60%, and then the retention time of glucosamine
decreased to 5.9 min. However, the sulphate still co-eluted with glucosamine (Fig 3C). The
ace-tonitrile composition was changed to 50%; however, it resulted in increased baseline noise (Fig
3D). This observed baseline noise could have been again due to an increase in viscosity and
[image:10.612.203.561.80.336.2]decrease in volatility of the mobile phase due to the decrease in composition of acetonitrile. Therefore, we investigated the effect of ammonium acetate on the separation of glucosamine sulphate.
Fig 3. Influence of various composition of acetonitrile and ammonium acetate on separation of glucosamine. A) Separation of glucosamine sulphate when mobile phase contain 65% acetonitrile and 100 mM ammonium acetate; B) Separation of sodium sulphate when mobile phase contain 65% acetonitrile and 100 mM ammonium; C) Separation of glucosamine sulphate when mobile phase contain 60% acetonitrile and 100 mM ammonium acetate; Inset-1: Separation of glucosamine sulphate when mobile phase contain 50% acetonitrile and 100 mM ammonium acetate; D) Separation of glucosamine sulphate when mobile phase contained 50% acetonitrile and 100mM ammonium acetate; E) Separation of glucosamine sulphate when mobile phase contain 60% acetonitrile and 85 mM ammonium acetate; F) Separation of glucosamine sulphate when mobile phase contain 60% acetonitrile and 80 mM ammonium acetate; G) Separation of glucosamine hydrochloride when mobile phase contain 60% acetonitrile and 85 mM ammonium acetate; Experimental conditions: ZIC-HILIC column (150, 4.6 mm), 200Å, 5μm; mobile phase containing various
composition of acetonitrile (as specified above) and ammonium acetate (as specified above); column temperature 40˚C; detection with Corona-CAD; flow rate 0.3 mL/minute; injection volume 5μL.
Effect of ammonium acetate concentration
The concentration of ammonium acetate was changed from 100 mM to 85 mM. At 85 mM concentration, sulphate was separated from glucosamine without affecting the retention time
of the glucosamine peak (retention time: 5.9 min) (Fig 3E). When the ammonium acetate
con-centration was further decreased to 80 mM, no change in separation was observed but there
was an increase in baseline noise (Fig 3F). Therefore, 85 mM ammonium acetate was selected
for the analysis of the dietary supplements.
The co-elution of sulphate and glucosamine at 100 mM ammonium acetate could be due to the repulsive forces generated by sulphonate groups present at the terminal end of the station-ary phase of the column being insufficient for early elution of sulphate ions, due to their
inter-action with positively charged ammonium ions supplied by 100 mM ammonium acetate [40].
However, at 85 mM ammonium acetate, the concentration of ammonium ions was decreased and availability of sulphonate groups increased resulting in increased repulsive forces required
for early elution of the sulphate ions (Fig 3E). Using the same chromatographic conditions,
glucosamine hydrochloride was successfully separated (Fig 3G).
Assay performance
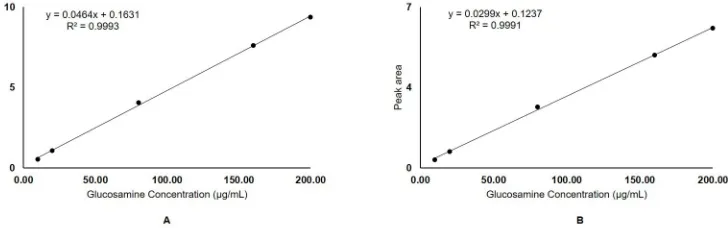
The linear regression equation obtained for glucosamine hydrochloride and glucosamine
sul-phate wasy = 0.0464x + 0.1631(Fig 4A)and y = 0.0299x + 0.1237(Fig 4B), respectively (where
y is the peak area corresponding to the concentration, x of glucosamine). The linearity of the
method estimated using correlation coefficient (r2) was found to be greater than 0.99 for
glu-cosamine hydrochloride and gluglu-cosamine sulphate. The assay performance results are shown inTable 2. The mean inter- and intra-day accuracy and precision % relative standard deviation (%RSD) for each of the tested composition of glucosamine hydrochloride and glucosamine
sulphate (10, 80 and 200μg/mL) were found to be less than 4%. The mean inter- and
intra-day reproducibility % RSD for each of the tested composition of glucosamine hydrochloride
and glucosamine sulphate (10, 80 and 200μg/mL) were found to be less than 3% and 2%,
respectively.
The system suitability results are shown inTable 3. For both glucosamine hydrochloride
and glucosamine sulphate the theoretical plate number for glucosamine was>13000,
suggest-ing good efficacy and the resolution factor (Rs) was>1.9, indicating a good separation of
glu-cosamine. The capacity factor (K) was�1.79 indicating the peak of glucosamine was well
separated with respect to the void volume. The limit of detection and quantitation for
glucos-amine was found to be 1.25 and 5μg/mL, respectively, for both glucosamine hydrochloride
[image:11.612.208.572.558.672.2]and glucosamine sulphate.
Fig 4. Calibration curve with linear regression equations and correlation coefficients (r2) generated by plotting peak areas versus glucosamine concentrations (10–200μg/mL) of A) Glucosamine hydrochloride reference standard; B) Glucosamine sulphate reference standard.
The %RSD for peak area of glucosamine (80μg/mL, n = 3) with change in 1) pH of ammo-nium acetate (6.27 or 6.87) was 1.52 and 1.75%; 2) concentration of ammoammo-nium acetate (83 or 87 mM) was 2.12 and 2.6%; 3) composition of acetonitrile (58 or 62%) was 2.29 and 2.8%; and 4) temperature (35 or 45˚C) was 2.44 and 2.19%.
Extraction recovery
The mean percentage extraction recovery of glucosamine hydrochloride and glucosamine sul-phate standard was 100.2% and 100.3%, respectively. The percentage extraction recovery of glucosamine recovered from the spiked glucosamine formulations (capsule, tablet and liquid)
that were prepared with filtration was found to be in the range of 99.3% to 101.9% (Table 4).
It is important to investigate the effect of filtration on the recovery of pharmaceutical agents. Filtration could affect the concentration of a drug present in an admixture. For exam-ple, depending on the physicochemical properties of a drug and characteristics of the filter
membrane, drug can be absorbed or adsorbed onto the filter membrane [41]. Drug molecules
or excipients can interact with the filter membrane, resulting in drug loss [42]. In the current
study, glucosamine tablets were crushed, dissolved and centrifuged. The supernatant before fil-tration contained hundreds of thousands of visible particles. The commercially available filters are designed to remove small particulate matter rather than suspension containing heavy
parti-cle load [42]. Therefore, depending on the filter membrane/area and applied pressure during
filtration, the membrane could be ruptured resulting in contamination of the sample [43]. The
[image:12.612.39.577.88.204.2]samples were spiked with glucosamine standard to obtain extraction recovery, since a supple-ment may contain more or less than 100% glucosamine of the labelled amount. For example, if Table 2. Mean inter- and intra-day accuracy, precision, reproducibility and linearity for glucosamine hydrochloride and glucosamine sulphate.
GH Concentr-ation (μg/mL) Accuracyb(%RSD) Precisionc(%RSD) Reproducibilityd(%RSD) Linearity Inter-daya Intra-day Inter-daya Intra-day Inter-daya Intra-day Slope / Intercept r2
10 3.85 3.17 3.39 3.42 2.89 1.34 0.0464/
0.1631
0.9993
80 3.62 2.88 2.94 2.16 2.92 1.51
200 2.71 2.10 2.37 1.97 2.15 1.28
GS Concentr-ation (μg/mL)
10 3.52 3.10 3.21 3.27 2.97 1.42 0.0299/
0.1237
0.9991
80 3.12 3.18 2.87 2.51 2.32 1.29
200 2.13 2.12 2.04 2.09 2.11 1.19
GH = Glucosamine hydrochloride; GS = Glucosamine sulphate a
= mean %RSD of inter-day accuracy, precision or reproducibility determined for 5 consecutive days for the glucosamine peak (n = 6) b
= determined by the regression equation as follows: (observed concentration—expected concentration)/expected concentration×100 c
= determined using peak areas with repeat analysis d
= determined using peak retention time of glucosamine with repeat analysis; r2= correlation coefficient
https://doi.org/10.1371/journal.pone.0216039.t002
Table 3. Results of system suitability.
System Suitability Parameters Observed Values
Glucosamine Hydrochloride Glucosamine Sulphate
Theoretical plate number 13106 13111
Resolution factor 1.91 1.93
Capacity factor 1.87 1.79
[image:12.612.200.580.631.696.2]the extraction recovery of a glucosamine supplement was found to be 95%, when analysed without spiking its content with the reference standard, it would be difficult to determine whether the loss is due to filtration or the sample itself containing less than the labelled amount of glucosamine. Similarly, if a supplement actually contains 105% of the labelled amount, but its analysis indicates that the extraction recovery is 100%, then it is challenging to conclude whether this 5% loss in glucosamine content is due to loss during filtration. The extraction recovery of filtered glucosamine hydrochloride and glucosamine sulphate reference standard was found to be 100% and the extraction recovery of glucosamine from spiked sample was ±1% of the expected concentration.
No significant difference (p>0.05 with analysis of variance) was found between the mean
extraction recovery of glucosamine extracted from spiked capsule, tablet or liquid samples and glucosamine hydrochloride and glucosamine sulphate reference standard, indicating that the polyethersulphone filter membrane is suitable and the method employed for extracting glucos-amine from formulations was efficient.
Stability of glucosamine
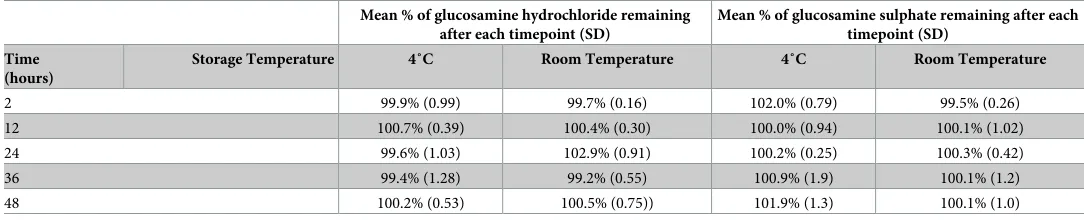
Although commercially available samples were analysed within 2 hours of their extraction and preparation, this study investigated the stability of glucosamine for up to 48 hours at 4˚C and
room temperature. The results are shown inTable 5. The concentration of glucosamine at
time 0 hours was considered as 100%. Glucosamine concentration in glucosamine hydrochlo-ride and sulfate was found to be greater than 99% when stored at 4 and room temperature for 48 hours.
The samples were stored up to 48 hours because at some instances, due to multiple number of samples, the analysis cannot be performed immediately after the sample preparation. Table 4. Mean percentage recovery of glucosamine from spiked sample solutions after filtration.
Glucosamine source (n = 2) Mean % recovery of glucosamine±SD
Glucosamine hydrochloride standard 100.2±0.03
Glucosamine sulphate standard 100.3±0.85
Capsulea 100.5±1.18
Tabletb 99.3±0.139
Liquidc 101.9
±0.58
a= product number-1
b= product number-2
c= product number-3, SD = standard deviation
[image:13.612.34.580.590.700.2]https://doi.org/10.1371/journal.pone.0216039.t004
Table 5. Stability of glucosamine stored at 4˚C and room temperature up to 48 hours.
Mean % of glucosamine hydrochloride remaining after each timepoint (SD)
Mean % of glucosamine sulphate remaining after each timepoint (SD)
Time (hours)
Storage Temperature 4˚C Room Temperature 4˚C Room Temperature
2 99.9% (0.99) 99.7% (0.16) 102.0% (0.79) 99.5% (0.26)
12 100.7% (0.39) 100.4% (0.30) 100.0% (0.94) 100.1% (1.02)
24 99.6% (1.03) 102.9% (0.91) 100.2% (0.25) 100.3% (0.42)
36 99.4% (1.28) 99.2% (0.55) 100.9% (1.9) 100.1% (1.2)
48 100.2% (0.53) 100.5% (0.75)) 101.9% (1.3) 100.1% (1.0)
Therefore, it is not uncommon to prepare and store the samples for a few days before analysis. In some cases, all the samples (for example, 100 samples) are prepared at once and kept for analysis in HPLC autosampler. If the runtime is 10 minutes, then the difference in the analysis time between the first and the last sample could be approximately 1000 minutes (16 hours). Therefore, change in the concentration, if there is any, could be either due to the degradation of the samples kept in the autosampler or could be due to the difference in the labelled amount and the actual amount of active ingredient present. Hence, to avoid such probability samples were stored for up to 48 hours. The results indicated that glucosamine was stable when kept at two different temperatures for 48 hours allowing the possibility of storing the samples before HPLC analysis.
Method application
The newly-developed method was used to analyse 12 different glucosamine supplements con-taining either glucosamine hydrochloride or glucosamine sulphate with or without chondroi-tin sulphate. United States Pharmacopoeia/National Formulary suggests that the amount of
glucosamine should not be less or more than 10% of the labelled amount of glucosamine [44].
The amount of glucosamine present in all the six tested supplements (100%) available in
Aus-tralia was found to be within the limit of±5%, and only three out of six tested supplements
(50%) available in India were found to be within the limit of±10% of what was claimed on the
label, while 50% of the tested Indian supplements contained less than 86% of the labelled
amount of glucosamine (Table 6).
Glucosamine supplements are monitored under less stringent regulations than pharmaceu-tical products, although health agencies expect manufacturers to follow the Good
Manufactur-ing Practice durManufactur-ing the production of glucosamine dietary supplements [45]. This would also
involve quantification testing to confirm that the finished product contains the declared amount of glucosamine.
One of the problems associated with routine analysis of glucosamine supplements through quality control in pharmaceutical industry is the lack of an easy and simple analytical method. Glucosamine possesses little UV chromophore and therefore CAD becomes the primary
Table 6. Labelled and average amount of glucosamine observed in commercial preparations.
Product number Formulation Claimed Amount Observed amount of glucosamine±SD Observed %glucosamine±SD
a Capsule� 750 mg 821.2±58.3 105.6±1.65
b Tablet� 1500 mg 1444.4±70.6 96.2±4.7
c Liquid� 1500 mg 1455±18.3 97.9±1.74
d Tablet� 750 mg 795.5±18.1 106.07±2.42
e Capsule� 1000 mg 1060.2±24.8 106.02±2.48
f Tablet� 1500 mg 1572.1±17.3 104.8±1.15
g Tablet�� 750 mg 649.8±17.7 84.4±0.92
h Tablet�� 750 mg 757.1±12.8 100.9±1.70
i Tablet�� 500 mg 509.2±8.45 101.8±1.69
69
j Tablet�� 1500 mg 1288.5±4.67 85.9±0.31
k Tablet�� 750 mg 631.5±9.32 84.2±1.24
l Tablet�� 750 mg 735.8±8.35 98.1±1.11
�= Australian Brand
��= Indian Brand
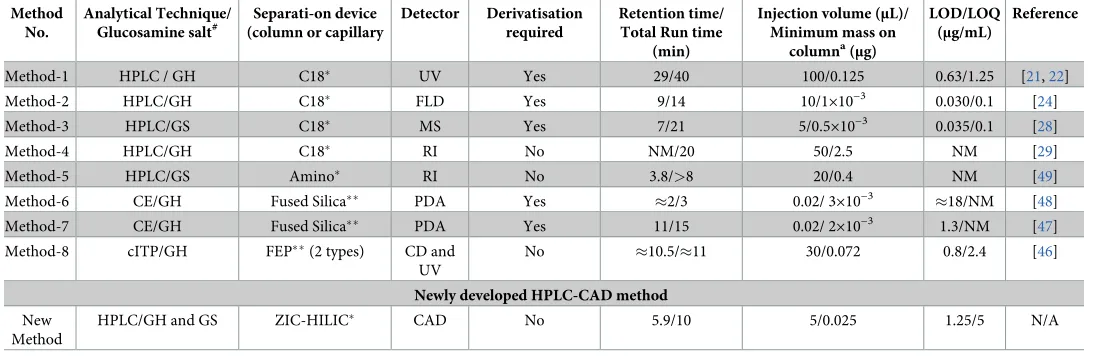
choice of detection. Unlike UV or photo diode-array (PDA) detector (method-1, 6, 7 and 8,
Table 7) [21,22,46–48], the advantage of CAD is that the detection of an analyte does not depend on a UV chromophore but rather the mass of an analyte. Also, the limit of glucosamine detection with the current method was found to be 5 times greater than the previously
reported method requiring derivatisation of glucosamine (method-1,Table 7) [21,22]. In
addition, unlike FLD (method 2,Table 7) [24], the use of CAD did not require
pre-derivatisa-tion of glucosamine. Unlike reversed phase columns employed in a previously reported
method (method 3,Table 7) [28], ZIC-HILIC did not require pre-derivatisation of polar
glu-cosamine to improve the retention time [49]. Derivatisation of glucosamine is not required
when RI detector is used (method 4 and 5,Table 7). However, unlike RI detection, CAD is
compatible with a wide range of organic modifiers and solvents. In addition, the limit of glu-cosamine detection was found to be 100 and 8 times greater than the previously reported
HPLC-RI methods [29,49]. The newly-developed method uses a small injection volume and
therefore avoids problems associated with detector and column overload [50,51]. Capillary
isotachophoresis (cITP) coupled with conductivity detector (CD) was used to analyse
underi-vatised glucosamine and chondroitin in dietary supplements (method 8,Table 7) [46]. For the
effective separation of glucosamine, an acidic pH (pH = 4.7) using two different electrolytes must be maintained. For example, a decrease in electrolyte pH by 0.2 could result in coelution with glucosamine of other components, such as taste-masking agents like acesulfame potas-sium, and hydrolysed collagen. In addition, an increase in electrolyte pH would decrease the electrophoretic mobility of glucosamine along the capillary, resulting in increased elution time. On the other hand, with the newly-developed method, less than 2% RSD for peak areas of glucosamine was observed when the pH of mobile phase was changed from 6.57 to either Table 7. Comparison of currently available methods for quantification of glucosamine with newly developed method.
Method No.
Analytical Technique/ Glucosamine salt#
Separati-on device (column or capillary
Detector Derivatisation required
Retention time/ Total Run time
(min)
Injection volume (μL)/ Minimum mass on
columna(
μg)
LOD/LOQ (μg/mL)
Reference
Method-1 HPLC / GH C18� UV Yes 29/40 100/0.125 0.63/1.25 [21,22]
Method-2 HPLC/GH C18� FLD Yes 9/14 10/1×10−3
0.030/0.1 [24]
Method-3 HPLC/GS C18� MS Yes 7/21 5/0.5×10−3 0.035/0.1 [28]
Method-4 HPLC/GH C18� RI No NM/20 50/2.5 NM [29]
Method-5 HPLC/GS Amino� RI No 3.8/>8 20/0.4 NM [49]
Method-6 CE/GH Fused Silica�� PDA Yes �2/3 0.02/ 3×10⁻³
�18/NM [48]
Method-7 CE/GH Fused Silica�� PDA Yes 11/15 0.02/ 2×10⁻³ 1.3/NM [47]
Method-8 cITP/GH FEP��(2 types) CD and
UV
No �10.5/�11 30/0.072 0.8/2.4 [46]
Newly developed HPLC-CAD method
New Method
HPLC/GH and GS ZIC-HILIC� CAD No 5.9/10 5/0.025 1.25/5 N/A
LOD = Limit of detection; LOQ = Limit of quantitation; HPLC = High performance liquid chromatography; GH = Glucosamine hydrochloride; GS = Glucosamine sulphate; CE = Capillary electrophoresis; cITP = Capillary isotachophoresis; UV = Ultra-violet; FLD = Fluorescence detector; MS = Mass spectrometry; RI = Refractive Index; PDA = Photo diode array detector; CD = Conductivity detector; CAD = Charged aerosol detector; Y = Yes; N = No; FEP = Fluorinated ethylene propylene; ZIC-HILIC = Zwitterion hydrophilic interaction liquid chromatography
#= Glucosamine salt used for method development
�= Column
��= Capillary; NM = Not mentioned in the reference
a= Minimum mass
(μg)on column is the minimum quantifiable mass injected onto the column and calculated using equation-Injection volume (μL) × LOQ or minimal concentration of standard curve of glucosamine (μg/μL); N/A = Not applicable
6.27 or 6.87, and no interference from other components was observed within this pH range. Both CAD and MS show comparable sensitivity in HILIC mode; however, unlike the MS
detector, CAD does not require ionisation for detection [52], nor is any special training
required to operate the instrument. It is also economical to use [53].
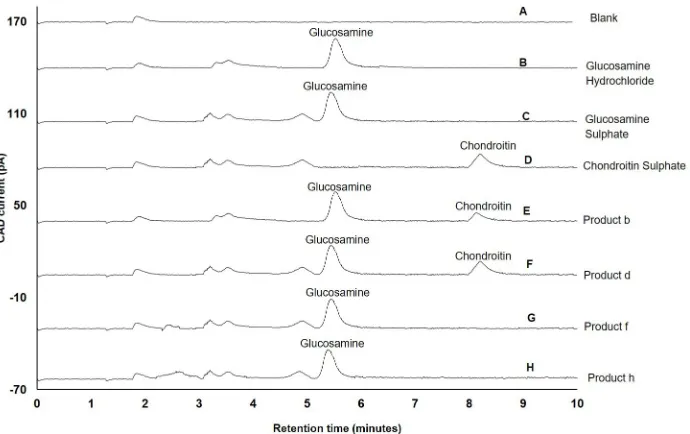
In addition, other advantages offered by newly-developed method are a) glucosamine can
be separated within 6 minutes, b) glucosamine can be separated from its two salt forms (Fig 5B
and 5C) used in clinical practice, and c) glucosamine can be separated from other amino sug-ars, such as chondroitin sulphate, that are commonly present in glucosamine dietary
supple-ments (Fig 5E and 5F). Apart from chondroitin sulphate, other ingredients present in
glucosamine dietary supplements included 140 mg (product a) or 250 mg (product h and k) of methylsulphonylmethane (MSM), 500 mg Zingiber officinale or ginger and 2.5 mg gingerols
(product f) and 50 mg of diacerein (product h), (please refer toTable 1).
In the current study, water was employed for the extraction of highly polar glucosamine from dietary supplements. Other ingredients present in dietary supplements in decreasing
order of their water solubility were chondroitin sulphate>MSM>ginger or gingerols>
dia-cerein [54–57]. Gingerols and diacerein are highly lipophilic, water insoluble and required to
be dissolved in an inorganic solvent for extraction [56,57]. Therefore, it is likely that during
the extraction process diacerein and gingerols were precipitated and removed during filtration. Due to the degree of hydrophilic nature of chondroitin, MSM and certain water soluble
com-ponents (phenolic, carbohydrates and soluble fibre) in ginger [58,59] would have dissolved in
[image:16.612.204.549.76.293.2]the volume of water used for the extraction of glucosamine. However, no coeluting peaks of water-soluble ingredients with glucosamine peak were observed when product-a, f, h and k Fig 5. Application of newly-developed method for separation of glucosamine present in supplements. A) Blank (water); B) Glucosamine hydrochloride reference standard; C) Glucosamine sulphate reference standard; D) Chondroitin sulphate reference standard; E) Product-b containing glucosamine 1500 mg of glucosamine
hydrochloride with chondroitin (100 mg) F) Product-d containing 750 mg of glucosamine sulphate with chondroitin (421 mg); G) Product-f containing glucosamine sulphate-sodium chloride complex (1.88 mg) equivalent to 1500 mg of glucosamine sulphate with 500 mg Zingiber officinale or ginger equivalent to 2.5 mg gingerols; H) Product-h containing 750 mg of glucosamine sulphate-potassium chloride complex, equivalent to 446 mg of glucosamine with 250 mg of methylsulphonylmethane and 50 mg of diacerin; Experimental conditions: ZIC-HILIC column (150, 4.6 mm), 200Å, 5μm; mobile phase containing 60% acetonitrile and 85 mM ammonium acetate; column temperature 40˚C; detection with Corona-CAD; flow rate 0.3 mL/min; injection volume 5μL.
were analysed. The chromatograms of product f (comprising ginger/gingerols) and product-h
(comprising MSM and diacerein) are shown inFig 5G and 5H.
There are two limitations of the current study. First, the moisture content was not taken into account during the sample preparation step; however, this criterion is not recommended
by USP as a part of routine quality control analysis of glucosamine tablets [44]. Second, the
sta-bility of glucosamine to physical forces was not investigated such as crushing during the sam-ple preparation and centrifugation. However, this criterion is not recommended by USP; on the other hand, it recommends finely powdering the tablet to prepare the glucosamine sample
for content analysis [44].
Conclusion
The method developed is simple and selective for the detection and quantification of amine. The method was successfully applied to 12 different commercially available glucos-amine supplements, with a significant reduction in the run time and increased resolution compared with previously reported analytical methods. The selectivity and simplicity of this method allows its application in manufacturing for the identification and monitoring of batch-to-batch consistency of commercially available glucosamine products.
Author Contributions
Investigation: Chhavi Asthana.
Supervision: Gregory M. Peterson, Madhur Shastri, Rahul P. Patel.
Validation: Chhavi Asthana.
Writing – original draft: Chhavi Asthana.
Writing – review & editing: Chhavi Asthana, Gregory M. Peterson, Madhur Shastri, Rahul P. Patel.
References
1. Australian Institute of health and welfare. Osteoarthritis snapshot 2018 [Available from:https://www. aihw.gov.au/reports/chronic-musculoskeletal-conditions/osteoarthritis/contents/what-is-osteoarthritis.
2. Hamann N, Zaucke F, Dayakli M, Bru¨ggemann G-P, Niehoff A. Growth-related structural, biochemical, and mechanical properties of the functional bone-cartilage unit. J Anat. 2013; 222(2):248–59.https:// doi.org/10.1111/joa.12003PMID:23083449
3. Ali AA, Lewis SM, Badgley HL, Allaben WT, Leakey JE. Oral glucosamine increases expression of transforming growth factor beta1 (TGFbeta1) and connective tissue growth factor (CTGF) mRNA in rat cartilage and kidney: implications for human efficacy and toxicity. Arch Biochem Biophys. 2011; 510 (1):11–8.https://doi.org/10.1016/j.abb.2011.03.014PMID:21466783
4. Lapane KL, Sands MR, Yang S, McAlindon TE, Eaton CB. Use of complementary and alternative medi-cine among patients with radiographic-confirmed knee osteoarthritis. Osteoarthritis Cartilage. 2012; 20:22–8.https://doi.org/10.1016/j.joca.2011.10.005PMID:22033041
5. Hopman WM, Towheed TE, Gao Y, Berger C, Joseph L, Vik SA, et al. Prevalence of and factors associ-ated with glucosamine use in Canada. Osteoarthritis Cartilage. 2006; 14(12):1288–93.https://doi.org/ 10.1016/j.joca.2006.06.003PMID:16831560
6. Galvin R, Cousins G, Boland F, Motterlini N, Bennett K, Fahey T. Prescribing patterns of glucosamine in an older population: a national cohort study. BMC Complement Altern Med. 2013; 13(1):316.
7. Seo H-J, Sung Y-K, Choi C-B, Lee EB, Cheong C, Kim SY, et al. Prevalence and factors affecting glu-cosamine use in Korea: a survey-based study. Rheumatol Int. 2013; 33(6):1627–31.https://doi.org/10. 1007/s00296-011-2288-xPMID:22200808
9. Sancheti P, Shetty VD, Dhillon MS, Sprague SA, Bhandari M. India-Based Knee Osteoarthritis Evalua-tion (iKare): A Multi-Centre Cross-SecEvalua-tional Study on the Management of Knee Pain and Early Osteoar-thritis in India. Clin Orthop Surg. 2017; 9(3):286–94.https://doi.org/10.4055/cios.2017.9.3.286PMID:
28861195
10. Sibbritt D, Adams J, Lui CW, Broom A, Wardle J. Who uses glucosamine and why? A study of 266,848 Australians aged 45 years and older. PloS one. 2012; 7(7):e41540.https://doi.org/10.1371/journal. pone.0041540PMID:22859995
11. Giordano N, Fioravanti A, Papakostas P, Montella A, Giorgi G, Nuti R. The efficacy and tolerability of glucosamine sulfate in the treatment of knee osteoarthritis: A randomized, double-blind, placebo-con-trolled trial. Curr Ther Res Clin Exp. 2009; 70(3):185–96.https://doi.org/10.1016/j.curtheres.2009.05. 004PMID:24683229
12. Fransen M, Agaliotis M, Nairn L, Votrubec M, Bridgett L, Su S, et al. Glucosamine and chondroitin for knee osteoarthritis: a double-blind randomised placebo-controlled clinical trial evaluating single and combination regimens. Ann Rheum Dis. 2015; 74(5):851–8. https://doi.org/10.1136/annrheumdis-2013-203954PMID:24395557
13. Sawitzke AD, Shi H, Finco MF, Dunlop DD, Harris CL, Singer NG, et al. Clinical efficacy and safety of glucosamine, chondroitin sulphate, their combination, celecoxib or placebo taken to treat osteoarthritis of the knee: 2-year results from GAIT. Ann Rheum Dis. 2010; 69(8):1459–64.https://doi.org/10.1136/ ard.2009.120469PMID:20525840
14. Kwoh CK, Roemer FW, Hannon MJ, Moore CE, Jakicic JM, Guermazi A, et al. Effect of Oral Glucos-amine on Joint Structure in Individuals With Chronic Knee Pain: A Randomized, Placebo-Controlled Clinical Trial. Arthritis Rheumatol. 2014; 66(4):930–9.https://doi.org/10.1002/art.38314PMID:
24616448
15. Wilkens P, Scheel IB, Grundnes O, Hellum C, Storheim K. Effect of Glucosamine on Pain-Related Dis-ability in Patients With Chronic Low Back Pain and Degenerative Lumbar Osteoarthritis. JAMA. 2010; 304(1):45–52.https://doi.org/10.1001/jama.2010.893PMID:20606148
16. Reginster JY, Deroisy R, Rovati LC, Lee RL, Lejeune E, Bruyere O, et al. Long-term effects of glucos-amine sulphate on osteoarthritis progression: a randomised, placebo-controlled clinical trial. Lancet. 2001; 357:251–6.https://doi.org/10.1016/S0140-6736(00)03610-2PMID:11214126
17. Pavelka K, Gatterova J, Olejarova M, Machacek S, Giacovelli G, Rovati LC. Glucosamine sulfate use and delay of progression of knee osteoarthritis: a 3-year, randomized, placebo-controlled, double-blind study. Archives of internal medicine. 2002; 162(18):2113–23. PMID:12374520
18. Martel-Pelletier J, Roubille C, Abram F, Hochberg MC, Dorais M, Delorme P, et al. First-line analysis of the effects of treatment on progression of structural changes in knee osteoarthritis over 24 months: data from the osteoarthritis initiative progression cohort. Ann Rheum Dis. 2015; 74(3):547–56.https://doi. org/10.1136/annrheumdis-2013-203906PMID:24336337
19. Rindone JP, Hiller D, Collacott E, Nordhaugen N, Arriola G. Randomized, controlled trial of glucosamine for treating osteoarthritis of the knee. The Western journal of medicine. 2000; 172(2):91–4. PMID:
10693368
20. McAlindon T, Formica M, LaValley M, Lehmer M, Kabbara K. Effectiveness of glucosamine for symp-toms of knee osteoarthritis: Results from an internet-based randomized double-blind controlled trial. Am J Med. 2004; 117(9):643–9.https://doi.org/10.1016/j.amjmed.2004.06.023PMID:15501201
21. Russell AS, Aghazadeh-Habashi A, Jamali F. Active ingredient consistency of commercially available glucosamine sulfate products. J Rheumatol. 2002; 29(11):2407–9. PMID:12415601
22. Aghazadeh-Habashi A, Sattari S, Pasutto F, Jamali F. High performance liquid chromatographic deter-mination of glucosamine in rat plasma. J Pharm Pharmaceut Sci. 2002; 5(2):176–80.
23. Zhang LJ, Huang TM, Fang XL, Li XN, Wang QS, Zhang ZW, et al. Determination of glucosamine sul-fate in human plasma by precolumn derivatization using high performance liquid chromatography with fluorescence detection: its application to a bioequivalence study. J Chromatogr B Analyt Technol Biomed Life Sci. 2006; 842(1):8–12.https://doi.org/10.1016/j.jchromb.2006.04.045PMID:16740419 24. Wang X, Chen X, Chen L, Wang B, Peng C, He C, et al. Optimizing high-performance liquid
chromatog-raphy method for quantification of glucosamine using 6-aminoquinolyl-N-hydroxysuccinimidyl carba-mate derivatization in rat plasma: application to a pharmacokinetic study. Biomedical chromatography: BMC. 2008; 22(11):1265–71.https://doi.org/10.1002/bmc.1056PMID:18814196
25. Lochmann D, Stadlhofer S, Weyermann J, Zimmer A. New protamine quantification method in microtiter plates using o-phthaldialdehyde/N-acetyl-L-cysteine reagent. Int J Pharm. 2004; 283(1):11–7.
27. Karlsson G, Winge S, Sandberg H. Separation of monosaccharides by hydrophilic interaction chroma-tography with evaporative light scattering detection. J Chromatogr A. 2005; 1092(2):246–9.https://doi. org/10.1016/j.chroma.2005.08.025PMID:16199233
28. Huang TM, Cai L, Yang B, Zhou MX, Shen YF, Duan GL. Liquid chromatography with electrospray ioni-zation mass spectrometry method for the assay of glucosamine sulfate in human plasma: validation and application to a pharmacokinetic study. Biomedical chromatography: BMC. 2006; 20(3):251–6.
https://doi.org/10.1002/bmc.558PMID:16145658
29. Way WK, Gibson KG, Breite AG. Determination of glucosamine in nutritional supplements by reversed-phase ion-pairing HPLC. J Liq Chromatogr Relat Technol. 2000; 23(18):2861–71.
30. Gallagher B, Tjoumakaris FP, Harwood MI, Good RP, Ciccotti MG, Freedman KB. Chondroprotection and the Prevention of Osteoarthritis Progression of the Knee: A Systematic Review of Treatment Agents. Am J Sports Med. 2014.
31. The United States Pharmacopeia: USP 35: the National Formulary: NF 30: by authority of the United States Pharmacopeial Convention Inc. Rockville. General Chapter<621>Chromatography2012.
32. Shabir GA. Validation of high-performance liquid chromatography methods for pharmaceutical analysis: Understanding the differences and similarities between validation requirements of the US Food and Drug Administration, the US Pharmacopeia and the International Conference on Harmonization. J Chromatogr A. 2003; 987(1):57–66.
33. Green JM. Peer Reviewed: A Practical Guide to Analytical Method Validation. Anal Chem. 1996; 68 (9):305A–9A.
34. International Conference on Harmonization Guideline, editor Validation of analytical procedures: text and methodology Q2 (R1). International Conference on Harmonization, Geneva, Switzerland; 2005.
35. The United States Pharmacopeia: USP 29: the National Formulary: NF 24: by authority of The United States Pharmacopeial Convention meeting at Washington D C. Weight variatiion of dietary supple-ments: Rockville, MD.: United States Pharmacopeial Convention.; 2005. 3092–3 p.
36. SeQuant ZIC-pHILIC HPLC Column- General Instructions for Care and Use 2015 [Available from:
http://www.merckmillipore.com/INTERSHOP/web/WFS/Merck-AU-Site/en_US/-/USD/ ShowDocument-Pronet?id= 201301.003.
37. Keppel TR, Jacques ME, Weis DD. The use of acetone as a substitute for acetonitrile in analysis of pep-tides by liquid chromatography/electrospray ionization mass spectrometry. Rapid Commun Mass Spec-trom. 2010; 24(1):6–10.https://doi.org/10.1002/rcm.4352PMID:19957295
38. Swartz M, Emanuele M, Awad A, Grenier A, Hartley D. An Overview of Corona Charged Aerosol Detec-tion in Pharmaceutical Analysis: Synomics Pharma, White Paper; 2009 [Available from:http://images.
alfresco.advanstar.com/alfresco_images/pharma/2014/08/21/6a477436-ba6f-4716-9d67-ebc7e3196fa8/article-636147.pdf.
39. Hao Z, Xiao B, Weng N. Impact of column temperature and mobile phase components on selectivity of hydrophilic interaction chromatography (HILIC). J Sep Sci. 2008; 31(9):1449–64.https://doi.org/10. 1002/jssc.200700624PMID:18435508
40. Sentkowska A, Biesaga M, Pyrzynska K. Effects of the operation parameters on HILIC separation of fla-vonoids on zwitterionic column. Talanta. 2013; 115:284–90.https://doi.org/10.1016/j.talanta.2013.05. 005PMID:24054593
41. Rathore N, Rajan RS. Current Perspectives on Stability of Protein Drug Products during Formulation, Fill and Finish Operations. Biotechnol Prog. 2008; 24(3):504–14.https://doi.org/10.1021/bp070462h
PMID:18484778
42. Lei M, Hewitt D, Cornell C, Skidmore K, Kao YH, Sugahara J, et al. The effects of membrane filters used in biopharmaceutical processes on the concentration and composition of polysorbate 20. Biotech-nol Prog. 2013; 29(6):1503–11.https://doi.org/10.1002/btpr.1824PMID:24124005
43. Liu L, Randolph TW, Carpenter JF. Particles shed from syringe filters and their effects on agitation-induced protein aggregation. J Pharm Sci. 2012; 101(8):2952–9.https://doi.org/10.1002/jps.23225
PMID:22674153
44. The United States Pharmacopeia: USP 29: the National Formulary: NF 24: by authority of The United States Pharmacopeial Convention meeting at Washington D C. Glucosamine Tablets: Rockville, Md.: United States Pharmacopeial Convention.; 2005. 2343–4 p.
45. Therapeutics Goods Administration. Quality of listed complementary medicines, Australian regulatory guidelines for complementary medicines (ARGCM), Version 6.0 2016 2016 [Available from:https:// www.tga.gov.au/book-page/2-finished-product-specifications-certificate-analysis.
47. Akamatsu S, Mitsuhashi T. Development of a simple capillary electrophoretic determination of glucos-amine in nutritional supplements using in-capillary derivatisation with o-phthalaldehyde. Food Chem. 2012; 130(4):1137–41.
48. Chen JJ, Lee YC, Cheng TJ, Hsiao HY, Chen RLC. Determination of glucosamine content in nutraceuti-cals by capillary electrophoresis using in-capillary OPA labeling techniques. J Food Drug Anal. 2006; 14 (2):203–6.
49. El-Saharty YS, Bary AA. High-performance liquid chromatographic determination of neutraceuticals, glucosamine sulphate and chitosan, in raw materials and dosage forms. Anal Chim Acta. 2002; 462 (1):125–31.
50. Dolan JW. Overload in Liquid Chromatography. LC GC N Am. 2015; 33(8):528–33.
51. Buckenmaier SMC, McCalley DV, Euerby MR. Overloading Study of Bases Using Polymeric RP-HPLC Columns as an Aid to Rationalization of Overloading on Silica-ODS Phases. Anal Chem. 2002; 74 (18):4672–81. PMID:12349969
52. Mitchell CR, Bao Y, Benz NJ, Zhang S. Comparison of the sensitivity of evaporative universal detectors and LC/MS in the HILIC and the reversed-phase HPLC modes. J Chromatogr B. 2009; 877(32): 4133–9.
53. Vervoort N, Daemen D, To¨ro¨k G. Performance evaluation of evaporative light scattering detection and charged aerosol detection in reversed phase liquid chromatography. J Chromatogr A. 2008; 1189(1– 2):92–100.https://doi.org/10.1016/j.chroma.2007.10.111PMID:18054946
54. Avachat A, Kotwal V. Design and evaluation of matrix-based controlled release tablets of diclofenac sodium and chondroitin sulphate. AAPS PharmSciTech. 2007; 8(4):51–6.
55. Herschler RJ. Methylsulfonylmethane and methods of use. Google Patents; 1981.
56. Aeschbach R, Lo¨liger J, Scott B, Murcia A, Butler J, Halliwell B, et al. Antioxidant actions of thymol, car-vacrol, 6-gingerol, zingerone and hydroxytyrosol. Food and chemical toxicology: an international journal published for the British Industrial Biological Research Association. 1994; 32(1):31–6.
57. Aggarwal AK, Singh S. Physicochemical characterization and dissolution study of solid dispersions of diacerein with polyethylene glycol 6000. Drug Dev Ind Pharm. 2011; 37(10):1181–91.https://doi.org/10. 3109/03639045.2011.563782PMID:21449824
58. Simon-Brown K, Solval KM, Chotiko A, Alfaro L, Reyes V, Liu C, et al. Microencapsulation of ginger (Zingiber officinale) extract by spray drying technology. LWT-Food Sci Technol. 2016; 70:119–25.