Received January 16, 2018, accepted February 22, 2018, date of publication March 19, 2018, date of current version April 4, 2018. Digital Object Identifier 10.1109/ACCESS.2018.2817022
A Data-Driven Knowledge Acquisition System:
An End-to-End Knowledge Engineering Process
for Generating Production Rules
MAQBOOL ALI 1,2, RAHMAN ALI3, WAJAHAT ALI KHAN1, SOYEON CAREN HAN4, JAEHUN BANG1, TAEHO HUR1, DOHYEONG KIM1, SUNGYOUNG LEE1, (Member, IEEE), AND BYEONG HO KANG2
1Department of Computer Science and Engineering, Kyung Hee University, Yongin 446-701, South Korea 2School of Engineering and ICT, University of Tasmania, Hobart, TAS 7005, Australia
3Quaid-e-Azam College of Commerce, University of Peshawar, Peshawar 25120, Pakistan 4School of Information Technologies, The University of Sydney, Sydney, NSW 2006, Australia
Corresponding author: Sungyoung Lee ([email protected])
This work was supported in part by the Ministry of Science and ICT, South Korea, under the Information Technology Research Center Support Program supervised by the Institute for Information and Communications Technology Promotion (IITP) under Grant
IITP-2017-0-01629, in part by IITP Grant through the Korean government (MSIT) under Grant 2017-0-00655, and in part by the Industrial Core Technology Development Program (Develop of mining core technology exploiting personal big data) through the Ministry of Trade, Industry and Energy, South Korea, under Grant 10049079.
ABSTRACT Data-driven knowledge acquisition is one of the key research fields in data mining. Dealing with large amounts of data has received a lot of attention in the field recently, and a number of methodologies have been proposed to extract insights from data in an automated or semi-automated manner. However, these methodologies generally target a specific aspect of the data mining process, such as data acquisition, data preprocessing, or data classification. However, a comprehensive knowledge acquisition method is crucial to support the end-to-end knowledge engineering process. In this paper, we introduce a knowledge acquisition system that covers all major phases of the cross-industry standard process for data mining. Acknowledging the importance of an end-to-end knowledge engineering process, we designed and developed an easy-to-use data-driven knowledge acquisition tool (DDKAT). The major features of the DDKAT are: (1) a novel unified features scoring approach for data selection; (2) a user-friendly data processing interface to improve the quality of the raw data; (3) an appropriate decision tree algorithm selection approach to build a classification model; and (4) the generation of production rules from various decision tree classification models in an automated manner. Furthermore, two diabetes studies were performed to assess the value of the DDKAT in terms of user experience. A total of 19 experts were involved in the first study and 102 students in the artificial intelligence domain were involved in the second study. The results showed that the overall user experience of the DDKAT was positive in terms of its attractiveness, as well as its pragmatic and hedonic quality factors.
INDEX TERMS
Knowledge engineering, data mining, features ranking, algorithm selection, decision tree, production rule, user experience.
I. INTRODUCTION
Knowledge systems have come a long way, from manual knowledge curation to automatic data-driven knowledge gen-eration. The major drivers of this transition were the size and complexity of data. Since large datasets cannot be efficiently analyzed manually, the automation process is essential [2].
Initially in this process of knowledge automation, knowl-edge engineers followed ad-hoc procedures [3]. Later on, more systematic methodologies were devised, which can be referred to as data-driven knowledge acquisition systems.
Knowledge extraction from structured sources such as databases is an active area of research in the information
VOLUME 6, 2018
2169-35362018 IEEE. Translations and content mining are permitted for academic research only.
systems community. To extract hidden knowledge or gain insights from structured or unstructured data, data sci-ence (DS) was created, supporting both automatic and semi-automatic data analysis [4]. Data science is similar to Knowledge Discovery in Databases and is intricately linked to data-driven decision-making concepts [5]. It employs tech-niques and theories drawn from many fields such as data mining (DM), machine learning, cluster analysis, classifi-cation, visualization, and databases [6]. Data mining plays an important role in exploring hidden patterns in data, lead-ing to insights that can be used to design decision support systems [7].
The CRoss-Industry Standard Process for Data Mining (CRISP-DM) is a widely used systematic methodology for DM and DS system development. According to a poll con-ducted in 2014, CRISP-DM was regarded as the leading methodology for data science projects, data mining, and ana-lytics [8]. CRISP-DM consists of six well-defined phases: business understanding, data understanding, data preparation, modeling, evaluation, and deployment [9]. The major goal of developing CRISP-DM was to establish a data mining methodology and process model for end-to-end application execution. In this study, a data-driven knowledge acquisi-tion system that covers all major phases of CRISP-DM is introduced to explain the end-to-end knowledge engineering process.
The data understanding phase of the data mining process involves collecting the data as well as inspecting it closely, which is crucial for the next phase, data preparation. In a dataset, instances represent data entities, which are further characterized by their properties. These properties can also be referred to as features or attributes, and they help to understand the characteristics of the data. Feature selection plays a crucial role in the procedure of ‘knowledge discov-ery’ [10]. Generally, a feature selection method evaluates the usefulness of the attributes (i.e., features) present in the dataset; a ranking methodology is considered the optimal way to score such features [11]. A substantial amount of research has been devoted to improving feature selection method-ologies [11]–[15]. However, less attention is given to the development of a unified and comprehensive methodology for feature ranking. This study proposes an innovative feature ranking methodology called Unified Features Scoring (UFS). The primary ambition of UFS is to evaluate the feature set in a comprehensive manner dependent on several different fea-ture selection measures, namely information gain (IG), gain ratio (GR), symmetric uncertainty (SU), chi-square (CS), and significance [12], [16]–[18]. UFS is a consensus methodol-ogy that assists the domain expert in selecting informative features for the data preparation phase of CRISP-DM.
Once a feature set is selected from a dataset and the data preparation phase is completed, a modeling phase (i.e. data classification) is initiated. Data classification is one of the most important data mining functions, and employs a number of features to predict a target variable [19] and produce a decision tree model. In the field of data mining, decision
trees are one of the most well-known data classification methods for the representation of inductive knowledge [20]. However, the manual selection of an appropriate classifier (i.e., machine learning algorithm) from the available decision tree classifiers is a time-consuming exercise. To mitigate this, we adopted an accurate multi-criteria decision-making (AMD) methodology [21] to choose an appropriate classification algorithm for generating production rules.
Acknowledging the importance of an end-to-end knowl-edge engineering process, we designed and developed an easy-to-use data-driven knowledge acquisition tool (DDKAT) to provide a data mining utility for both expert and non-expert data miners. An up-to-date version of this tool and its documentation can be downloaded from the GitHub open-source platform [1], [22]. This study is both an extension and a detailed study of previous work [23], [24]. The DDKAT is a web-based application that acquires health and wellness knowledge and shares the acquired knowledge in the form of production rules. All of the major phases of CRISP-DM are implemented and explained using a diabetes dataset as a case study (see SectionVI-B). The DDKAT was designed for a UCLab1project called Mining Minds (MM); however, other platforms can also utilize this tool for comprehensive knowledge acquisition purposes. Mining Minds2 provides personalized services to users to improve their quality of life (see SectionIII-Afor more details). The major features of the DDKAT are the novel UFS methodology for data selection, easy-to-perform data preprocessing, integration of an AMD methodology for appropriate classifier selection, decision tree generation, and the translation of decision trees into production rules to share using an expert-driven approach.
The motivation behind the DDKAT is to generate produc-tion rules in a comprehensive manner and to support the end-to-end knowledge engineering process. In order to achieve these goals, this study was undertaken with the following objectives:
1) To select suitable parameters from structured data to assist the domain expert in selecting informative fea-tures for the task at hand.
2) To select an appropriate decision tree algorithm for the creation of a classification model.
3) To generate production rules from various decision tree classification models in an automatic manner.
4) To design and develop an easy-to-use online web-based application for implementing the major phases of CRISP-DM.
The key contributions of this research are: (1) the UFS methodology for selecting suitable parameters (see Section III-D1), (2) Integration of an AMD methodology for selecting an appropriate decision tree algorithm (see SectionIII-F1), (3) an automatic mechanism for generating production rules from various decision tree classification
1Ubiquitous Computing Lab., Kyung Hee University, Yongin
http://uclab.khu.ac.kr
models (see SectionIII-F2), and (4) the data-driven knowl-edge acquisition tool (see SectionVI-A).
The following are the highlights of this research:
1) This study introduces a knowledge acquisition system that covers all major phases of the CRISP-DM frame-work to provide a data mining utility for both expert and non-expert data miners.
2) We designed and developed an easy-to-use web-based data-driven knowledge acquisition tool for extracting shareable production rules from a dataset in a compre-hensive manner to explain the end-to-end knowledge engineering process.
3) The DDKAT uses an innovative feature ranking methodology called Unified Features Scoring to com-prehensively evaluate the feature set and assist the domain expert in selecting informative features for the data preparation phase of CRISP-DM.
4) The DDKAT uses an accurate multi-criteria decision-making (AMD) methodology to choose an appropriate decision tree classification algorithm.
5) The DDKAT uses an automatic approach to generate production rules from various decision tree classifica-tion models.
6) Two case studies were performed on a diabetes dataset to evaluate the DDKAT in terms of user experience. 7) Overall, the user experience of the DDKAT was
pos-itive with respect to its attractiveness as well as its pragmatic and hedonic quality factors.
The study is organized as follows. Section II describes related works, and SectionIIIpresents the architecture of the proposed system, functional mapping from the DDKAT to the phases of CRISP-DM, and detailed methodologies for the data understanding, data preparation, and modeling phases. Section IVpresents the results obtained in the data under-standing and data preparation phases. Section V evaluates the proposed system. SectionVIpresents an overview of the DDKAT and describes the case study of a diabetes dataset to explain the phases of CRISP-DM. Section VIIdiscusses the significance, challenges, and limitations of this study. Finally, SectionVIIIconcludes the paper with a summary of the research findings and future directions.
II. RELATED WORKS
This research addresses important aspects of the data science process. This section briefly deals with: (1) DS background and the CRISP-DM methodology, (2) methodological studies of feature selection approaches used in the data understanding phase, (3) a discussion about knowledge representation and transformation techniques that require it, and (4) the overall limitations of existing systems.
The term DS was used in the early 1960s to cover six processes [6]–problem identification, data collection, data preprocessing, data analysis, data modeling, and prod-uct evaluation–in order to extract knowledge for decision-making. Data mining is generally considered a sub-step of the DS process [6]. The main purpose of data mining techniques
is to extract non-trivial knowledge from unprocessed data. The key benefits of the DM approach are (1) rapid growth of data, (2) reduced data storage cost, and (3) less data pro-cessing time [25]. CRISP-DM, published in the year 2000, is a widely-used systematic methodology for developing DM/DS projects. It is considered the de facto standard [26] for executing a DM project systematically. Gupta [25] dis-cussed software development and CRISP-DM, two different approaches to the data mining process. In the software devel-opment approach, the data mining process includes six steps: ‘requirement analysis,’ ‘data selection and collection,’ ‘clean-ing and prepar‘clean-ing data,’ ‘data min‘clean-ing exploration and val-idation,’ ‘implementation, evaluation, and monitoring,’ and ‘results visualization.’ CRISP-DM is similar to the software development approach with the exception of steps 2, 3, and 6. The proposed knowledge acquisition system (DDKAT) includes the Unified Features Scoring methodology for selecting salient features from a dataset before the data prepa-ration phase. This methodology is based on an empirical study of different feature selection measures, including infor-mation gain and the gain ratio. The following are some of the relevant feature ranking studies from a methodological point of view. Belanche and González [11] performed a thorough study of feature selection algorithms in synthetic problems to evaluate their performance. In this study, a scoring mea-sure was devised to score the output of the feature selec-tion methods, a soluselec-tion that was considered to be optimal. Liu and Yu [27] proposed a categorizing framework to build an integrated system for automatic feature selection. This framework was based on a unifying platform and laid the important foundation for methodologically integrating differ-ent feature selection methods based on their shared charac-teristics. With respect to ensemble feature selection studies, Rokachet al. [13] investigated an ensemble approach that could enhance feature selection; however, the researchers only considered non-ranking filters. Similarly, Jonget al. [14] proposed an ensemble feature ranking methodology that inte-grated various feature rankings from the same and artificial datasets to improve the stability of feature ranking. In addi-tion, Slavkovet al. [15] conducted a study on various aggre-gation approaches of the feature rankings of public neu-roblastoma microarrays using multiple ranking algorithms and datasets. They showed that aggregating feature rankings produced favorable outcomes compared to the use of a single feature ranking method. Prati [12] also proposed a general framework for the use of ensemble feature ranking to improve the quality of feature rankings and was able to obtain bet-ter results than others. For such ensemble feature selection studies, various combinations of univariate filter methods are used in the literature, including (i) IG, GR, CS, and SU [16], [17], (ii) IG, CS, and SU [18], and (iii) IG, GR, SU, CS, and OneR [12].
literature, comprehensive knowledge representation models such as decision graphs, production rules, and decision trees are extensively used by knowledge engineers to understand the complete structure of a classification scheme [28]. Differ-ent software has been developed for conveniDiffer-ently visualizing decision tree models [28]. In one study, a micromanagement design for group formations was presented in which an XML-encoded decision tree helped agents decide the tactics of a game using simple IF-THEN rules [29]. The Waikato Envi-ronment for Knowledge Analysis (WEKA) was used to auto-mate the process of generating the decision tree. In a decision tree, a set of rules is dependent on the number of leaf nodes. All conditions encountered on the path from the root node to each leaf node are concatenated to construct production rules. The decision tree is traversed in a depth-first search (DFS) with a simple greedy solution to produce fairly good rule sets [30]. In [31], decision trees were first generated from a set of training cases, before transforming the trees from the same classification domain into production rules. The study also described the decision tree transformation technique used to construct the production rules. Platforms such as StarCraft: Brood War are available for converting decision trees into rules [29]. In addition, Holmeset al. [32] presented an algorithm that generated simple and accurate IF-THEN rules from models such as decision trees. In the literature, most decision trees are transformed using Wekatext-ToXml [29], [33], in which only J48 classifier based decision trees are converted into inter-operable XML files.
The rationale for transforming a decision tree into IF-THEN production rules is that these rules are (1) easy to understand and widely used in expert systems to represent knowledge [31], [34], (2) more compact and predictive than the decision tree from which they were generated [31], [32], and (3) used to construct a credible knowledge base from the same dataset to better support decision-making [24], [35].
Considering the above discussion and the rapid increase in data rates, it is almost impossible to extract hidden knowl-edge using manual approaches. The research community prefers to use data mining processes to resolve this problem. For the feature selection task of data mining, considerable research [11], [36] has focused on improving feature selection algorithms, yet less attention has been paid to developing a unified methodology for feature selection. In expert sys-tems, production rules are commonly used as a formalism to express knowledge, and J48 classifier based decision trees are generally used to generate rule sets from decision trees. To the best of our knowledge, there is no method to extract rule sets from multiple and different decision trees, e.g., classification and regression trees (CART).
III. MATERIALS AND METHODS
With the goal of developing an end-to-end data-driven knowl-edge acquisition system for generating production rules, this section describes (1) the Mining Minds (MM) framework, (2) our proposed system architecture and component details, (3) functional mapping of the proposed system to the phases
of CRISP-DM, and (4) detailed methodologies used for the data understanding, data preparation, and modeling phases of CRISP-DM. Each of these items is explained in the following subsections.
A. MINING MINDS FRAMEWORK OVERVIEW
The innovative person-centric framework called Mining Minds3 was proposed for promoting health and self-care management [37]. The foundation of this framework is pri-marily based on the digital health and well-being paradigms used to monitor users’ daily activities to provide healthy habit recommendations and educational facts [38]. It builds on wearables, big data, and Internet-of-things (IoT) tech-nologies to provide a personalized healthcare and wellness service.
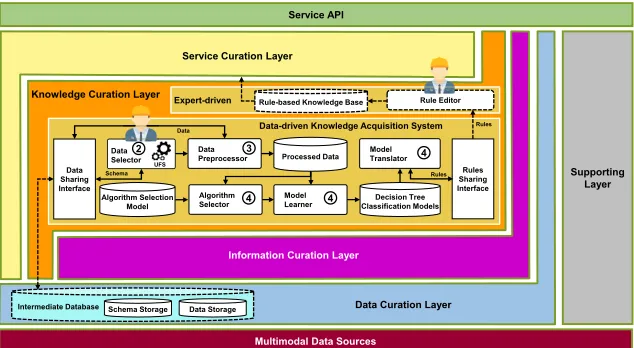
The MM framework is composed of five layers: the Data Curation Layer (DCL), Information Curation Layer (ICL), Knowledge Curation Layer (KCL), Service Curation Layer (SCL), and Supporting Layer (SL) [23], [38]. This multilayer architecture is depicted in Fig. 1 [23], and an explanation of the layers’ communication can be found in the works of Khan et al. [38]. Each layer has specific tasks. The DCL is responsible for obtaining data from the multimodal data source, processing it, and persisting the data. The ICL uses the DCL’s data to describe user context and behavior by inferring high-level and low-level person-centric information. The data persisted by DCL and the information extracted by ICL are utilized by the KCL to gradually develop health and wellness knowledge. After receiving data, information, and knowledge from the DCL, ICL, and KCL, respectively, the SCL cre-ates health and wellness services. The SCL first genercre-ates a recommendation, interprets it with respect to the context, and finally provides it to the user application. Lastly, the SL analyzes the user experience trends and provides enough data visualization capability so that experts can provide this feedback. This layer also ensures security and privacy in all components, and provides the data, information, knowledge, and services to third-party applications [37], [38].
In this study, we focus only on the KCL, especially the data-driven aspects. The main purpose of the KCL is to create and evolve the health and wellness knowledge to allow the SCL to provide a better quality of service. In the KCL, knowledge is created by either the knowledge engineer or the domain expert using data-driven or expert-driven approaches. The data-expert-driven approach generates pro-duction rules by utilizing the life-log and user profile data stored in intermediate data storage [23], [38] and shares these generated rules with experts for verification purposes. On the other hand, the expert-driven approach provides a rule-authoring environment to allow the domain experts to express a logical form consisting of causes and conclusions. In both the data-driven and expert-driven cases, the produc-tion rules are verified prior to their storage in knowledge bases.
FIGURE 1. The Mining Minds framework’s layered architecture with a data-driven operational diagram. [23], [38].
B. PROPOSED ARCHITECTURE
The scope of this study is the data-driven module of the KCL, as shown in Fig. 1; the components represented by dotted lines and their internal details are not covered in this study. This figure shows an abstract view of the end-to-end data-driven knowledge engineering process, whose work-flow is explained in the simulation section. Our proposed architecture consists of five major components, called the Data Selector, Data Preprocessor, Algorithm Selector, Model Learner, and Model Translator. In Fig. 1, each component is labelled with a number to represent the corresponding phase of CRISP-DM. The functionality of each component is described as follows.
1) THE FUNCTIONALITY OF THE DATA SELECTOR COMPONENT
This component acts as a data broker interface and corre-sponds to the data understanding phase of CRISP-DM. The Data Selector component obtains the required contents of the data stored in the DCL based on parameters or features established by the domain expert. It takes schema (i.e., fea-ture information) as input from the Intermediate Database of the DCL through the Data Sharing Interface and displays it to the domain expert. In addition, to help the domain expert select suitable features, this component provides a fea-ture scorecard, which is computed using our proposed UFS methodology.
2) THE FUNCTIONALITY OF THE DATA PREPROCESSOR COMPONENT
Data preprocessing can play a major role in enhancing data quality. After loading the unprocessed data from the DCL through the Data Sharing Interface, this component performs basic data preprocessing tasks such as (1) the identification and replacement of missing values, (2) the detection and replacement of outlier values, and (3) data discretization
corresponding to the data preparation phase of CRISP-DM. After performing these tasks, it stores the data into the Pro-cessed Datarepository.
3) THE FUNCTIONALITY OF THE ALGORITHM SELECTOR COMPONENT
The Algorithm Selector component, part of the modeling phase of CRISP-DM, recommends an appropriate decision tree algorithm from the Algorithm Selection Model reposi-tory using an accurate multi-criteria decision-making (AMD) methodology [21].
4) THE FUNCTIONALITY OF THE MODEL LEARNER COMPONENT
The Model Learner component, corresponding to the model-ing phase of CRISP-DM, loads the processed data from the Processed Data repository and the recommended algorithm from the Algorithm Selector component for data learning. After acquiring the data and the algorithm, this component generates the classification model and stores it in the Decision Tree Classification Models repository.
5) THE FUNCTIONALITY OF THE MODEL TRANSLATOR COMPONENT
The Model Translator component, also corresponding to the modeling phase of CRISP-DM, applies text preprocessing techniques to the generated classification model to prepare it for XML transformation. After text processing, this com-ponent transforms the processed classification model into an XML model. It then parses the resulting XML model to extract production rules that can be shared with the domain expert through the Rules Sharing Interface for validation.
TABLE 1. CRISP-DM phases and tasks performed in the DDKAT [26].
C. FUNCTIONAL MAPPING OF THE PROPOSED SYSTEM WITH PHASES OF THE CRISP-DM
This section gives a description of the functional mapping of the DDKAT to the phases of CRISP-DM, as shown in Table1, which details the tasks performed by the DDKAT for each phase.
An understanding of the application domain is developed in the first phase of CRISP-DM, and parameter selection, query generation, feature scoring, and data collec-tion are performed in the second phase. Data preprocessing (e.g., cleaning and discretization) and modeling (e.g., classi-fier selection, data learning, building of classification models, and translation into production rules) are covered in the third and fourth phases, respectively. In the fifth phase, the pro-posed methodology and user assessments are evaluated. Finally, the sixth and final phase accounts for the deployment of the proposed system.
Detailed methodologies for the data understanding, data preparation, and modeling phases of CRISP-DM are explained in the following subsections.
D. METHODOLOGY FOR THE DATA UNDERSTANDING PHASE
To understand the data in this study, the parameters (i.e., features or variables) were selected and ranked in the data understanding phase. The following subsection describes the proposed Unified Features Scoring methodol-ogy for ranking and prioritizing the features.
1) UFS METHODOLOGY
UFS is an automatic feature ranking methodology that attempts to unify different feature selection measures in a comprehensive manner. It uses an intuitive approach to ensemble learning and produces a final ranked list by combining the results of various feature ranking techniques [16], [17].
The following is some rationale for the approaches used in UFS. Feature selection techniques are generally split into two categories: filters and wrappers [39], [40]. UFS focuses on filter-based methods, which allow for better generalization
and are considered to be much faster and less computa-tionally expensive than wrapper methods [39], [41]. UFS is based on five univariate filter-based measures to com-prehensively evaluate the feature set–information gain, gain ratio, chi-square, symmetric uncertainty, and attribute signif-icance (AS) [12], [16]–[18]. With each of these filter mea-sures, the features are evaluated under various considerations. The rationale for choosing each is as follows:
• Information gain, one of the popular feature selection measures, measures how much information a feature provides about the target class [42].
• Gain ratiois a disparity measure that enhances informa-tion gain [42].
• Symmetrical uncertaintyperforms well for highly imbal-anced feature sets [43].
• CHI-squareis a statistical measure that determines the association of a feature with its target class [42]. • Attribute significance is a probabilistic measure that
assesses an attribute’s worth. It is a two-way function that computes the attribute’s significance, or association with a class attribute [44].
UFS uses a ranking approach, which is attractive for features with empirical validity, simplicity, and scalabi-lity [16], [45]. Each filter measure has a different relative scale depending on its characteristics and biases. To account for these biases and avoid the impact of multiple relative scales (i.e., numerical instability), UFS bounds the values within small intervals and normalizes them to the same range (between 0 and 1) using min-max normalization (MMN), which is defined as follows:
MMN =value−min
max−min (1)
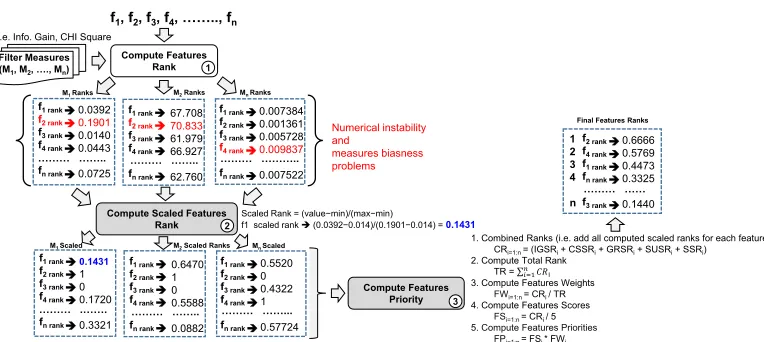
FIGURE 2. Unified features scoring workflow.
FIGURE 3. Diabetes dataset example for explaining UFS.
applies the arithmetic mean as an aggregating function to compute relative feature weights and ranking priorities. The workflow of the UFS methodology is illustrated in Fig.2.
UFS can also be explained using a benchmark diabetes dataset,4as shown in Fig.3.
In Fig. 3, f1,f2,f3, ....,fn represent the features (such as preg, plas, pres,...., age) of the diabetes dataset, and M1,M2, ....,Mnrepresent the five aforementioned univariate filter-based measures. Ranks are computed using each filter measure. For example, usingM1(information gain), the
com-puted ranks of each feature are: 1, rank of @attributepreg=0.0392 2, rank of @attributeplas=0.1901 3, rank of @attributepres=0.014 4, rank of @attributeskin=0.0443 ...
8, rank of @attributeage=0.0725
After calculating the information gain of each feature, min-max normalization is applied to each attribute. For example, the attribute preg is normalized to 0.1431. This process is then replicated for the other measures (M2, M3, M4,M5).
4
https://archive.ics.uci.edu/ml/machine-learning-databases/pima-indians-diabetes/
The different ranks of the feature are then combined; once each feature has been evaluated and scaled according to each filter measure, a comprehensive score of the individual feature is calculated, as shown in Fig.3. The attribute weight is also calculated based on the feature’s individual score and the combined score of all the features present in the dataset. Finally, attribute priority is computed based on the contribution of a feature in terms of its individual measure score and its relative weight in a dataset; for example, heref2
had the highest priority. This can assist the domain expert in selecting high-priority features for the data preparation phase of CRISP-DM.
The purpose of the UFS approach is to (i) reduce the risk of selecting an irrelevant feature, (ii) yield more robust feature subsets, and (iii) improve classification performance [10], [16], [46], [47]. Although our proposed methodology has additional computational costs, it is worth it because it uses a preferable framework [48].
E. METHODOLOGY FOR THE DATA PREPARATION PHASE
[image:7.576.94.476.225.396.2]outliers are removed in data cleaning, while data transfor-mation involves data discretization. The discretization pro-cess simplifies the data, enables quick learning, improves the accuracy of the model, optimizes results, and removes outliers [49].
In this study, we used the mean/mode substitution approach to handle missing values, the inter-quartile range for outlier detection, and equal width binning for data discretization. We chose easy-to-use methods without considering the nature of the data; we do not claim that our selected data preparation methods will always produce excellent results because that is not the scope of our study. Our purpose is only to show the positive effects of various data preprocessing techniques on the predictive accuracy of a classifier.
F. METHODOLOGY FOR THE MODELING PHASE
This section covers the methodology used to perform model learning and model translation, which build the classifica-tion models and generate the producclassifica-tion rules, respectively. The details of each method are explained in the following subsections.
1) METHOD FOR MODEL LEARNING
To build the classification models, seven decision tree clas-sifiers were considered for this study, namely BFTree, FT, J48, J48graft, RandomTree, REPTree, and SimpleCart. The characteristics of each classifier are shown in Table2.
TABLE 2. Selected decision tree classifier characteristics.
In order to select appropriate classifiers among these seven decision tree classifiers, a case-based meta-learning and rea-soning framework (CB-MLR) [50] was used. CB-MLR inter-nally uses a case-based reasoning methodology in which a case-base is first created from freely available data classifi-cation problems, where the features of each case are meta-characteristics of the datasets. These meta-meta-characteristics include general, basic, and advanced statistical features as well as information-theoretic features of the datasets. Each of these categories of features represents a view of the dataset. The class label of each case is that found by the best classifier of the seven candidate classifiers, as defined by AMD [21]. This computation empirically evaluates and ranks these clas-sifiers based on the accuracy and consistency of the classi-fier’s performance. After ranking, the top three appropriate decision tree classifiers are recommended, and the top clas-sifier is selected for the creation of a classification model.
The AMD methodology reduces the time and effort expended by the domain expert and enhances system performance [21]. An open source application of the algorithm selector is avail-able on GitHub to support its theoretical value [51].
In this study, we used non-exhaustive k-fold cross-validation (i.e., rotation estimation) to measure and assess the performance of the machine learning methods in terms of predictive accuracy [28], [52]. More specifically, we selected 10-fold cross-validation (k =10) for computing the predic-tive accuracy [12], [53].
Ink-fold cross-validation, the original dataset is randomly split intokequal-size sets. For example, fork=10, we ran-domly partitioned the original dataset intod0,d1,d2,. . . ,d9.
After partitioning, only one set (d0) is used as testing data
while the remainingk−1 sets (d1,d2,. . . , d9) are used as
training data. In the next iteration,d1is used as testing data
andd0,d2,. . . ,d9as training data. This process is repeated
k times so that each set is used exactly once for valida-tion. After completing k iterations, the k results are aver-aged to provide a single estimate, resulting in more accurate predictions [54], [55].
This technique estimates the quantitative measure of fit for the data as well as for the classification model. This fit is evaluated in terms of a statistical measure called thepositive predictive value(PPV) [56]. Herein, the PPV is used as the measure of prediction accuracy.
The PPV is defined as:
PPV = number of TPs
number of TPs+number of FPs (2)
where TPs are true positives and FPs are false positives. A true positive means there is a positive prediction and a pos-itive result, while false pospos-itive means a pospos-itive prediction but a negative result [57].
2) METHOD FOR MODEL TRANSLATION
Production rules are easy to understand, widely used for knowledge representation, and more compact and predictive than decision trees. The translation process for converting multiple decision trees into production rules for automated use is explained in Algorithm1. This algorithm takes input from the decision tree algorithm (DTA) and classification model (CM) and sequentially passes them through mandatory steps to generate production rules. The steps involved in the models are: (1) model preparation (line 4), (2) XML conversion (line 6), (3) XML parsing (lines 8 to 12), and (4) production rule generation from the Document Object Model (DOM) Tree object (lines 13 to 49).
Algorithm 1Production Rule Generation From Decision Trees (D=DTA,CM) Data: D=DTA,CM: Input dataset (decision tree algorithm, classification model) Result:RS−Rule set
1 /* DTA=algo1, algo2, algo3, algo4, algo5, algo6, algo7, and algo8, representing BFTree, FT, J48, J48graft, LADTree, RandomTree, REPTree, and SimpleCart algorithms,
respectively */;
2 /* Similarly, CM = cm1,cm2,cm3,cm4,cm5,cm6,cm7, and cm8, representing the
classification models generated from algo1,algo2,algo3,algo4,algo5,algo6,algo7, and algo8,
respectively */;
3 /* Preprocess the classification model (e.g. remove the header and footer
information from each model) */;
4 PM←preprocessModel(DTA,CM) // where PM represents the processed model;
5 /* Convert the processed model into W3C specification-based XML format */;
6 XM←xmlConversion(PM) // where XM represents the XML model;
7 /* Parse the XML model to extract information (e.g. element information such as
root nodes, child nodes, sibling nodes, parent nodes, and relationships between
nodes) */;
8 DTO←parseXML(XM) // where DTO represents the DOM tree object;
9 /* Get root node from DOM tree object */;
10 RootNode←getRootNode(DTO) ;
11 /* Get the first child of the root node and consider it the current node */;
12 CurrentNode←getFirstChild(RootNode) ;
13 ruleID←0 // initialize the rule id;
14 RulesList[] // declare the rule list;
15 /* Extract the node information */;
16 whileCurrentNode6=nulldo
17 ifhasChildNodes(CurrentNode)then
18 CurrentNode=getFirstChild(CurrentNode) 19 else
20 /* leaf node */;
21 ifCurrentNode=LeafNodethen
22 ruleID++;
23 RuleConclusion←getNodeValue(CurrentNode) ;
24 RuleConditionsList[] // declare the condition list for a rule; 25 PathNode←CurrentNode;
26 whilehasParentNode(PathNode)do
27 ConditionAttribute←getNodeAttribute(PathNode); 28 ConditionOperator ←getNodeOperator(PathNode); 29 ConditionValue←getNodeValue(PathNode);
30 /* merge the node parameters to make a rule condition */;
31 RuleCondition←ConditionAttribute t ConditionOperator t ConditionValue; 32 RuleConditionsList.add(RuleCondition);
33 PathNode←getParentNode(PathNode) ;
34 end
35 RuleConditionsList ←reverse(RuleConditionsList) ;
36 /* merge the rule parameters to make a single rule */;
37 Rule←ruleID t RuleConditionsList t RuleConclusion; 38 RulesList.add(Rule) ;
39 end
40 /* find the parent level */;
41 whilegetNextSibling(CurrentNode) = null and CurrentNode6=RootNodedo
42 /* use child-parent link to get to the parent level */;
43 CurrentNode←getParentNode(CurrentNode);
44 end
45 CurrentNode←getNextSibling(CurrentNode) ;
46 end
47 end
content after validating the document with the W3C speci-fication. The DOM parser maps the structure of an XML file to a DOM tree object and facilitates random access to the content of the XML document. In the final step, to generate the production rules, the attributes, operators, and values of each condition and the conclusions of each path are extracted by traversing the tree. For further details, please see our previous work [24].
IV. SYSTEM RESULTS
This section describes the evaluation of the proposed UFS methodology and data preprocessing phase. The purpose of this is to determine the impact of the proposed feature selection methodology on the predictive accuracy of the clas-sification model in terms of feature ranking (data under-standing phase) and data preprocessing (data preparation phase).
A. EVALUATION OF THE UNIFIED FEATURES SCORING METHODOLOGY
[image:10.576.301.534.66.187.2]This section describes the evaluation setup and compares the proposed feature selection methodology with state-of-the-art feature selection methods.
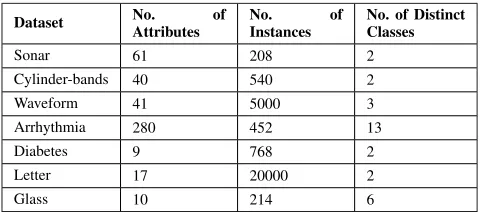
TABLE 3. Selected dataset characteristics.
To evaluate our feature selection methodology, we chose seven datasets of varying complexity, as shown in Table 3. These benchmark datasets were acquired from the openML5 repository, and we selected those of small to medium size. Both binary and multi-class problems were considered for this study.
We used five well-known classifiers in this study: J48, naive Bayes, support vector machine (SVM), k nearest neigh-bors (KNN) and JRIP. For comparison purposes, we utilized standard open-source implementations of these classifiers provided by WEKA.6Using these open-source implementa-tions, we wrote a method in Java that computes the predictive accuracy of these five classifiers in 10-fold cross-validation.
Of the five classifiers, SVM and JRIP tended to perform best on the above-mentioned datasets. Figure 4 illustrates the experimental difference between the predictive accuracy of the classifiers, where the first part of the figure (with a white background) shows the results for only the datasets
5http://www.openml.org/
[image:10.576.37.279.369.475.2]6http://weka.sourceforge.net/doc.dev/
FIGURE 4. Performance difference for the proposed feature ranking method.
on which SVM performed best. Likewise, the second part of Fig.4shows the three datasets on which JRIP performed better.
We compared our proposed UFS methodology against five feature selection measures: information gain, gain ratio, symmetric uncertainty, chi-square, and significance. Figure 4 illustrates the difference in predictive accuracy between UFS and each feature selection measure. We can deduce from these results that our proposed methodology is competitive with state-of-the-art feature selection methods. We found that in 97.15% of cases, the UFS methodology had greater or equal predictive accuracy, while in the remaining 2.85% (1 out of 35; IG in the Waveform dataset) our method-ology had lower predictive accuracy.
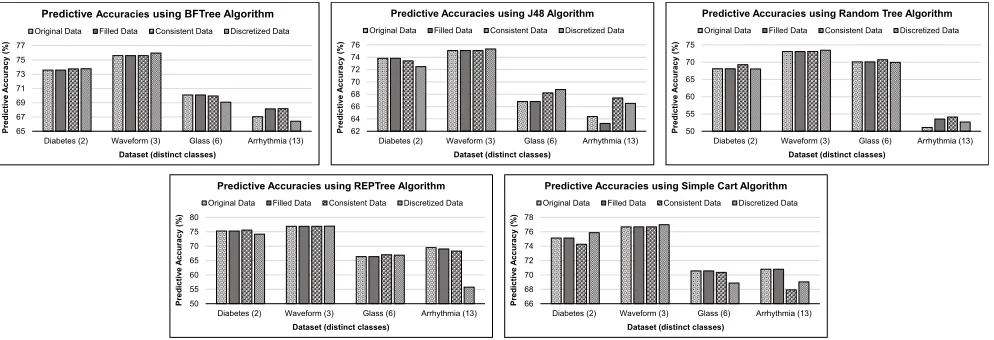
B. EVALUATION OF THE DATA PREPROCESSING TASKS
This section describes the results of data preprocessing in terms of the predictive accuracy of classifiers on the Diabetes, Waveform, Glass, and Arrhythmia datasets. In data prepro-cessing, each data preparation step performs some modifica-tions and stores the data for input to the next step, as well as for performance comparison purposes. We categorize these data as original data, filled data (obtained after replacing missing values), consistent data (obtained after replacing outliers), and finally discretized data (obtained after dis-cretization). The results of this comparison are illustrated in Fig.5.
[image:10.576.38.277.369.475.2]FIGURE 5. Comparative results of preprocessing steps in terms of predictive accuracy.
V. SYSTEM EVALUATION
The evaluation phase of any proposed system is key in judging the worth of the system. This section evaluates the subjective perception of users towards the DDKAT product.
In this study, we considered user experience (UX) as the major criteria for evaluating the DDKAT. UX describes the quality of interaction between the participants and the com-puter system [58]. Normally, in a real-world situation, differ-ent users may have differdiffer-ent feelings for the same product due to varying personal experiences. In order to mitigate this problem, the user experience is measured by collecting feedback from a large group of users [59]. To quantify a product’s user experience, questionnaires are considered a highly efficient and cheap tool [59]–[61].
There are many research frameworks for state-of-the-art evaluation of user experience, such as the Questionnaire for User Interaction Satisfaction, System Usability Scale, Stan-dardized User Experience Percentile Rank Questionnaire, Software Usability Measurement Inventory, AttrakDiff, and User Experience Questionnaire. Among these frameworks, the User Experience Questionnaire (UEQ) is the most widely used evaluation framework for interactive products for the following reasons: (1) it provides a thorough evaluation by accounting for both user experience and classical usability aspects, (2) it interprets results accurately, (3) it is free to use and has no fees, (4) it is reliable and easy to apply, (5) it requires low effort, and (6) it provides fast, direct, and valid quantitative measurements of UX [58]–[61].
The UEQ includes 26 items that are grouped into six scales: attractiveness, the appeal of the product; perspicuity, the ease of product use; efficiency, the speed with which it solves tasks; dependability, the user’s control over product interaction; stimulation, the user’s reactions to the product; and novelty, how innovative the product is [58] and [61]. These scales are further categorized into two quality mea-sures, called pragmatic quality (PQ) for task-related quality aspects, and hedonic quality (HQ) for non-task related quality
aspects. PQ accounts for perspicuity, efficiency, and depend-ability, while the HQ covers stimulation and novelty [58]. Each item in the UEQ comprises a pair of terms (adjectives) with opposite meanings and a 7-point Likert scale [61].
AttrakDiff is another established and popular online ques-tionnaire designed to evaluate user experience. This question-naire was designed and developed within the UEQ research framework and provides a limited free online interface (only 20 users) to investigate the attractiveness, pragmatic, and hedonic aspects of products [62]. Again, the pragmatic qual-ity of a product is the abilqual-ity for effective and efficient task completion, while the hedonic quality represents the joy and fun experienced by the user. Similarly to the UEQ, it consists of 29 questions, where each question consists of a pair of contrasting adjective terms [63]. These are grouped into PQ, HQ (which is further divided into two sub-aspects:Identity (HQ-I) and Stimulation (HQ-S)), and Attractiveness (ATT) [64]. Due to the mobility of the participants and the short duration of the evaluation, a combination of AttrakDiff and UEQ can be used [63].
Regarding the correlation between the UEQ and AttrakDiff, the pair of terms used for ATT are nearly identical in both questionnaires. Similarly, it is expected that the perspicuity, efficiency, and dependability scales of the UEQ have a positive correlation with the PQ aspect of AttrakDiff, and the novelty and stimulation scales of the UEQ have a highly positive correlation with the stimulation scale of AttrakDiff [60].
In this study, we used both UEQ and AttrakDiff to assess the value of the DDKAT. In the following sections, we describe the design setup, evaluation process, and eval-uation results.
A. EXPERIMENTAL SETUP
TABLE 4. Evaluations setup for the DDKAT.
and demonstrated the DDKAT before conducting the survey. The evaluation setup for both studies is shown in Table 4, where two types of users were considered for assessing the DDKAT. The first were experts with experience in using arti-ficial intelligence (AI) domain applications, and the second were intermediate users who were studying or learning AI applications.
B. EXPERIMENTAL EXECUTION
The procedure for conducting the evaluation was different in both studies. ForStudy I, an AttrakDiff project with the name Data-Driven Knowledge Acquisition Toolwas created using the eSURVEY tool7 to measure the user experience of the DDKAT. After creating the project, the product was hosted on a web server and the URL was given to all participants. We sent an invitation email to the 19 participants and asked them to evaluate the DDKAT directly based on their judg-ments [65]. In the email, we mentioned all the features of the DDKAT, its usage instructions, the actual product’s URL, and the eSURVEY URL for the AttrakDiff questionnaire. A demo session was conducted for the participants before they filled out the online AttrakDiff questionnaire.
For Study II, a demonstration of all of the features of the DDKAT was given to students during class time of three different courses. After the demonstration, we answered all questions from the students. Finally, the UEQ survey form was distributed to all students to record their assessment.
C. EXPERT EVALUATIONS
After the 19 knowledge experts evaluated the DDKAT and completed the online AttrakDiff questionnaire, the results were compiled using the eSURVEY tool as shown in Figs.6-8.
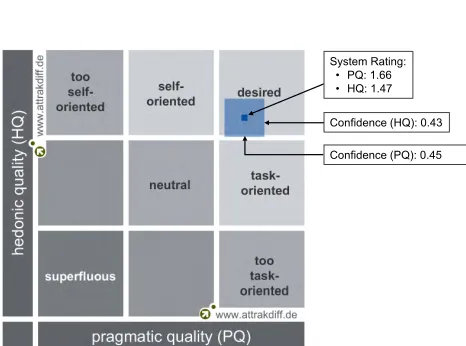
Figure6shows a portfolio diagram, which summarizes the performance of the DDKAT in terms of PQ and HQ. This figure shows multiple confidence regions, such as too self-oriented, self-self-oriented, desired, neutral, task-self-oriented, too
7https://esurvey.uid.com/project#!overview
[image:12.576.290.538.91.429.2]FIGURE 6. Portfolio diagram of the DDKAT with respect to PQ and HQ.
FIGURE 7. Average values of the four AttrakDiff dimensions for the DDKAT.
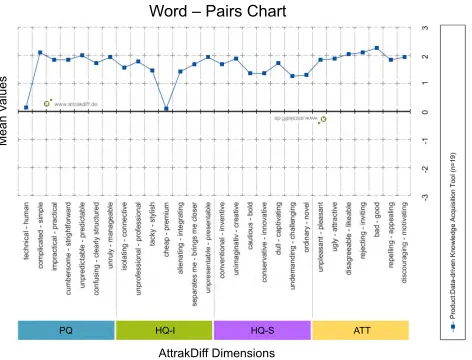
[image:12.576.300.533.252.425.2] [image:12.576.300.537.467.597.2]FIGURE 8. Mean values of AttrakDiff adjective-pairs for the DDKAT.
Another evaluation perspective is shown in Fig.7, in which PQ, HQ-I, HQ-S, and ATT were rated by computing their average scores, as shown on the y-axis. PQ represents the usability of the product and reveals how well users are accomplishing their objectives; HQ-S describes the support-ing features of a system, such as its novelty, interestsupport-ing and stimulating functions, contents, and presentation styles; HQ-I indicates the ability of users to identify with the sys-tem; and ATT represents the overall perceived quality of the system [65]. The user assessments of all four dimen-sions fell between 1 and 2 for the DDKAT, which is in the ‘‘above-average’’ region. In particular, the attractiveness of the DDKAT gained more attention than the other three aspects, falling on the boundary of the ‘‘good’’ region.
Figure7shows the average scores of the four AttrakDiff dimensions, while a detailed view of the ratings for these four dimensions is provided in Fig.8, which shows the AttrakDiff adjective-pair questions [65]. For the PQ and ATT dimen-sions of the DDKAT, the average score was 6 out of 7 for all adjective-pairs except ‘‘technical human.’’ Based on the results shown in Figs.6-8, the overall user experience was positive.
D. INTERMEDIATE USER EVALUATIONS
The DDKAT was demonstrated to a number of artificial intelligence students, including all data mining processes and their features. The queries of the students were addressed after the demonstration. Finally, the UEQ survey was given to all students, and they were asked to fill it out based on their understanding [58]. After 102 intermediate users eval-uated the DDKAT and completed the UEQ, the results were automatically generated using a data analysis tool8[66]. Each item of the UEQ has answers ranging from −3 (strongly negative) to+3 (strongly positive) [61]. The compiled results are shown in Figs.9-11.
8www.ueq-online.org
[image:13.576.41.277.67.247.2]FIGURE 9. Mean value per item for the DDKAT product.
FIGURE 10. UEQ scale results for the DDKAT.
FIGURE 11. The benchmark results for the DDKAT.
[image:13.576.299.534.320.442.2] [image:13.576.300.536.472.573.2]also shows that all mean values except that of item 17 fell between 1 and 2, which indicates that overall, all 102 AI domain students were satisfied with this product.
To further analyze the UEQ, we calculated the means of six scales–attractiveness, perspicuity, efficiency, dependabil-ity, stimulation, and novelty [58], [61]–whose values were scaled in the range of−3 to+3 [59], as shown in Fig.10. It can be observed from Fig.10that the values of all scales were greater than+1, indicating a positive response from the participants [59]. Attractiveness, efficiency, stimulation, and novelty fell between 1.5 and 2, demonstrating the very good quality of the DDKAT [59]. The perspicuity scale had a value close to +2, representing the very positive (near-optimal) feelings of the participants [59], while the dependability scale had a positive evaluation falling in the above-average region of user satisfaction.
To evaluate the precision of the mean estimates, we also computed 95% confidence intervals for each UEQ scale [67]. We found them to be small for all six scales, as shown in Fig. 10. The smaller the width of the confidence inter-val, the smaller the variation and the better the result (i.e., the higher the precision) [67]. This higher precision increases trust in the results [59], [67]. In Fig.10, the error bars represent these confidence intervals. The confidence intervals for the DDKAT were 0.342 (1.791 to 2.133) for attractiveness, 0.327 (1.870 to 2.197) for perspicuity, 0.257 (1.776 to 2.033) for efficiency, 0.278 (1.294 to 1.572) for dependability, 0.345 (1.732 to 2.077) for stimulation and 0.311 (1.479 to 1.790) for novelty.
To evaluate the consistency of the UEQ scales, we com-puted their reliability using the Cronbachs alpha coefficient, which was found greater than 0.7 for all six scales. The Cron-bachs alpha coefficients for the DDKAT were 0.93 for attrac-tiveness, 0.87 for perspicuity, 0.77 for efficiency, 0.71 for dependability, 0.89 for stimulation and 0.78 for novelty. The coefficient for dependability was slightly lower than that of the other scales, which could be due to an incorrect under-standing of the items in this scale [59].
The UEQ scales are categorized into PQ, HQ, and ATT dimensions [61]. ATT is a pure valence dimension; PQ rep-resents the perspicuity, efficiency, and dependability; HQ expresses the stimulation and novelty. The UEQ evaluation tool found that PQ (1.79) and HQ (1.77) were good, with a mean value greater than 0.800 (see Fig. 10) [59]. PQ represents the ease of use of the product [66], so the high PQ score of the DDKAT provides evidence that it is easy to use.
In order to check the quality aspect of the DDKAT prod-uct, we have compared our results with other products as shown in Fig. 11. For this purpose, the UEQ analysis tool provides a benchmark for the user experience [61]. Based on the available benchmark, the attractiveness, perspicuity, efficiency, stimulation, and novelty aspects of the DDKAT product are excellent, whereas the dependability aspect lies in the above average region. Here the term ‘excellent’ defines that the product under-consideration is among the best 10%
of the result, while the term ‘above average’ defines that the evaluated product does not among the best 25% of the benchmark results and 50% of the benchmark results are worse than the evaluated product [61].
To confirm the quality of the DDKAT, we compared our results with those of other products, as shown in Fig. 11. For this purpose, the UEQ analysis tool provides user experi-ence benchmarks [61]. Based on the available benchmarks, the attractiveness, perspicuity, efficiency, stimulation, and novelty of the DDKAT product are excellent, while the dependability falls in the above average region. Here, the term ‘excellent’ means that the product is among the best 10%, while the term ‘above average’ means that the product is not among the best 25%, but is better than 50% of the benchmark results [61].
Based on the quantitative results obtained using the UEQ analysis tool and AttrakDiff, the overall user experience was evaluated as good in terms of the pragmatic, hedonic, and attractiveness features, and users were satisfied with the DDKAT. There is now only a need to improve security in order to increase the dependability of the product.
VI. SIMULATION OF THE DDKAT
This section describes an overview of the Data-Driven Knowledge Acquisition Tool, a case study to simulate the DDKAT for the end-to-end knowledge engineering process, and a mechanism for sharing the production rules.
A. DATA-DRIVEN KNOWLEDGE ACQUISITION TOOL OVERVIEW
We designed and developed the DDKAT, a tool for extracting hidden knowledge from structured data and converting it into production rules. This tool is a web-based application that covers almost all phases of CRISP-DM. It creates production rules using a data-driven approach to allow a domain expert to visualize hidden knowledge that is difficult to see with the naked eye. It was designed for our previously proposed Mining Minds platform [37], [38], and it acquires user profile and life-log data from the Data Curation Layer and produces production rules to provide better services through the Ser-vice Curation Layer, as shown in Fig.1. The output of this tool is processed data, a classification model, and production rules.
The open-source implementation and documentation of this tool is beneficial for developers in the artificial intelli-gence domain and the healthcare community, who can use it to extract knowledge from raw data in a simple manner. Using this tool, a domain expert goes through the data sci-ence process, which applies data mining methods to extract knowledge from data. This process is well known in research communities such as artificial intelligence, machine learn-ing, statistics, and knowledge acquisition for expert systems. Moreover, the DDKAT helps the domain expert perform tasks such as:
• applying data mining methods in data preprocessing to enhance the predictive accuracy of the classification model.
• selecting an appropriate decision tree classifier to gen-erate the classification model.
• translating the classification model into production rules to share with the expert for verification.
The DDKAT is an online, flexible, and loosely coupled software system that has been developed in Eclipse, Spring Web Model View Controller (MVC), JavaServer Pages (JSP), jQuery JavaScript library, Asynchronous JavaScript and XML (AJAX), and Bootstrap as front-end frameworks. For testing and validation purposes, Fiddler Web Debugger, JSONLint, and Apiary mock services have been used.
Some of the reasons for choosing the aforementioned tech-nologies to develop DDKAT are:
• Spring Web MVC9is an old and mature framework with excellent RESTful web service support.
• jQuery10 is a lightweight (write less, do more) library, which provides user-friendly functionality for JavaScripton your website.
• AJAX11is an approach for developing fast and dynamic web pages that updates parts of the web page without reloading the entire page.
B. CASE STUDY: DIABETES
This case study was used to illustrate aspects of development. It is helpful to perform an in-depth study and analysis of a real-world or an imagined scenario. As a case study to simulate the phases of CRISP-DM, the Pima Indians Diabetes Dataset12was used in this work.
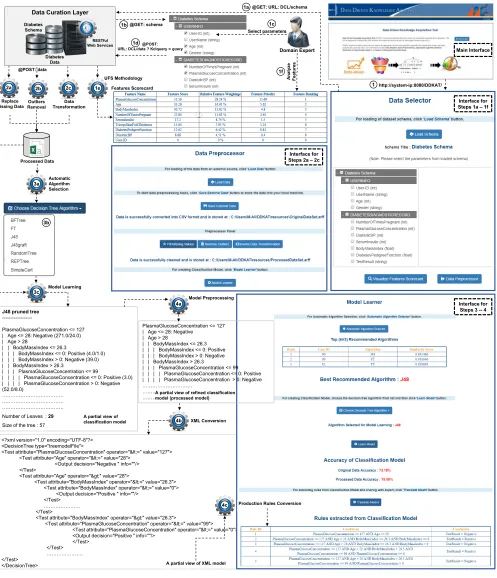
The simulation of the system is illustrated in Fig.12, where steps 1a to 1f belong to the data understanding phase of CRISP-DM, steps 2a to 2c belong to the data preparation phase, and steps 3(a,b,c) and 4(a,b,c) belong to the modeling phase.
1) STEP-1
To start the end-to-end knowledge engineering process, the domain expert opens the DDKAT application by typing http://system-ip:8080/DDKAT/ into a browser. After loading the application, the domain expert clicks theClick to Start button to start the data understanding phase, which includes the following:
a) To view the available parameters (features) for a partic-ular domain, the domain expert clicks theLoad Schema button to send the schema request to the DCL. b) The DDKAT parses the received schema and converts
it into a tree structure using a jQuery plugin.
c) The domain expert first selects parameters based on his/her own experience and knowledge, then clicks the
9http://www.tutorialspoint.com/spring/spring_web_mvc_framework.htm 10http://www.w3schools.com/jquery/jquery_intro.asp
11http://www.w3schools.com/ajax/ajax_intro.asp
12
https://archive.ics.uci.edu/ml/machine-learning-databases/pima-indians-diabetes/
Visualize Features Scorecardbutton.
d) The DDKAT forwards the selected parameters query to the DCL to request the data.
e) The DDKAT receives data from the DCL and uses the UFS methodology to produce and display the Features Scorecard.
f) The domain expert analyzes/watches the features scorecard. In case of dissatisfaction, the domain expert reselects the parameters, repeating steps (c) to (f) until he/she is satisfied with the current parameter selec-tion. When satisfied, the domain expert clicks theData Preprocessorbutton to move into the data preparation phase.
2) STEP-2
To start the data preparation phase, the domain expert clicks theLoad DataandSave External Databuttons to load and store the selected data on the local machine.
a) The domain expert clicks theFill Missing Values but-ton. When this is clicked, the DDKAT first identifies all missing values from the loaded dataset, then fills them with appropriate values and stores the data in a processed data repository.
b) Similarly, the domain expert clicks theRemove Outliers button to detect and replace all outliers with appro-priate values, and store that data in a processed data repository.
c) Finally, the domain expert clicks the Invoke Data Transformation button to discretize the loaded data and store that data in a processed data repository.
3) STEP-3
After completing the data preparation phase, the domain expert clicks theModel Learnerbutton to start the modeling phase for building a classification model, which includes the following steps.
a) The domain expert clicks the Automatic Algo-rithm Selectorbutton to view the best recommended algorithm by the DDKAT.
c) Based on this recommendation, the domain expert clicks the Choose Decision Tree Algorithm button to select the recommended algorithm or any other algorithm from the list to build the classification model.
FIGURE 12. Simulation of the Data-Driven Knowledge Acquisition Tool.
than all of the attributes. Since the number of attributes directly affects the computational load, fewer attributes result in lower computational cost. For example, a total of nine attributes were used to describe each instance
4) STEP-4
Once the classification model is built, the domain expert clicks theTranslate Modelbutton to generate production rules from the classification model, which involves the following steps.
a) The DDKAT performs text processing tasks to refine the classification model, including text trimming before and after the actual model, replacement of spe-cial characters, and text splitting.
b) The DDKAT applies an indentation and a comparison operator configuration, and converts this into an XML model.
c) The DDKAT parses the XML model and extracts: (1) the root node and (2) all child, sibling, and leaf nodes from the XML model. It also extracts all paths of leaf nodes. Finally, the DDKAT extracts the attributes, oper-ators, and values of each condition and the conclusion from each path and converts them into production rules.
C. A RESTFUL WEB SERVICE FOR SHARING PRODUCTION RULES
[image:17.576.41.276.400.591.2]A RESTful Web service is a software service that is published on the Web and enables devices to communicate with each other [68]. To share production rules, a RESTful JavaScript Object Notation (JSON)-based web service was built on the Spring MVC framework.
FIGURE 13. Structure of a shared production rule.
In this study, we built a flexible JSON object that con-tains an ArrayList. We named this object ruleList which then implemented the List interface, where each element of ruleList represents one complete rule. Since each rule can be composed of multiple conditions or multiple conclusions, each element ofruleListcontained two ArrayLists ( condition-ListandconclusionList) and one name/value pair to represent ruleID, as shown in Fig. 13. Furthermore, each condition-List of an element consisted of four name/value pairs to
representconditionID,conditionKey,conditionOperator, and conditionValue. Similarly, each conclusionList consisted of conclusionID,conclusionKey,conclusionOperator, and con-clusionValue. An online JSON editor13was used to view and validate the JSON data. After JSON validation, a service was built with the titleshareRules. This service creates a JSON object at runtime whenever it is called using http://system-ip:8080/DDKAT/shareRules.
Fiddler,14 a free web debugging proxy for any browser, system, or platform, was used to test this web service. After successfully testing the service, a JSON object is created as shown in Fig.13. This figure shows the structure of the pro-duction rules, where one complete rule is highlighted. Each production rule has three parameters calledconclusionList, conditionList, andruleID, as discussed before.
VII. DISCUSSION OF THE SIGNIFICANCE, CHALLENGES, AND LIMITATIONS OF THIS STUDY
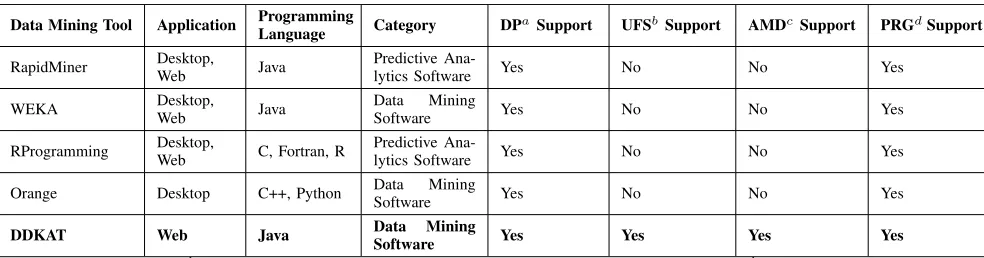
In every field, knowledge plays a vital role; all intelli-gent decisions are made based on knowledge. A data-driven approach is an effective way to improve business and soci-ety by extracting hidden knowledge from raw data. This facilitates improved decision-making capabilities and helps extract production rules. The data-driven knowledge acqui-sition approach was conceived to support the creation of health and wellness knowledge, and provides a knowledge acquisition environment to domain experts to better sup-port decision-making. We developed a system that aims to automate the feature-ranking process to select and prepare the data, select an appropriate classifier, generate production rules, and finally share the knowledge to be validated by the domain expert. This system provides maximum availability (24/7) as well as an easy-to-use environment for extracting hidden knowledge in a systematic manner, which is required in most decision support and recommendation systems. Fur-thermore, this system is capable of extracting production rules from multiple decision trees. We used a depth-first search algorithm for this task, which is more suitable than a breadth-first search (BFS) due to its connectivity features and because it requires less space relative to the depth of the tree; BFS requires an exponential amount of space.15Finally, the features of the developed tool were compared with the fea-tures of other well-known open-source data mining tools,16as shown in Table5.
During the development of the DDKAT, we encountered several challenges in implementing the UFS methodology and extracting production rules from the classification model. Some of the key challenges we attempted to resolve were the following:
13http://www.jsoneditoronline.org/ 14http://www.telerik.com/fiddler
15
http://stackoverflow.com/questions/10605519/advantage-of-depth-first-search- over-breadth-http://stackoverflow.com/questions/10605519/advantage-of-depth-first-search-or-vice-versa
16
TABLE 5. Comparison of the DDKAT with well-known open-source data mining tools.
Challenge 1: Integrating REST service and Spring MVC framework
Solution: Apiary service, which is a mock-based REST service
Challenge 2: Faster communication Solution: JSON format
Challenge 3: Converting loaded data into CSV (comma-separated values) format in a required sequence
Solution: Combination of logic and the use of an exter-nal utility
Challenge 4: Preparing a processed classification model Solution: Use of text manipulation methods
Challenge 5: Extracting production rules from a processed classification model
Solution: Combination of logic and the use of a DOM parser
The limitations of the proposed approach include a lack of flexibility to choose the decision attributes at runtime, absence of an administrative view to manage and authenticate users, the use of a complex and memory-intensive parser for XML documents, and lack of validation for invalid values.
VIII. CONCLUSIONS
Knowledge extraction from structured sources such as databases is an active area of research in the information systems community. In this work, we present an end-to-end knowledge engineering process. We developed a data-driven knowledge acquisition tool that adopts the CRISP-DM frame-work for knowledge generation. A novel Unified Features Scoring methodology was introduced for the data under-standing phase of CRISP-DM, making our system unique. The DDKAT was designed and developed for the Mining Minds framework; however, other service-enabled platforms can also utilize this product to extract production rules from a dataset. Two studies were performed in order to evaluate dif-ferent aspects of the proposed knowledge acquisition system, and both found that the overall user experience of the DDKAT product was positive. The current version of this tool and its documentation is open-source and can be downloaded from GitHub [1], [22].
In the future, we plan to integrate data-driven production rules with the expert-driven module of the Mining Minds framework for conformity. This would be useful in cases where the automatically generated production rules are in conflict with the application domain. The domain expert can then further analyze such rules and incorporate new knowl-edge to make the production rules consistent with the domain. We also intend to apply our developed system to another research project called the Intelligent Medical Platform (IMP),17 which will fuse AI, big data, cloud, and medical technologies to train the human resources required in the field of information communications tech-nology (ICT)-medical fusion. The details of the applica-tion of our developed system to the IMP project is avail-able at http://imprc.cafe24.com/research/core-1-knowledge-extraction/actionable-knowledge/.
ACKNOWLEDGMENTS
The authors would like to thank Mrs. Kerrin McKeown for reviewing and editing the English in the manuscript. They would also like to express their sincere thanks to Dr. Maqbool Hussain and Mr. Jamil Hussain for their valuable guidance and input to this manuscript.
AUTHOR CONTRIBUTIONS
Maqbool Ali was the principal researcher of this study. He devised and carried out the idea, designed and performed the experiments, and wrote the paper; Rahman Ali con-tributed to algorithm selection; Wajahat Ali Khan and Soyeon Caren Han contributed to system evaluations; Jaehun Bang, Taeho Hur, and Dohyeong Kim were involved in reviewing the initial manuscript and modifying the representations to improve the quality of the paper; Sungyoung Lee and Byeong Ho Kang provided advisory comments, remarks, and finan-cial aid for the paper.
REFERENCES
[1] M. Ali. (2017). A Documentation of DDKAT for Knowledge Acquisition. Accessed: Dec. 4, 2017. [Online]. Available: https://github. com/ubiquitous-computing-lab/Mining-Minds/tree/gh-pages/doc/kcl-doc/DDKAT/doc
![TABLE 1. CRISP-DM phases and tasks performed in the DDKAT [26].](https://thumb-us.123doks.com/thumbv2/123dok_us/8393251.323991/6.576.34.560.85.223/table-crisp-dm-phases-tasks-performed-ddkat.webp)