SIMULTANEOUS ESTIMATION OF REPAGLINIDE AND METFORMIN HYDROCHLORIDE IN TABLET DOSAGE FORM BY REVERSE PHASE HIGH PERFORMANCE LIQUID CHROMATOGRAPHY
Dissertation Submitted to
THE TAMILNADU Dr. M.G.R. MEDICAL UNIVERSITY Chennai - 600032
In partial fulfillment of the requirements for the award of the degree of
MASTER OF PHARMACY
In
PHARMACEUTICAL ANALYSIS Submitted by
R. VISWAPRASAD REDDY (Register No: 26104624)
Under the Guidance of Mrs. K. SONIA, M. Pharm.,
Assistant Professor
Department of Pharmaceutical Analysis
K.K. COLLEGE OF PHARMACY GERUGAMBAKKAM, CHENNAI - 600122.
CERTIFICATE
This is to certify that the dissertation entitled “SIMULTANEOUS ESTIMATION
OF REPAGLINIDE AND METFORMIN HYDROCHLORIDE IN TABLET
DOSAGE FORM BY REVERSE PHASE HIGH PERFORMANCE LIQUID CHROMATOGRAPHY’’ is a bonafide and genuine research work carried out at
Department of Pharmaceutical Analysis, K.K. College of Pharmacy, Chennai –
600122, by Mr. R. VISWAPRASAD REDDY during the academic year 2011-2012
under my direct guidance and supervision. This dissertation submitted in partial
fulfillment for the award of the award of Degree of Master of Pharmacy
(Pharmaceutical Analysis) to The Tamil Nadu Dr. M.G.R Medical University,
Chennai – 600032.
GUIDE
Mrs. K. SONIA, M. Pharm.,
Department of Pharmaceutical Analysis
K.K. College of Pharmacy, Gerugambakkam,
CERTIFICATE
This is to certify that the dissertation entitled “SIMULTANEOUS
ESTIMATION OF REPAGLINIDE AND METFORMIN HYDROCHLORIDE
IN TABLET DOSAGE FORM BY REVERSE PHASE HIGH PERFORMANCE LIQUID CHROMATOGRAPHY’’is a bonafide and genuine research work carried
out by Mr. R. VISWAPRASAD REDDY during the academic year 2011-2012 under
the supervision of Mrs. K. SONIA, M.Pharm., Assistant professor, Department of
Pharmaceutical Analysis, K.K. College of Pharmacy, Chennai – 600122. This
dissertation submitted in partial fulfillment for the award of the award of Degree of
Master of Pharmacy (Pharmaceutical Analysis) to The Tamil Nadu Dr. M.G.R
Medical University, Chennai – 600032.
PRINCIPAL DIRECTOR
Prof. A. MEENA, M.Pharm., (Ph.D) Prof. Dr. V. VAIDHYALINGAM. M.Pharm., Ph.D.,
K.K. College of Pharmacy, K.K. College of Pharmacy,
ACKNOWLEDGEMENT
This book is written in dedication to the God almighty who has blessed me
with the peace of mind, courage and strength and also with affectionate dedication to
my loving parents, brother and friends, who throughout the years have given me lot of
encouragement, valuable ideas and timely support whenever needed.
First and foremost, I wish to express my deepest gratitude to respected Prof.
K.R. Arumugam, M.Pharm, Chairman of K.K.College of pharmacy, Chennai for
his help and support.
I also wish to express my deep gratitude to Mrs. A. Meena, M.Pharm,
(Ph.D), Principal, K.K.College of pharmacy for her heartily cooperation and
valuable guidance throughout these two years of my M.Pharm course. She has always
given me lot of encouragement, valuable ideas and timely support whenever needed.
I wish to express my deep gratitude to Prof. Dr. V. Vaidhyalingam,
M.Pharm, Ph.D., Director and Head of department, K.K. College of pharmacy for
his heartily cooperation and valuable guidance throughout these two years of my
M.Pharm course.
I was fortunate enough to undertake present work under the supervision of my
guide Mrs. K.Sonia, M.Pharm, Department of pharmaceutical analysis, K.K.College
of pharmacy, for her generous guidance, moral support, constructive criticism, kind
supervision and constant encouragement in bringing this work to conclusion. I am
extremely thankful to madam for her positive and enthusiastic attitude towards the
I am deeply indebted to the teaching staffs of the department who was always
a source of knowledge and inspiration to me, especially Mrs. Sugantha Savitha,
M.Pharm, for their prompt assistance and cooperative attitude.
I also wish to express my sincere thanks to Mr. K. Chandrasekar, Chandra
labs, Hyderabad.
I am thankful to my beloved friends S.Sethu vani, S.K.Nayeem malik,
E.Karveen, G.Gurunath reddy, Ratna Kishore, Poornima and classmates for their
support and suggestion during my work.
Finally yet importantly, I gratefully forward my affectionate thanks to my
father (R.Raghunadha reddy), mother (R.Lakshmi devi) and brother
(R.Sivaprasad reddy) for their frequent prayers, which has sustained me a lot in the
successful completion of my project work.
DEDICATED TO
MY BELOVED PARENTS,
BROTHER, &
LIST OF ABBREVIATIONS USED
ACN - Acetonitrile
AMP - Adenosine mono phosphate
AOAC - Association of analytical communities
ASTM - American society for testing materials
ATP - Adenosine tri phosphate
AUC - Area under curve °
C - Degree Celsius
g - Grams
GLUT-4 - Glucose Transporter
HPTLC - High Pressure Thin Layer Chromatography
ICH - International Conference on Harmonization
IS - Internal standard
LOD - Limit of Detection
LOQ - Limit of Quantification
MET - Metformin
mg - Milligram
ml - Millilitre
NIDDM - Non Insulin dependent Diabetes mellitus
nm - Nanometer
ODS - Octadecyl silane
r2 - Correlation coefficient
RP-HPLC - Reverse Phase High Performance Liquid Chromatography
rpm - Rotations per Minute
Rt - Retention Time
S.D. - Standard Deviation
S.E. - Standard Error
USP - United States of Pharmacopoeia
USP/NF - United States pharmacopeia/National formulary
UV - Ultraviolet
v/ v - Volume/Volume
% - Percentage
% RSD - Percentage Relative Standard Deviation
- Micron
l - Microlitre
λ - Lambda
CONTENTS
SECTION TITLE Page No.
1 INTRODUCTION
Analytical Chemistry 1
High Pressure liquid Chromatography 6
2 AIM AND PLAN OF WORK 23
3 DRUG PROFILE 25
4 LITERATURE REVIEW 30
5 EXPERIMENTAL WORK
Instruments and Reagents used 38
Method development 39
Validation Parameters 48
6 CHROMATOGRAMS 57
7 RESULTS AND DISCUSSION 101
8 SUMMARY AND CONCLUSION 115
LIST OF FIGURES
FIGURE
No. CONTENTS
1. OVERLAID UV SPECTRUM OF REPAGLINIDE AND
METFORMIN HYDROCHLORIDE
2..
TRAIL-I: CHROMATOGRAM FOR EFFECT OF RATIO OF MOBILE PHASE IN ACETONITRILE: PHOSPHATE BUFFER (80:20 V/ V)
3.
TRAIL-II: CHROMATOGRAM FOR EFFECT OF RATIO OF MOBILE PHASE IN ACETONITRILE: PHOSPHATE BUFFER (60:40 V/ V)
4.
TRAIL-III: CHROMATOGRAM FOR EFFECT OF RATIO OF MOBILE PHASE IN ACETONITRILE: POTASSIUN
DIHYDROGEN PHOSPHATE (50:50 V/ V)
5.
TRAIL-IV: CHROMATOGRAM FOR EFFECT OF RATIO OF MOBILE PHASE IN ACETONITRILE: SODIUM DIHYDROGEN PHOSPHATE (60:40 V/ V)
6.
TRAIL-V: CHROMATOGRAM FOR EFFECT OF RATIO OF MOBILE PHASE IN ACETONITRILE: SODIUM DIHYDROGEN PHOSPHATE (58:42 V/ V)
7. SPECIFICITY– I:METFORMIN HYDROCHLORIDE (125 µg)
AND REPAGLINIDE (0.5 µg) 0.1 M ACID
8. SPECIFICITY– II: METFORMIN HYDROCHLORIDE (125 µg)
AND REPAGLINIDE (0.5 µg) 0.1 M NaOH
9. SPECIFICITY– III: METFORMIN HYDROCHLORIDE (125 µg)
AND REPAGLINIDE (0.5 µg) HEATING
10. STANDARD CALIBRATION CURVE FOR REPAGLINIDE
11. STANDARD CALIBRATION CURVE FOR METFORMIN
HYDROCHLORIDE
12. LINERARITY– I: METFORMIN HYDROCHLORIDE (25 µg)
FIGURE
No. CONTENTS
13. LINERARITY– II: METFORMIN HYDROCHLORIDE (10 µg)
AND REPAGLINIDE (0.04 µg)
14. LINERARITY– III: METFORMIN HYDROCHLORIDE (75 µg)
AND REPAGLINIDE (0.3 µg)
15. LINERARITY– IV: METFORMIN HYDROCHLORIDE (100 µg)
AND REPAGLINIDE (0.4 µg)
16. LINERARITY– V: METFORMIN HYDROCHLORIDE (125 µg)
AND REPAGLINIDE (0.5 µg)
17. LINERARITY– IV: METFORMIN HYDROCHLORIDE (150 µg)
AND REPAGLINIDE (0.6 µg)
18. LINERARITY– I-IV: METFORMIN HYDROCHLORIDE (150 µg)
AND REPAGLINIDE (0.6 µg)
19. SPIKING STANDARD– I: METFORMIN HYDROCHLORIDE
(125 µg) AND REPAGLINIDE (0.5 µg)
20. SPIKING STANDARD – II: METFORMIN HYDROCHLORIDE
(125 µg) AND REPAGLINIDE (0.5 µg)
21. SPIKING STANDARD – III: METFORMIN HYDROCHLORIDE
(125 µg) AND REPAGLINIDE (0.5 µg)
22. ACCURACY –TRIAL- I(Solution-1): METFORMIN
HYDROCHLORIDE (112.5 µg) AND REPAGLINIDE (0.45 µg)
23. ACCURACY – TRIAL- II(Solution-1): METFORMIN
HYDROCHLORIDE (112.5 µg) AND REPAGLINIDE (0.45 µg)
24. ACCURACY – TRIAL- III(Solution-1): METFORMIN
HYDROCHLORIDE (112.5 µg) AND REPAGLINIDE (0.45 µg)
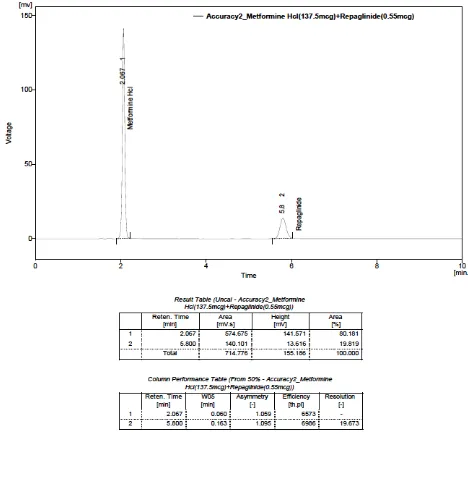
25. ACCURACY– TRIAL- I(Solution-2): METFORMIN
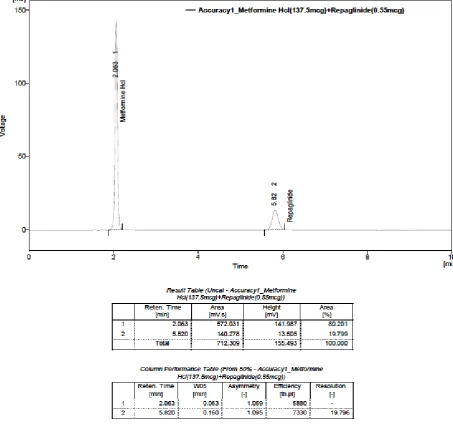
HYDROCHLORIDE (137.5 µg) AND REPAGLINIDE (0.55 µg)
26. ACCURACY – TRIAL- II(Solution-2): METFORMIN
HYDROCHLORIDE (137.5 µg) AND REPAGLINIDE (0.55 µg)
27. ACCURACY – TRIAL- III(Solution-2): METFORMIN
FIGURE
No. CONTENTS
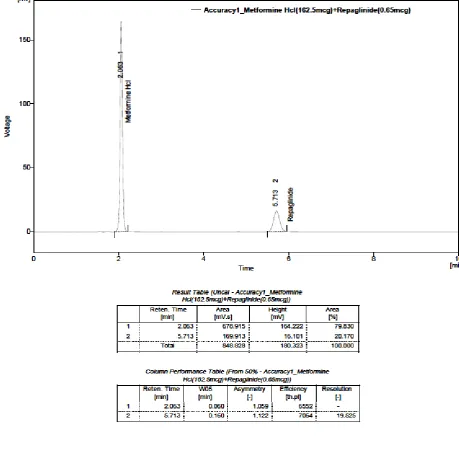
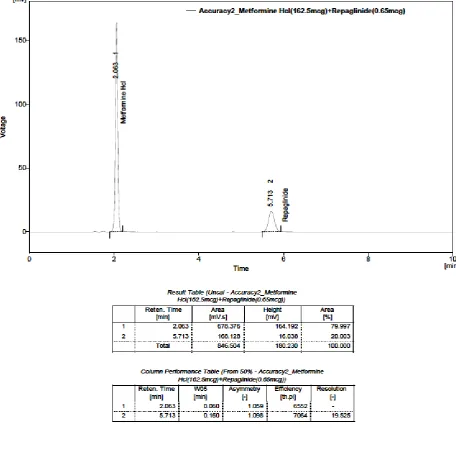
28. ACCURACY – TRIAL- I(Solution-3): METFORMIN
HYDROCHLORIDE (162.5 µg) AND REPAGLINIDE (0.65 µg)
29. ACCURACY – TRIAL- II(Solution-3): METFORMIN
HYDROCHLORIDE (162.5 µg) AND REPAGLINIDE (0.65 µg)
30. ACCURACY – TRIAL- III(Solution-3): METFORMIN
HYDROCHLORIDE (162.5 µg) AND REPAGLINIDE (0.65 µg)
31.
ACCURACY CHROMATOGRAM – TRIAL- IV(Solution-3): METFORMIN HYDROCHLORIDE (162.5 µg) AND
REPAGLINIDE (0.65 µg)
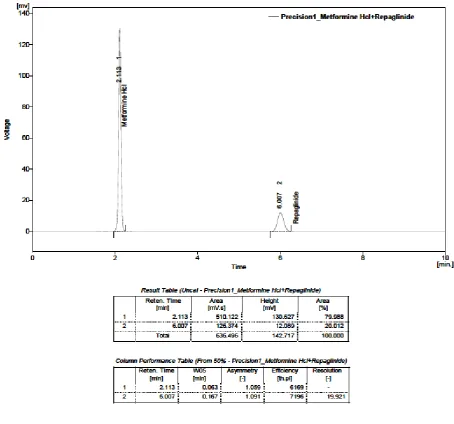
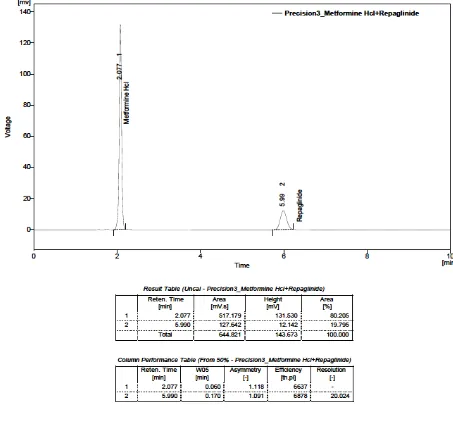
32. PRECISION– I: METFORMIN HYDROCHLORIDE (125 µg) AND
REPAGLINIDE (0.5 µg)
33. PRECISION– II: METFORMIN HYDROCHLORIDE (125 µg)
AND REPAGLINIDE (0.5 µg)
34. PRECISION– III: METFORMIN HYDROCHLORIDE (125 µg)
AND REPAGLINIDE (0.5 µg)
35. PRECISION– IV: METFORMIN HYDROCHLORIDE (125 µg)
AND REPAGLINIDE (0.5 µg)
36. PRECISION– V: METFORMIN HYDROCHLORIDE (125 µg)
AND REPAGLINIDE (0.5 µg)
37. RUGGEDNESS – I: METFORMIN HYDROCHLORIDE (125 µg)
AND REPAGLINIDE (0.5 µg)
38. RUGGEDNESS– II: METFORMIN HYDROCHLORIDE (125 µg)
AND REPAGLINIDE (0.5 µg)
39. METHOD PRECISION– I: METFORMIN HYDROCHLORIDE
(125 µg) AND REPAGLINIDE (0.5 µg)
40. METHOD PRECISION– II: METFORMIN HYDROCHLORIDE
(125 µg) AND REPAGLINIDE (0.5 µg)
41. METHOD PRECISION– III: METFORMIN HYDROCHLORIDE
(125 µg) AND REPAGLINIDE (0.5 µg)
FIGURE
No. CONTENTS (125 µg) AND REPAGLINIDE (0.5 µg)
43. METHOD PRECISION– V: METFORMIN HYDROCHLORIDE
(125 µg) AND REPAGLINIDE (0.5 µg)
44. ROBUSTNESS– I: METFORMIN HYDROCHLORIDE (125 µg)
AND REPAGLINIDE (0.5 µg) AT 228 nm
45. ROBUSTNESS– II: METFORMIN HYDROCHLORIDE (125 µg)
AND REPAGLINIDE (0.5 µg) AT 232 nm
46. ROBUSTNESS– III: METFORMIN HYDROCHLORIDE (125 µg)
AND REPAGLINIDE (0.5 µg) 1.1 ml flow
47. ROBUSTNESS M– IV: METFORMIN HYDROCHLORIDE (125
µg) AND REPAGLINIDE (0.5 µg) 0.9 ml flow
48. ASSAY FOR STANDARD – I: METFORMIN
HYDROCHLORIDE (125 µg) AND REPAGLINIDE (0.5 µg)
49. ASSAY FOR STANDARD– II: METFORMIN
HYDROCHLORIDE (125 µg) AND REPAGLINIDE (0.5 µg)
50. ASSAY FOR STANDARD– III: METFORMIN
HYDROCHLORIDE (125 µg) AND REPAGLINIDE (0.5 µg)
51. ASSAY FOR SAMPLE – I: METFORMIN HYDROCHLORIDE
(125 µg) AND REPAGLINIDE (0.5 µg)
52. ASSAY FOR SAMPLE – II: METFORMIN HYDROCHLORIDE
LIST OF TABLES
TABLE NO.
CONTENTS
1. SOLUBILITY OF DRUGS IN DIFFERENT SOLVENTS
2. OPTIMIZED CHROMATOGRAPHIC CONDITION
3. SYSTEM SUTABILITY PARAMETERS
4. LINEARITY DATA FOR REPAGLINIDE
5. LINEARITY DATA FOR METFORMIN HCL
6. ACCURACY STUDIES FOR REPAGLINIDE
7. ACCURACY STUDIES FOR METFORMIN HCl
8. ROBUSTNESS: EFFECT OF FLOW RATE
9. ROBUSTNESS: CHANGE IN WAVELENGTH
10. PRECISION DATA FOR METFORMIN HCL AND REPAGLINIDE
11. RUGGEDNESS FOR REPAGLINIDE AND METFORMIN HCl
12. METHOD PRECISION FOR REPAGLINIDE AND METFORMIN HCl
1. INTRODUCTION
1.1 ANALYTICAL CHEMISTRY
Analytical chemistry is a branch of chemistry that deals with the separation,
identification and determination of components in a sample. It is the science of
making quantitative measurements, which requires background knowledge of
chemical and physical concepts. The use of instruments is an exciting and fascinating
part of chemical analysis that interacts with all areas of chemistry and with many
other areas of pure and applied science. Analytical instruments plays an important
role in the production and evaluation of new products, protection of consumers and
environment, it also provides the lower detection limits required to assured safe foods,
water and air1. Traditionally, analytical chemistry can be classified into two types
Qualitative analysis
Quantitative analysis
Qualitative analysis gives an indication of the identity of the chemical species in the
sample and quantitative analysis determines the amount of one or more of these
components2.
Classification of analytical techniques3, 4
The analytical techniques can be classified on the basis of type of properties in the
following way.
i) Chemical methods of analysis
ii) Electrical methods of analysis
iv) Nuclear radiation methods of analysis
v) Thermal methods of analysis
vi) Separation methods
These methods can further be classified into different techniques depending on the
measurement of a characteristic property based on either the nature or the amount of
the desired constituent of the sample.
i) Chemical methods of analysis
These methods are based on the primary role of a chemical reaction. In these methods,
the direct measurement of mass is carried out by one of the two procedures, i.e. by
weighing or by measuring volume.
Gravimetry
Volumetry
ii) Electrical methods of analysis
An electrical method of analysis also known as electroanalytical method can be
defined as one, in which an electrochemical property of a solution is measured. A
classification of electroanalytical methods can be made by measuring different
electrical quantities, such as, potential, current, quantity of current, resistance and
dielectric constant. These methods have different names on the basis of the
measurement of these quantities and are stated below.
Potentiometry
Amperometry
Voltammetry
Conductometry and High Frequency Methods
iii) Optical methods of analysis
These methods are now called as spectroscopic methods of analysis. In these methods
the first instruments were developed for use of visible region and therefore called
optical methods.
The important spectroscopic methods are mentioned below.
Emission Spectroscopy
Absorption Spectroscopy
Ultraviolet and Visible Absorption Spectroscopy
Infrared Absorption Spectroscopy
Photofluorometry
Turbidimetry and Nephelometry
Raman Spectroscopy
iv) Nuclear methods
Some techniques which can provide analytical information based on nuclear
properties. Each of these properties or combinations of them can be studied suitably
by analytical chemistry. Nuclear method can be group into following.
Radiochemical Methods
Radiometric Methods
Isotopic Dilution Methods
Activation Analysis
Mossbauer Spectroscopy
Nuclear Magnetic Resonance Spectroscopy
v) Thermal methods of analysis
In thermal methods of analysis some property of the system is measured as a function
of temperature. In some of these methods the temperature is used as an independent
variable while in some others as a dependent variable say time. The recorded curves
are helpful in interpreting the thermal behaviour of the sample. Some commonly used
methods are:
Thermogravimetric Analysis (TGA)
Derivative thermo-gravimetry (DTG)
Differential Thermal Analysis (DTA)
Differential Scanning Calorimetry (DSC)
Thermometric Enthalpy Titrations (TET)
vi) Separation methods
In separations, in general by appropriate reactions, the desired constituent is brought
into one phase and interfering elements are brought into another and the phases being
separated by physical processes. Some methods of separation are the following:
A. Classical methods
Precipitation
Distillation
Sublimation
Formation of complexes
B. Modern methods
Chromatography
Solvent extraction
Ion-Exchange
1.3 Important considerations in analytical methods5
The instrument most visible and exciting element of the analytical method,
only one component of the total analysis
The analyst should determine the nature of the sample, the end use of the
analytical results, the species to be analyzed.
Quantitative information may include elemental composition, oxidation state,
functional groups, major components, minor components, complete identification in
the given sample.
Quantitative data include accuracy and precision, range of expected analyte.
Methods such as controlling the atmosphere to which the sample is exposed,
controlling the temperature of the sample, buffering the pH of sample solutions.
CHROMATOGRAPHY6
Chromatography is relatively a new technique which was first invented by M. Tswett,
a botanist in 1906 in Warsaw. Chromatography is a physical separation method in
which the components of a mixture are separated by differences in their distribution
between two phases, one of which is stationary (stationary phase) while the other
(mobile phase) moves through it in a definite direction. The substances must interact
CLASSIFICATION OF CHROMATOGRAPHY
1.2. HIGH PERFORMANCE LIQUID CHROMATOGRAPHY7
High-performance liquid chromatography (HPLC) is a form of liquid chromatography
used to separate compounds that are dissolved in solution. High performance liquid
chromatography is basically a highly improved form of column chromatography.
Instead of a solvent being allowed to drip through a column under gravity, it is forced
through under high pressures of up to 400 atmospheres. The compounds are separated
Chromatography
Partition
Adsorption
Ion-exchange
Gel
filtration
Affinity
HPLC
Paper
chromatography
Thin layer
chromatography
Gas-liquid chromatography
Column chromatographay
Ascending
Descending
Circular or Radial
by injecting a plug of the sample mixture onto the column. The different components
in the mixture pass through the column at different rates due to differences in their
partitioning behavior between the mobile liquid phase and the stationary phase.
Most of the drugs in multicomponent dosage form can be analyzed by HPLC method
because of the several advantages like rapidity, specificity, accuracy, precision, and
ease of automation in these methods. HPLC Method eliminates tedious extraction and
isolation procedures.
Principle
The principle involved in HPLC is separation of compounds in a mixture more
efficiently and also quickly than that of traditional column chromatography. The
separation of compounds is due to their relative differences in travel through the
column on application of pressure exerted through mobile phase or carrying liquid.
The compounds of the mixture travel with different rates due to their relative affinities
with the solvent and stationary phase. Compounds with higher affinity towards
stationary phase of the column travels slowly and vice-versa. The above principle is
similar to that of column chromatography but in HPLC, The separation is more
effective due to greater surface area achieved due to very small particle size of
stationary phase in comparison to that used in column chromatography. This decrease
in particle size increases has disadvantage that it proportionately enhances the flow
time and run time due to increased surface area. To minimize this obstacle the high
pressure is applied to the flow of mobile phase through the column by use of pumps.
All factor affecting separation on liquid column chromatography apply to this
techniques also, e.g. Plate height, sample, distribution between the stationary phase
and liquid phases various methods of development of the chromatograms (elution,
Instrumentation
The HPLC System consist of
1. A solvent reservoir and mixing system
2. A high pressure pump.
3. A sample inlet pump.
4. A column.
5. A detector and recording unit.
Fig: 1 – Schematic representation of High performance liquid chromatography
Apparatus and materials
1. The column.
2. Column packing
3. Column packing procedure.
4. Chromatography solvent (Mobile Phase)
5. Pumping systems.
6. Detector systems.
Different modes of separations in HPLC
Normal Phase Mode:
In these the stationary phase is polar and the mobile phase is non-polar in nature. In
these techniques, non-polar compounds travel faster and are eluted first. This is
because of the lower affinity between the non-polar compounds and the stationary
phase.
Reversed Phase Mode:
The stationary phase is Non-polar Hydrophobic packing with Octyl or Octa decyl
functional group bounded to silica gel and the mobile phase is polar solvent. An
aqueous mobile phase allows the use of secondary solute chemical equilibrium to
control retention and selectivity. The polar compounds gets eluted first in this mode
and non-polar compounds are retained for longer times. As most of the
pharmaceutical drugs are polar in nature, they are not retained for longer times and
hence elute faster. The different columns used are Octa Decyl Silane (C18), octa silane
(C8), tetra silane (C4) etc.
Ion Exchange Chromatography
The stationary phase contains ionic groups like NR3+ or SO3- which interact with the
ionic groups of the sample molecules. This is suitable for the separation of charged
molecules only.
Affinity Chromatography:
In these techniques highly specific biochemical interactions are used for separation.
The stationary phase contains specific group of molecules which can absorb the
Size Exclusion Chromatography:
It separates molecules accordingly to their molecular mass. Largest molecules are
eluted first and the smallest molecules last
Applications
High pressure liquid chromatography more sensitive detectors, if promises to
become more and more important. HPLC offers the advantages of speed, resolution
and sensitivity. The column may be reversed. It is especially useful for separating the
high molecular weight compounds which have either a two pressure or undergo
pyrolysis when subjected to the higher required temperatures of has chromatography.
The chromatography of separation of barbiturates by HPLC method.
The wide applicability speed and selectivity of HPLC have resulted in it
becoming the most popular form of chromatography virtually all type of biological
molecule have been purified.
RP-HPLC is particularly useful for the separation of the polar components
ANALYTICAL METHOD DEVELOPMENT
Methods are developed for new products, when no official methods are available.
Alternate methods for existing products are developed to reduce the cost and time for
better precision and ruggedness. Trial runs are conducted, method is optimized and
validated8.
Steps of method development9:
Documentation starts at the very beginning of the development process, a system for
full documentation of the development studies must be established. All data relating
to the studies must be recorded in laboratory notebook or electronic database.
Analyte standard characterization:
All known information about the analyte and its structure is collected i.e., physical
and chemical properties, toxicity, purity, hygroscopic nature, solubility and stability.
The standard analyte (100% purity) is obtained. Necessary arrangement is made for
the proper storage (refrigerator, desiccators and freezer). When multiple components
are to be analyzed in the sample matrix, the number of components is noted, data is
assembled and the availability of standards for each one is determined. Only those
methods (MS, GC, HPLC etc.,) that are compatible with sample stability are
considered.
2. Method requirements:
The goals or requirements of the analytical method that need to be developed are
considered and the analytical figures of merit are defined. The required detection
3. Literature search and prior methodology:
The literature for all type of information related to the analyte is surveyed. For
physical and chemical properties, solubility and relevant analytical methods. Books,
periodicals, chemical manufacturers and regulatory agency compendia such as
USP/NF, AOAC and ASTM publications are convenient.
4. Choosing a method:
Using the information in the literatures and prints, methodology is adopted. The
methods are modified wherever necessary. Sometimes it is necessary to acquire
additional instrumentation to reproduce, modify, improve or validate existing methods
for in-house analytes and samples.If there is no prior methods for the analyte in the
literature, from analogy, the compounds that are similar in structure and chemical
properties are investigated and are worked out. There is usually one compound for
which analytical method already exist that is similar to the analyte of interest.
5. Instrumental setup and initial studies:
The required instrumentation is setup. Installation, operational and performance
qualification of instrumentation using laboratory standard operating procedures
(SOP’s) are verified. Always new consumables (e.g. solvents, filters and gases) are
used, for example, method development is never started, on a HPLC column that has
been used earlier. Analyte standard in a suitable injection/ introduction solution and in
known concentrations and solvents are prepared. It is important to start with an
authentic, known standard rather than with a complex sample matrix. If the sample is
actual sample. Analysis is done using analytical conditions described in the existing
literature.
6. Optimization:
During optimization one parameter is changed at a time, and set of conditions are
isolated, rather than using a trial and error approach. Work has been done from an
organized methodical plan, and every step is documented (in a lab notebook) in case
of dead ends.
7. Documentation of analytical figures of merit:
The originally determined analytical figures of merit limit of quantitation (LOD),
limit of detection(LOQ), linearity, time per analysis, cost, sample preparation etc., are
documented.
8. Evaluation of method development with actual samples:
The sample solution should lead to unequivocal, absolute identification of the analyte
peak of interest apart from all other matrix components.
9. Determination of percent recovery of actual sample and demonstration of
quantitative sample analysis:
Percent recovery of spiked, authentic standard analyte into a sample matrix that is
shown to contain no analyte is determined. Reproducibility of recovery (average +/-
standard deviation) from sample to sample and whether recovery has been optimized
has been shown. It is not necessary to obtain 100% recovery as long as the results are
reproducible and known with a high degree of certainity. The validation of analytical
successful completion of such studies is a basic requirement for determining whether
a method suitable for its intended application.
ANALYTICAL METHOD VALIDATION
Validation10, 11
Validation of an analytical method is the process by which it is established, by laboratory
studies, that the performance characteristics of the method meet the requirements for the
intended analytical applications.
Reasons for validation
There are two important reasons for validating assays in the pharmaceutical industries. The
frst, and by for the most important, is that assay validations is an integral part of the quality
control system. The second is that current good manufacturing practice regulation requires
assay validation.
Typical validation characteristics
Accuracy
Precision
Range
Specificity
Linearity
Detection Limit
Quantification Limit
Ruggedness
Accuracy
The accuracy of an analytical procedure expresses the closeness of agreement
between the value which is accepted either as a conventional true value or on an accepted
reference value and the value found.
Precision
It expresses as degree of agreement among individual test results when procedure/method
is applied to a homogeneous sample – usually expressed as SD/RSD. It is a measure of
degree of repeatability or reproducibility under normal conditions. A more comprehensive
definition proposed by the ICH divides precision into three types
1. Repeatability.
2. Intermediate precision.
3. Reproducibility.
Range
The range of a method can be defined as the upper and lower concentrations for
which the analytical method has adequate accuracy, precision and linearity. The range of
concentrations examined will depend on the type of method and its use.
Specificity
Ability of the method to measure accurately and specifically the analyte of interest in
presence of matrix and other components likely to be present in the sample matrix and
impurities, degradation products and other related substances. For this, one may compare
the test results of analysis of samples containing other ingredients/ impurities / degradation
products / related substances/placebo ingredients with those obtained from analysis of
sample without these, i.e., the method must allow distinct analytical measurement of
If the impurities/degradation products or potential contaminants are not available, one can
apply a proposed method to the strained and stressed (heat, light, humidity) samples.
Degree of agreement among results will explain specificity of the method.
If the impurities/degradation products are not available, one may carryout additional purity
tests by chromatography-HPLC/HPTLC.
Linearity
The linearity of an analytical procedure is its ability to obtain test results, which are
directly proportional to the concentration of analyte in the sample. Linearity can be
assessed by performing single measurements at several analyte concentrations. A linearity
correlation coefficient above 0.999 is acceptable for most methods, especially for major
components in assay methods. The range of an analytical procedure is the interval between
the upper and lower concentration of analyte in the sample.
Detection limit
The Detection Limit of an individual analytical procedure is the lowest amount of analyte
in a sample which can be detected but not necessarily quantitated as an exact value. The
detection limit (LOD) may be expressed as
LOD = 3.3σ S Where,
= the standard deviation of the response.
S = the slope of the calibration curve (of the analyte).
Quantification limit
LOQ is defined as the lowest concentration of the substance (analyte) in a sample that
can be estimated quantitatively with acceptable precision, accuracy and reliability by
a given method under stated experimental conditions. Quantification Limit (LOQ)
LOQ = 10 S
Where,
= the standard deviation of the response.
S = the slope of the calibration curve (of the analyte).
Ruggedness
It is the measure of the capacity of the analytical method to remain unaffected
by small but deliberate variations in procedure. It provides an indication about
variability of the method during normal laboratory conditions.
Robustness
The concept of robustness of an analytical procedure has been defined by the
ICH as ―a measure of its capacity to remain unaffected by small, but deliberate
variations in method parameters‖. The most important aspect of robustness is to
develop methods that allow for expected variations in the separation parameters.
System suitability
System suitability is the checking of a system to ensure system performance
before or during the analysis of unknowns. Before performing any validation
experiment, you should establish that the HPLC and the procedure are capable of
providing data of acceptable quality. These tests are to verify that the resolution and
repeatability of the system are adequate for the analysis to be performed. It is based
on the concept that equipment, electronics, analytical operations and sample constitute
System suitability parameters and recommendations
S. No Parameters Recommendations
1 Theoretical plates (N) >2000
2 Tailing factor (T) ≤ 2
3 Resolution (Rs) > 2 between peak of interest and the closest
eluting potential interference
4 Repeatability RSD ≤ 1% for N ≥5 is desirable
5 Capacity factor (k1) > 2.0
6 Relative retention Not essential as long as the resolution is stated
System suitability parameters12
System suitability testing is an integral part of many analytical procedures. The tests
are based on the concept that the equipment, electronics, analytical operations, and
samples to be analyzed constitute an integral system that can be evaluated as such.
System suitability test parameters to be established for a particular procedure depend
on the type of procedure being validated.
The parameters that are affected by the changes in chromatographic conditions are,
Column capacity factor (KA)
Resolution (Rs)
Selectivity ()
Column efficiency (N) and
Peak asymmetry factor (As)
i)Column capacity factor (KA)
The retention of a drug with a given packing material and eluent can be expressed as
column length and column diameter. The retention is best described as a column
capacity ratio (K), which is independent of these factors. The column capacity ratio of
a compound (A) is defined as
0 0 A 0 0 A A
t
t
t
V
V
V
K
Where,
VA = Elution volume of A
V0 = Elution volume of a non retained compound (void volume).
ii) Resolution (Rs)
The resolution, Rs of two neighboring peaks is defined by the ratio of the distance
between the two peak maxima. It is the difference between the retention times of two
solutes divided by their average peak width. For baseline separation, the ideal value of
Rs is 2.0. It is calculated by using the formula,
)
W
W
(
5
.
0
Rt
Rt
R
2 1 1 2 f
Where,Rt1 and Rt2 are the retention times of components 1 and 2
W1 and W2 are peak widths of components 1 and 2.
iii) Selectivity ()
The selectivity (or separation factor), , is a measure of relative retention of two
components in a mixture. The ideal value of selectivity is 2. It can be calculated by
using the formula,
Where, V0 is the void volume of the column and V2 and V1 are the retention
volumes of the second and the first peak, respectively.
iv) Column efficiency
Efficiency, N, of a column is measured by the number of theoretical plates per meter.
It is a measure of band spreading of a peak. Smaller the band spread, higher is the
number of theoretical plates, indicating good column and system performance.
Columns with N ranging from 5,000 to100,000 plates/meter are ideal for a good
system. Efficiency is calculated by using the formula,
2 2 16 W Rt N
Where, Rt is the retention time and W is the peak width.
v) Peak asymmetry factor (As)
Peak asymmetry factor, As can be used as a criterion of column performance. The
peak half width b of a peak at 10 % of the peak height, divided by the corresponding
front half width a gives the asymmetry factor.
vi) Tailing factor (T)
A measure of the symmetry of a peak.
T = W0.05 / 2f
Where,
W0.05 -peak width at 5% height
f -distance from peak front to apex point at 5% height.
The accuracy of quantification decreases with increase in peak tailing because
of the difficulties encountered by the integrator in determining where/when the peak
ends and hence the calculation of the area under the peak.
STATISTICAL PARAMETERS13, 14
Regression equations
The linear relationship is characterized by attendancy of the points of the scattered
diagram to cluster along a straight line, known as the regression line.
Y= a + bX
It is used to describe the dependence of one characteristic (Y) up on the other
characteristic (X), both X,Y represent values of two characters, a and b are two constants it
will be evident that two regression lines can be computed for every set of data-one each to
describe the dependence of one character to another. b is known as regressive coefficients
which show change expected in Y for unit change in X, it is dependence of Y & X; b is the
regressive coefficient of Y& X.
The regressive coefficient of b is estimated,
b = the slope of the regression line and is calculated by this formula
x = an arbitrarily chosen value of the predictor variable for which the corresponding value
of the criterion variable is desired.
Correlation coefficient
A measure of the strength of the relationship between two variables is provided by the
coefficient of correlation, denoted by r, if the relationship between the two variables is of
the linear form. It is also called the coefficient of linear correlation.
Standard deviation
It is the square root of the average of the squared deviations of the observations. From the
arithmetic mean, it is used for measures of dispersion.
Standard Deviation =
1 )
( 2
n x x
R.S.D (%) = 100 x S.D
Where,
= Sum of observations
x = Mean or arithmetic average (x / n)
x = Individual observed value
x – x = Deviation of a value from the mean
AIM AND SCOPE OF THE WORK
The pharmaceutical formulations have gained a lot of importance in today’s world
due to greater patient acceptability, increased potency, multiple action, fewer side effects
and quick action. Simultaneous analysis procedures are now being used more frequently for
analysis of drugs in pharmaceutical formulations due to their advantages i.e. less time
consuming, economical, accurate and precise.
The aim is development and validation of Metformin Hydrochloride (250mg) and
Repaglinide (1mg) using parameters such precision, accuracy, linearity, specificity,
robustness, ruggedness. Standard analytical procedure for newer drugs of formulation may
not be available in pharmacopoeias; hence it is essential to develop newer analytical
methods which are simple, accurate, precise, specific, economic, linear and rapid.
From the literature review it was found that a very few analytical methods have
been reported for the simultaneous estimation of metformin hydrochloride and repaglinide
by RP-HPLC.
Therefore in the proposed project, a successful attempt has been made to develop
simple, accurate, economic and rapid methods for the estimation of tablet formulation and
to validate the methods, as a result three simple, economic, precise and accurate methods
were developed and validated by Reverse Phase High performance Liquid Chromatography
The method has been validated as per the guidelines given by ICH requirements to
assure that the method consistently meets the predetermined specifications and quality
PLAN OF WORK
Literature survey
Through survey available for metformin hydrochloride and repaglinide, regarding
their physical and chemical properties, pharmacology, pharmacokinetics and reported
analytical methods, forms the basis for the development of new RP-HPLC method for
simultaneous analysis of these drugs were designed.
Procurement of samples
Procurement of the drugs specimens draws utmost priority. Both the drugs obtained
from Chandra laboratories as samples and characterized by their melting points.
Development of sample
1. Selection of solvent system
2. Selection of mobile phase
3. Simultaneous method development for assay
4. Analysis of the commercially available formulations.
Analytical validations of development method according to ICH guideline parameters,
which are selected for method validation, are as follows-
1. Precision
2. Linearity
3. Accuracy
4. Robustness
5. Ruggedness
1. METFORMINE HYDROCHLORIDE15
Molecular structure:
NH
N H3C
CH3 NH2 H N NH H Cl .
Molecular weight : 165.62
Molecular formula : C4H12N5Cl
Chemical name : 1-carbamimidamido-N,N-dimethylmethanimidam
HCl
Category : Hypoglycemic agent
Description : A white crystalline powder and highly hygroscopic
Solubility : Freely soluble in water, slightly soluble in alcohol,
Practicallyinsoluble in acetone, methylene chloride
Melting point : 2220 C-2260 C
Mechanism of action:
Metformin's mechanisms of action differ from other classes of oral antihyperglycemic
agents. Metformin decreases blood glucose levels by decreasing hepatic glucose
production, decreasing intestinal absorption of glucose, and improving insulin
sensitivity by increasing peripheral glucose uptake and utilization. These effects are
mediated by the initial activation by metformin of AMP-activated protein kinase, a
liver enzyme that plays an important role in insulin signaling, whole body energy
balance, and the metabolism of glucose and fats. Activation of AMP-activated protein
kinase is required for metformin's inhibitory effect on the production of glucose by
activity in skeletal muscle. AMP-activated protein kinase is known to cause GLUT4
deployment to the plasma membrane, resulting in insulin-independent glucose uptake.
Pharmacodynamics:
Metformin is an oral antihyperglycemic agent that improves glucose tolerance in
patients with NIDDM, lowering both basal and postprandial plasma glucose.
Metformin is not chemically or pharmacologically related to any other class of oral
antihyperglycemic agents. Unlike sulfonylureas, metformin does not produce
hypoglycemia in either patients with NIDDM or healthy subjects and does not cause
hyperinsulinemia. Metformin does not affect insulin secretion.
Pharmacokinetics:
Metformin is metabolized. It is cleared from the body by tubular secretion and
excreted unchanged in the urine, metformin id undetectable in blood plasma within 24
hrs of a single oral dose.
Adverse effects: Nausea, vomiting, anorexia, lactic acidosis, tolerance.
Contraindications: Diabetic ketoacidosis, cardiovascular collapse, renal failure,
hepatic failure.
Special precautions: Alcohols not to be taken as an interaction occurs with
metformin
Half-life: 6.2 hours
Dosage
For adults, the initial dose is 250 mg twice or thrice a day with meals and increases
gradually at 2 weeks intervals.
Storage
2. REPAGLINIDE16 Molecular structure: O OH N H O N O
Molecular formula : C27H36N2O4
Molecular weight : 452.58
Chemical name : 2-ethoxy-4-({[(1S)-3-methyl-1-[2-(piperidin-
yl)phenyl]butyl]carbamoyl}methyl)benzoic acid
Category : Hypoglycemic acid
Description : A white crystalline powder and highly hygroscopic
Solubility : Freely soluble in methanol.
Melting point : 130-1310 C
Mechanism of action:
Repaglinide activity is dependent on the presence functioning β cells and glucose. In
contrast to sulfonylurea insulin secretatogogues, repaglinide has no effect on insulin
release in the absence of glucose. Rather, it potentiates the effect of extracellular
glucose on ATP-sensitive potassium channel and has little effect on insulin levels
between meals and overnight. As such, repaglinide is more effective at reducing
postprandial blood glucose levels than fasting blood glucose levels and requires a
blood glucose are observed. The insulinotropic effects of repaglinide are highest at
intermediate glucose levels (3 to 10 mmol/L) and it does not increase insulin release
already stimulated by high glucose concentrations (greater than 15 mmol/L). Repaglinide appears to be selective for pancreatic β cells and does not appear to
affect skeletal or cardiac muscle or thyroid tissue.
Pharmacodynamic:
Insulin secretion by pancreatic β cells is partly controlled by cellular membrane
potential. Membrane potential is regulated through an inverse relationship between
the activity of cell membrane ATP-sensitive potassium channels (ABCC8) and
extracellular glucose concentrations. Extracellular glucose enters the cell via GLUT2
(SLC2A2) transporters. Once inside the cell, glucose is metabolized to produce ATP.
High concentrations of ATP inhibit ATP-sensitive potassium channels causing
membrane depolarization. When extracellular glucose concentrations are low,
ATP-sensitive potassium channels open causing membrane repolarization. High glucose
concentrations cause ATP-sensitive potassium channels to close resulting in
membrane depolarization and opening of L-type calcium channels. The influx of
calcium ions stimulates calcium-dependent exocytosis of insulin granules.
Repaglinide increases insulin release by inhibiting ATP-sensitive potassium channels
in a glucose-dependent manner.
Pharmacokinetic:
Absorption- Rapid and complete; peak plasma concentrations after 1 hour (oral).
Distribution-Protein-binding :> 98%.
Conjugation with glucuronic acid.
Excretion-Urine (about 8%); feaces (90%)
Adverse effects:
Hypoglycaemia, nausea, diarrhoea, constipation, vomiting, dyspepsia, arthralgia,
Sinusitis, rhinitis, back pain; rash, pruritus, urticaria; visual disturbances.
Contraindications
Diabetic ketoacidosis; severe hepatic impairment, type 1 diabetes; hypersensitivity.
Lactation.
Special precautions
Myocardial infarction, coma, trauma during surgery, elderly, malnourished and
debilitated patients. Hepatic or severe renal impairment. Pregnancy.
Half-life: 1 hour
Dosage
Adult: Usual initial dose: 0.5 mg, taken within 30 minutes of main meals. Initial doses
of 1 or 2 mg may be used in patients who have had previous hypoglycemic treatment.
May adjust dose at intervals of 1-2 weeks, up to 4 mg before meals.
Storage:
LITERATURE REVIEW
Reported methods for Metformin hydrochloride
1) Bhaskar Laxmanrao Kolte et al17 A simple, rapid, and precise reversed-phase liquid
chromatographic method has been developed for the simultaneous determination of
metformin in combination with glimepride. Under the developed conditions, good
separation of the analytes was achieved in short analysis time. Several parameters
affecting the separation of the analytes were studied, including pH and the
concentration of SDS. The method is validated and shown to be linear in the range of 25 μg/mL to 150 μg/mL for metformin and 0.1 μg/mL to 0.6 μg/mL for glimepride.
The method is applied for the analysis of these analytes in commercially available
tablets.
2) Aryane MS et al., 200618 and coworkers carried out the development and validation
of RP-HPLC method for the analysis of Metformin. In this a simple RP-HPLC
method was developed for the quantification of Metformin hydrochloride in raw
materials and in pharmaceutical preparations. Analytical Reverse Phase Column
C(18) was used and the mobile phase consisted of methanol-water(30/70v/v) the
analytes were then determined by using UV detector. This method was validated
according to ICH guidelines. The proposed method is rapid, accurate, economical and
selective and it was used for the quantitative analysis of metformin in Neodipar
tablets because of its sensitivity and reproducibility.
3) Sahoo P.K. et al., 200819, A high performance reverse phase liquid chromatographic
procedure is developed for simultaneous estimation of metformin hydrochloride and
pioglitazone hydrochloride in combined tablet dosage form. The mobile phase used
was a combination of acetonitrile:water:acetic acid (60:40:0.3) and the pH was
was carried out at 230 nm and a flow rate employed was 1 ml/min. Linearity was
obtained in the concentration range of 0.015 to 0.120 mg/ml of pioglitazone
hydrochloride and 0.5 to 4.0 mg/ml of metformin hydrochloride with a correlation
coefficient of 0.9992 and 0.9975. The results of the analysis were validated
statistically and recovery studies confirmed the accuracy and precision of the
proposed method.
4) Sadaf Sayeed et al., 200920, A simple, accurate and economic simultaneous equation
method has been described for the simultaneous determination of metformin and
pioglitazone in tablet dosage formulations. Metformin and pioglitazone showed
absorption maxima at 233.5 nm and 266.5 nm respectively in 0.1 M NaOH prepared
in glass double distilled water. The method allows rapid analysis of binary
pharmaceutical formulations with high degree of accuracy and precision. Both the
drugs showed linearity with absorbance in the concentration ranges, 5-40 mg / ml for
Metformin and 10-80 mg / ml for pioglitazone. The results of the analysis have been
validated statistically and by recovery studies. The method was also extending for
dissolution studies.
5) Mousumi kar et al., 200921, simple, accurate, economical and reproducible HPLC
method has been developed for quantitative estimation of metformin hydrochloride
from tablet dosage form and formulated microspheres. The developed HPLC method
is a reverse phase chromatographic method using phenomenex C18 column and
acetonitrile:phosphate buffer (65:35) pH adjusted to 5.75 with o-phosphoric acid as
mobile phase and glipizide as internal standard. The linearity was observed in
concentration range of 0-25 μg/ml for metformin hydrochloride. Results of analysis
6) Lakshmi K.S. et al.,200922, reported a simple, sensitive and rapid reverse phase high
performance liquid chromatographic method was developed for the estimation of
Metformin Hcl and Pioglitazone in pure and in pharmaceutical dosage forms. A
Gemini C18 column (150x4.6mm, 5μ) was used with a mobile phase containing a
mixture of Acetonitrile and Ammonium Acetate buffer (pH-3) in the ratio of 42: 58.
The flow rate was 0.3ml/min and effluents were monitored at 255nm and eluted at
5.17min and 8.1min .Calibration curve was plotted with a range from 0.5-50 μg/ml for
Metformin HCl and 0.3-30 μg/ml for Pioglitazone. The assay was validated for the
parameters like accuracy, precision, robustness and system suitability parameters. The
proposed method can be useful in the routine analysis for the determination of
metformin and pioglitazone in pharmaceutical dosage forms.
7) Onal A. et al, 200923, carried out spectrophotometric and HPLC determinations of
anti-diabetic drugs, Rosiglitazone maleate and Metformin hydrochloride, in pure form
and in pharmaceutical preparations. In this method he developed three Spectrometric
method and one HPLC method for analysis of Anti-diabetic drugs. Two
Spectrometric methods were based on the reaction of rosiglitazone with
2,3-dichloro-5,6-dicyano-1,4-benzoquinone and bromocresol green, the third Spectrophotometric
method consists of a zero-crossing first-derivative Spectrophotometric method for
simultaneous analysis of RSG and metformin in tablets. The fourth method is a rapid
stability indicating HPLC method. The proposed method was successfully applied to
the tablet analysis.
8) Narsimha rao Doredla et al, 201124 developed a simultaneous estimation of
Metformin HCl, pioglitazone HCl and glibenclamide in pure and tablet dosage form
by using methanol as a solvent. Metformin HCl, pioglitazone HCl and glibenclamide
1700, capable of multicomponent analysis, was used for quantitation. This method is
based on a multiwavelength spectroscopic method. Validation study reveals that the
methods are specific, accurate, precise, and reproducible. All three drugs obey Beer's
law in the concentration ranges used for the methods. Validation studies are
statistically significant as all the statistical parameters are within the acceptance range
for both accuracy and precision study. The methods are simple, rapid accurate,
precise, reproducible, and economic and can be used for routine quantitative analysis
of Metformin HCl, pioglitazone HCl and glibenclamide in pure and tablet dosage
form.
9) Serasiya et al., 201125, developed a simple, precise, specific and accurate reverse phase HPLC method has been for the simultaneous estimation of enalapril maleate
(EM) and metformin hydrochloride (MT). The chromatographic separation was
achieved on phenomenex Luna C18 (25 cm × 4.6 mm i.d., 5 µ) column using
PDA detector. The mobile phase consisting of mixture of acetonitrile - 10mM
NaH2PO4 (pH 2.2, adjusted with 80 % o-phosphoric acid) (30:70, v/v) at a flow rate of
1.0 ml/min was used. The method was validated according to the ICH guidelines with
respect to specificity, linearity, accuracy, precision and robustness.
10) Angshuman Biswas et al., 201126, A new simple, fast accurate and reproducible
reverse phase high performance liquid chromatographic method has been developed
and validated for simultaneous estimation of Metformin Hydrochloride and
Glimepiride from tablet dosage form. The method was developed using Waters HPLC
system on C18 column (Spherisorb ODS 2: 250mm x 4.6 μm) using a mixture of
25mM Phosphoric Acid pH 3.0 (with KOH) and Acetonitrile (40:60 v/v) as mobile
phase in an isocratic elution mode at a flow rate of 1.00 ml/min at 40ºC with a load of
retention time of Metformin Hydrochloride and Glimepiride were found to be 3.20
min and 6.7 min respectively. The method was validated with respect to linearity,
robustness, precision and accuracy. The method had been successfully applied in
other pharmaceutical formulations of the same composition.
11) Bhaskar Reddy et al., 201127, Novel RP-HPLC method has been developed for
simultaneous determination of Meformin HCl, Glipizide and Repaglinide in dosage
forms. The separation was achieved on a 3.5-micron C18 column (150 X 4.6 mm)
using mobile phase consisting of buffer (1.0gm of Potassium dihydrogen phosphate in
1000mL, pH 3.0 with diluted orthophospharic acid .The flow rate was maintained at
1.0 ml/min. The detection of the constituents was done using UV detector at 210 nm.
The retention time of metformin, glipizide and repaglinide were approximately 1.49,
3.71 and 9.84 min respectively. Recovery study values of three actives were 103% to
99% respectively, relative standard deviation of less than 2%. Linear response
obtained for three actives correlation coefficient is not less than 0.999. The proposed
method was applied for
regular analysis and results found to be satisfactory.
12) Bhamare P.C. et al., 201128, reported a selective, precise, isocratic and accurate
stability indicating reverse phase high performance liquid chromatography method
have been developed for the simultaneous determination of Metformin hydrochloride
and Fenofibrate present in multicomponent dosage forms. The HPLC method was carried out on Inertsil octadecylsilane C18 (250 mm x 4.6 mm i.d., 5 μm particle size)
column. A mobile phase composed of acetonitrile - water (adjusted to pH 3 using
orthophosphoric acid) in proportion of 70:30 v/v, at flow rate of 1 ml/min was used
for the separation. Detection was carried out at 250nm. Method was validated
applied successfully to the analysis of cited drugs either in pure form or in
pharmaceutical formulations with good accuracy and precision. The method herein
described can be employed for quality control and routine analysis of drugs in
pharmaceutical formulations.
Reported methods for repaglinide
1) Venkatesh P. et al., 200629, this paper describes a convenient method for the
separation and simultaneous determination of six anti-diabetic drugs viz.,
glibenclamide, gliclazide, glipizide, pioglitazone, repaglinide and rosiglitazone in
pharmaceutical formulations. Also, the assay has been shown applied to support
quantification of the six anti-diabetic drugs in human plasma. The analytes were
either injected directly onto the column after suitable dilution (pharmaceutical
formulation analysis) or a simple extraction procedure, using acetonitrile, from human
plasma spiked with anti-diabetic drugs and internal standard (IS). Ternary gradient
elution at a flow rate of 1 mL/min was employed on an Intertisl ODS 3V column (4.6
x 250 mm, 5 microm) at ambient temperature. The mobile phase consisted of 0.01 m
formic acid (pH 3.0), acetonitrile, Milli Q water and methanol. Celecoxib was used as
an IS. The six anti-diabetic drugs were monitored at a wavelength of 260 nm. The
nominal retention times of glibenclamide, gliclazide, glipizide, pioglitazone,
repaglinide and rosiglitazone were 11.4, 13.3, 14.8, 17.6, 20.78, 22.1 and 25.4 min,
respectively. The assay developed for formulation analysis was found to be accurate
and precise. The calibration curves ranged from 0.1 to 100 microg/mL for all analytes
with the exception of GLB, where the range was 0.3-100 microg/mL. The plasma
assay was validated for parameters such as specificity, accuracy and extraction
recovery. The proposed method is simple, selective and can be extended for routine
2) Kaushal N. et al., 201030, Spectrofluorimetric and high-performance liquid
chromatography methods for estimation of repaglinide were developed. These
methods were validated for estimation of repaglinide in tablets as well as in receptor
fluid obtained during in vitro permeation studies. Repaglinide was observed to exhibit
emission and excitation wavelengths, respectively, at 379 nm and 282 nm with
linearity in the concentration range of 5-80 µg/ml. High-performance liquid
chromatography analysis of repaglinide yielded retention time of 6.14 min with
linearity ranging from 0.1-1.2 µg/ml concentration. Spectrofluorimetric analysis of
repaglinide in tablets yielded results comparable to high performance liquid
chromatography.
3) Love kumar soni et al., 201231, A simple, rapid and specific reversed-phase high
performance liquid chromatographic method for simultaneous analysis of metformin
hydrochloride, and repaglinide in a tablet dosage form has been developed and
validated. HPLC analysis was performed on a C18 column with 90:10 (v/v)
acetonitrile – water as mobile phase at a flow rate of 1.0 mL min-1. UV detection was
performed at 223 nm. Total run time was 10 min; metformin hydrochloride and
repaglinide were eluted with retention times of 2.72 min and 6.13min, respectively.
The method was validated for accuracy, precision, linearity, specificity, and
sensitivity in accordance with ICH guidelines. Validation revealed that the method is
specific, rapid, accurate, precise, reliable, and reproducible. The high recovery and
low coefficients of variation confirmed the suitability of the method for simultaneous
analysis of the two drugs in tablet dosage form.
4) Deepa R. et al32., A simple, specific and accurate stability-indicating reversed phase
high performance liquid chromatographic method was developed for the simultaneous
was achieved on younglin HPLC system using Varian C18 (250 -4.6 mm i.d, 5 m
particle size) columnwith the mobile phase containing mixture of acetonitrile: 10mM
ammonium acetate(pH 3.0, adjusted with phosphoric acid) (70 : 30, v/v). The flow
rate was 1.0ml/min and the eluent was monitored at 230nm. The retention times of
Repaglinide and Metformin hydrochloride were found to be 3.1 min and 5.58 min,
respectively. Linearity was established for Repaglinide and Metformin hydrochloride
in the range of 0.5-3 µg/ml and 200-1200 µg/ml, respectively. The percentage
recoveries of Repaglinide and Metformin hydrochloride were found to be in the range
of 99.87%±0.7 and 99.89%±0.15 respectively. Both the drugs were subjected to acid,
alkali, oxidation, and dry heat degradation. The degradation studies indicated,
Repaglinide and Metformin hydrochloride showed degradation in acid, alkaline,
H2O2, and in dry heat condition. The degradation products of Repaglinide and
Metformin hydrochloride were well resolved from the pure drug with significant
differences in their retention time values. This method can be successfully employed
for simultaneous quantitative analysis of Repaglinide and Metformin hydrochloride in
4.1 MATERIALS
Drug sample
Metformin hydrochloride and repaglinide sample obtained from Chandra labs Pvt.,
Ltd., Hyderabad.
Formulation used
Prandimet tablets containing 500 mg metformin hydrochloride and 2 mg
repaglinide were proceed from Chandra labs Pvt., Ltd., Hyderabad.
Equipement used:
S.No Name Model Manufacturer/Supplier
1. Analytical balance Unibloc Shimadzu, Libror
2. pH meter Eutech Shimadzu.
3. HPLC LC-2010 Shimadzu Corporation, Japan
4. UV UV-2550 Shimadzu Corporation
Chemicals used:
S.No Chemicals Grade Manufacturer/Supplier
1. Water HPLC Microlabs
2. Methanol HPLC Merck
3. Acetonitrile HPLC Merck
4. Potassium dihydrogen phosphate AR Merck
5. Sodium dihydrogen phosphate AR Merck
6. 0.1M Sodium hydroxide AR Merck
7. Hydrochloric acid AR Merck
8. Triethylamine AR Spectrochem
METHOD DEVELOPMENT
A method was developed for the determination of repaglinide and metformin HCl on HPLC
by selecting the solubility, λmax and optimum mobile phase which gives good resolution of
repaglinide and metformin HCl.
SOLUBILITY
Solubility of drugs was observed by dissolving it in different solvents and it was found that
drugs having good solubility in following solvents.
Table 1: Solubility of drugs in different solvents
S.no
Solvent
Solubility
Metformin Hydrochloride Repaglinide
1. Water + +