promoting access to White Rose research papers
White Rose Research Online
Universities of Leeds, Sheffield and York
http://eprints.whiterose.ac.uk/
This is an author produced version of a paper published in Journal of Computer-Aided Molecular Design.
White Rose Research Online URL for this paper: http://eprints.whiterose.ac.uk/78615
Published paper
Patel, Y., Gillet, V.J., Bravi, G. and Leach, A.R. (2002) A comparison of the
pharmacophore identification programs: Catalyst, DISCO and GASP. Journal of
A Comparison of the Pharmacophore Identification Programs: Catalyst,
DISCO and GASP.
Yogendra Patela, Valerie J. Gilleta*, Gianpaolo Bravib, and Andrew R. Leachb.
aKrebs Institute for Biomolecular Research and Department of Information Studies,
University of Sheffield, Western Bank, Sheffield S10 2TN, United Kingdom.
bGlaxoSmithKline,Gunnels Wood Road, Stevenage, SG1 2NY, United Kingdom.
Summary
Three commercially available pharmacophore generation programs, Catalyst/HipHop, DISCO and GASP, were compared on their ability to generate known pharmacophores deduced from protein-ligand complexes extracted from the Protein Data Bank. Five different protein families were included Thrombin, Cyclin Dependent Kinase 2, Dihydrofolate
Reductase, HIV Reverse Transcriptase and Thermolysin. Target pharmacophores were defined through visual analysis of the data sets. The pharmacophore models produced were evaluated qualitatively through visual inspection and according to their ability to generate the target pharmacophores. Our results show that GASP and Catalyst outperformed DISCO at reproducing the five target pharmacophores.
Introduction
A pharmacophore is the spatial arrangement of key chemical features that are recognised by a receptor and are thus responsible for ligand-receptor binding [1]. Pharmacophore models are typically used when some active compounds have been identified but the three-dimensional (3D) structure of the target protein or receptor is unknown. The active compounds are superimposed to determine their common features and hence to provide a pharmacophore model that explains ligand-receptor binding. Once such a model has been derived it can be used to: search for other molecules that contain the same pharmacophore and that may also be active; to explain structure activity relationships within a series of molecules; and to form a basis for the design of new potentially active molecules.
Given a set of active molecules, the identification of a pharmacophore involves two steps: analysing the molecules to identify pharmacophoric features, that is, atoms that can interact with a receptor, and aligning the active conformations of the molecules to find the best overlay of the corresponding features. The main difficulty in pharmacophore generation is in the handling conformational flexibility since the active conformations of the molecules are usually unknown.
Several programs have been developed for the automatic identification of pharmacophore models [2]. The main differences between the programs lie in the algorithms used for the alignment and in the way in which conformational flexibility is handled. Here, three commercially available programs DISCO, Catalyst/HipHop and GASP are compared with regard to their ability to reproduce known pharmacophores which have been determined by analysing crystallographic data for a series of ligands bound to the same protein.
The main features of the programs are given in the next section which is then followed by a description of the methodology and the datasets used in the study. Finally the results are presented and conclusions drawn.
The Programs
In DISCO [3, 4], each molecule is characterised by ligand points and site points. Ligand points include atoms with positive charge, negative charge, hydrogen bond donor, hydrogen bond acceptor and hydrophobic character. Site points represent the hypothetical position of complementary atoms in a receptor and are determined from the position of heavy atoms in the ligand structure. Conformational flexibility is handled by precomputing a series of low energy conformers for each molecule with each conformer being treated as a rigid body during the alignment step. A conformer is represented by the interpoint distances calculated for the ligand and site points and a clique detection algorithm is used to align structures based on these distances. The Bron-Kerbosh clique-detection algorithm has been modified to allow multiple alternative conformations of molecules to be considered and to preserve chirality of molecules.
conformation of the reference molecule. If no solution is found the tolerances on the clique detection process are increased until either a solution is found or the maximum tolerance is reached. Every molecule must contain all features of the pharmacophore, however, DISCO has the option of finding solutions where some molecules are excluded from the model. The output from a DISCO run is a ranked list of all possible pharmacophore mappings.
Catalyst comprises two modules: HipHop and HypoGen [5]. HipHop attempts to derive a pharmacophore based on features that are common to active molecules whereas HypoGen makes use of quantitative activity data to derive the pharmacophore. This study uses the program HipHop [6]. The pharmacophoric features identified in HipHop are hydrogen bond donors and acceptors, negative and positive charge centres, and surface accessible
hydrophobic regions [7]. As in DISCO, both ligand atoms and projected positions of complementary site atoms are considered as hydrogen bonding features. The handling of conformational flexibility is also similar to that used in DISCO, with each molecule being represented by a set of low energy conformations that are subsequently treated as being rigid. Conformations can be generated using the Poling technique [8] that ensures broad coverage of conformational space, or by using any external structure generation program.
Each molecule is treated as reference molecule in turn. Different configurations of feature points are identified in the reference molecule using a pruned exhaustive search which starts with small sets of features and extends them until no larger configuration is found. Each configuration is then compared with the remaining molecules in an attempt to identify configurations that are common to all molecules. A molecule matches a configuration if it possesses a set of features that can be superimposed on the configuration. The requirement that all molecules match all features in the configuration can be relaxed so that not all molecules are required to possess all the features identified in the pharmacophore. Thus, the assumption is that a molecule can be active despite lacking a feature relevant in the binding of other molecules. The resulting hypotheses are ranked using a combination of how well the molecules map onto the proposed model and the rarity of the model.
centres including projected site points). The molecule with the least number of
pharmacophoric features is chosen as the base molecule to which the other molecules are fitted (cf the reference molecule in DISCO).
A chromosome in GASP encodes the angles of rotations of the rotatable bonds in all of the molecules and the mapping of the pharmacophoric features in the base molecule to
corresponding features in each of the other molecules. For a data set of N compounds the chromosome consists of 2N-1 strings: N binary strings to represent the conformations of the molecules and N-1 integer strings that represent the mapping from the base molecule to each of the other molecules. The length of the integer strings is determined by the number of pharmacophoric features in the base molecule. The fitness function first generates conformations for each molecule and then uses a least-squares procedure to overlay each molecule onto the base molecule using the mappings. Fitness is then a combination of the number and similarity of the overlaid features, the volume integral of the overlay and the van der Waals energy of the molecular conformations. Genetic operators are used in an attempt to evolve solutions that maximise the fitness function and thus correspond to the best possible structural overlay.
Each run of the GA in GASP generates a single solution pharmacophore and each feature in the pharmacophore must be present in each of the molecules. Since a GA is a
non-deterministic method which is not guaranteed to find the global minimum solution, it is possible that a different solution is found each time the GA is run. Typically, therefore, GASP will be run several times with the same data and to generate a family of solutions which can be ranked based on their fitness scores.
Method
responsible for activity was deduced by aligning the complexes using the active sites of the proteins and by referring to the literature. The procedure adopted is described below.
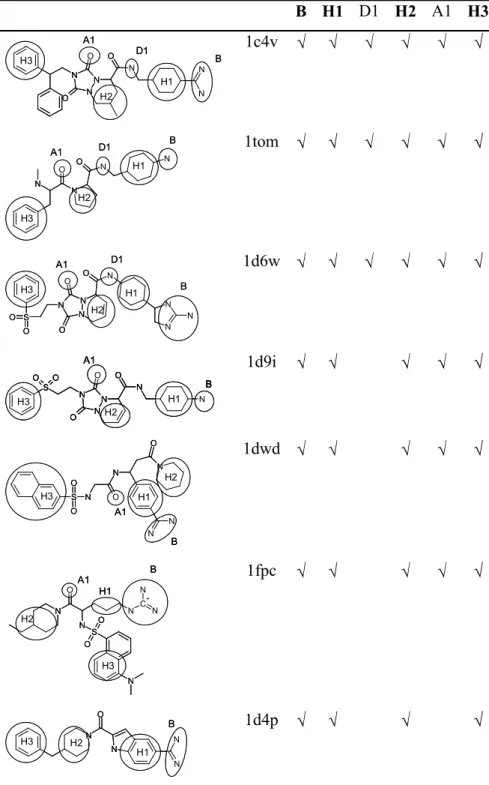
A protein-ligand complex was chosen as a starting point and the similar binding site function of Relibase+ [12] was used to find other protein-ligand complexes in the same family. A protein-ligand complex was discarded if the ligand: had molecular weight > 600; was too flexible (> 16 rotatable bonds); was covalently bound to the receptor; or was peptidic. The ligands were then extracted from the complexes and where there were more than ten ligands a diverse subset was selected using the hierarchical cluster analysis available in Sybyl [13]. Ligands, in their bound conformation, were clustered based on their CoMFA steric fields only. The clusters were then analysed by eye and a small set of molecules chosen from which to derive the known pharmacophore. The protein families and the numbers of ligands in each data set are given in Table 1.
Once a set of ligands had been identified for a protein family, the pharmacophoric features for each ligand were deduced by examining the protein-ligand complex in Relibase+ and by reference to the literature. A a target pharmacophore was then defined as the set of
pharmacophoric features that is common to all ligands. Each of the three programs was then tested on its ability to generate the target pharmacophore.
Each program was evaluated in two phases. The first phase consisted of using the bound conformations and performing a Rigid Search (see later for details on GASP). The rationale for carrying out the Rigid Search is that if the target pharmacophore cannot be created using the bound conformations, it is unlikely that it will be found when the conformations of the ligands are relaxed. The second phase was to carry out a Flex Search in which the
conformational space available to the ligands is explored. The details of each of these phases varies slightly from one program to another due to the implementation details and the variation allowed in the searches. The specific details for each program are given below.
determined pharmacophore due to limitations of the program (see later). Generating the manual pharmacophore can thus give an insight into what is achievable during the automated steps. In the Flex Searches, conformational models were created using the Poling method available within Catalyst. Catalyst typically produces a number of possible pharmacophore hypotheses which can be clustered.The clusters were examined to identify the best
hypothesis, that is, the hypothesis that is most similar to the target pharmacophore.
In DISCO [15] conformers were generated for the Flex Searches using the Multisearch and REJECT features. The REJECT feature removes duplicates to leave a set of unique low energy conformers [4]. DISCO also produces a number of possible pharmacophores. The hypotheses were grouped on the basis of the assignment of atoms to features and a text search on the model characteristics was used to identify the group(s) of hypotheses with the best assignment of features. The hypotheses in the identified groups were then examined in more detail to find the hypothesis that most closely matches the target hypothesis.
The procedure adopted for the GASP [9,10,16] runs was as follows. Firstly, since
conformational analysis is performed on the fly it was not possible to conduct a fully rigid search. It is possible, however, to hold a single compound as rigid and thus the Rigid Search was simulated by fixing the most flexible compound in its bound conformation. CONCORD [17] was used to generate a single low energy conformation for each ligand prior to the Flex Searches.
The definition of a pharmacophore hypothesis in GASP is stricter than in DISCO or Catalyst since all ligands are required to match all features in the pharmacophore. This can make finding the target pharmacophore more difficult especially for large numbers of ligands. (In DISCO, although all molecules included in the hypothesis have to match all the features, it is possible to exclude some molecules from the hypothesis). Thus, it is recommended for GASP that the datasets are limited to between two and four ligands [18] and hence if the target pharmacophore was not found using all ligands the dataset was divided into subsets based on common features and each subset was used in a separate search.
Evaluation
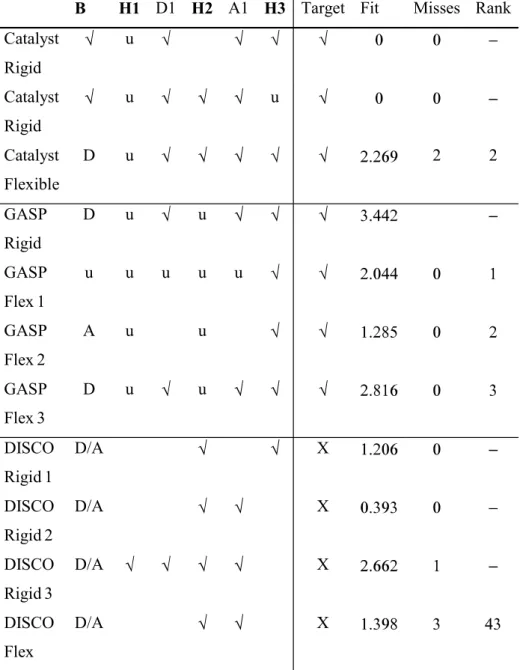
The main criteria on which the programs are judged is their ability to generate the target pharmacophores. However, even when the target pharmacophore is known, evaluating the "goodness" of a hypothesis is still a complex task. Here, various criteria are applied to evaluate the best hypotheses that are generated. All features in a hypothesis that correspond with features seen in the ligands are recorded and a Hit is flagged if all the features of the target pharmacophore have been identified. Two criteria are used to judge the quality of a hit. Firstly, the RMSD between the best hypothesis and the target pharmacophore is recorded (as
Fit in the results tables). Secondly, the extent to which the hypothesis is representative of the ligands is given by the number of misses in the hypothesis with a Miss being recorded each time a feature is missed by a molecule (either the feature is missing entirely or the wrong functional group is assigned to the feature). All the programs assign a score to the hypotheses generated which can be used to rank the output, although the actual scoring functions used vary from one program to another. The position of the best hypothesis in the ranked output is also recorded (as Rank in the results tables). Catalyst provides an additional way of validating a hypothesis based on the mappings score for a ligand. For a given hypothesis there can be several alternative mappings between a ligand and the features of the hypothesis and these are presented in rank order as the mapping number. This number is not recorded in the results tables but is sometimes referred to in the discussion. Finally, the hypotheses were judged in a more qualitative manner, as detailed in the discussion.
Results
Thrombin
The key interactions involved in binding are shown in Table 3 with reference to ligand 1cv4 and the corresponding features present in each of the ligands are highlighted in Table 2 [19-27]. The target pharmacophore was defined as the four feature pharmacophore consisting of the features B, H1, H2 and H3 which are the features that are common to all ligands. The results are shown in Table 4 and discussed below.
Catalyst.
Rigid Search. When Catalyst was configured to search for four feature hypotheses two best
hypotheses were generated. Both hypotheses include the basic region B, the donor D1 and the acceptor A1. They differ in the hydrophobic regions identified, with the first having a
hydrophobic region corresponding to H2 and the second identifying the hydrophobic region corresponding to H3. Neither hypothesis includes the feature H1 since it is too close to the basic region to be identified, although in both cases the region can be deduced from the alignment, hence it is recorded as found in Table 4. Thus the target pharmacophore is found.
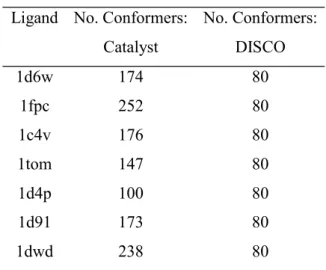
Flex Search. Low energy conformers were generated for the ligands with the maximum number per molecule limited to 255. The number of conformers per ligand is shown in Table 5. Catalyst was then configured to generate 120 hypotheses. All the resulting hypotheses include five or six features with either two or three hydrophobic regions, one or two donors, and one or two acceptors. None of the hypotheses contain a positive ionisable group, although this feature is identified as a donor. The absence of the positive ionisable group is surprising since the feature was identified during the Rigid Search and it is possible that the hypotheses found previously were missed due to insufficient sampling of conformational space or that they would be found at ranks lower than 120 if the number of hypotheses to the generated had been increased.
The hypotheses which contain two acceptors all have an acceptor next to donor D1 that is not present in the target pharmacophore. In most cases, it is the carbonyl oxygen next to the N-H corresponding to D1 that maps to this feature, except for 1d4p (which only has one acceptor); 1dwd (where it is the carbonyl next to the piperidine group); and 1fpc (where it is the
carbonyl oxygen shown as A1). This feature is not involved in the binding but is more likely present for steric reasons.
hydrophobic regions (H2 and H3); two donors (one corresponding to D1 and one corresponding to the positive ionisable group B); and one acceptor (A1). The hypothesis closely resembles those generated in the Rigid Search, except that both hydrophobic regions H2 and H3 have been determined. Again, although H1 was not identified it can be deduced from the overlay.
Figure 1 shows a schematic of the Catalyst generated hypothesis, together with the
corresponding five feature pharmacophore created manually from the bound conformation of 1c4v. The main difference between the two hypotheses (apart from the positive ionisable group being replaced by a donor) is that the former positive ionisable group is now further away from the other features of the hypothesis. Apart from this, the molecules all map well to the hypothesis, with the correct features being assigned to each molecule, except for: 1d9i which has an incorrectly assigned N-H donor, although the N-H in question does hydrogen bond with a solvent molecule; and 1fpc where the SO2 group maps to A1 instead of the
correct C=O acceptor. Thus, the number of misses is given as two.
GASP
Rigid Search. The two ligands 1c4v and 1tom were used with 1tom held rigid. The
pharmacophore produced consists of 8 features due to the large number of functional groups in common between the two ligands. The features include five acceptors (including A1); two donors (one corresponding to D1 and one corresponding to the positive ionisable group B); and one correctly assigned hydrophobic region (H3). GASP fails to recognise the other hydrophobic regions due to its limited definition of hydrophobicity which is restricted to aromatic centres. However, both H1 and H2 can be readily deduced by the user from the alignment and as for Catalyst they are given as matches in Table 4. Thus the target pharmacophore is given as found.
The best hypothesis produced for Set 1 is at rank one and consists of two pharmacophoric features only, H3 and an acceptor that is not present in the binding site. H1 and H2 are not deduced by GASP due to the limited definition of hydrophobicity (as for the Rigid Search), however both of these regions can be deduced by the user from the overlay, as can the other features B, D1 and A1. Only one of the 15 solutions (rank 14) identifies feature B (as an acceptor). Three of the solutions (rank 4, 11 and 15) identify D1 and another three identify A1 (rank 5, 6 and 13).
The best hypothesis for Set 2 is at rank two and includes feature B (identified as an acceptor) and feature H3. Again features H1, and H2 are not identified by GASP but they can be deduced by the user from the overlay. Again an acceptor is identified that is not present in the binding site. The top ranked solution does not identify feature B.
The best overlay for Set 3 (rank 3) identified B (as a donor); D1; A1 and H3. Features H1 and H2 can be deduced from the overlay. Extra features not present in the binding site are also identified including 4 acceptors that correspond to two carbonyl groups. The top two solutions both miss the features B and A1.
Combining the results of the three sets: H3 is identified in all three sets and H1 and H2 can be deduced by the user in all the sets; and Sets 2 and 3 identify the feature B (as an acceptor and donor respectively).
DISCO
Rigid Search. The target pharmacophore containing all features for all molecules could not be found. Models were obtained when DISCO was allowed to exclude two molecules (1d9i and 1tom were excluded) with 1c4v used as the reference molecule, and the best of these is reported in Table 4 as Set 1. Three ligands, 1tom, 1c4v, and 1d6w, were then used to form another pharmacophore model, with 1c4v again used as reference, also shown in Table 4 as Set 2.
The second model shows the correct acceptor A1 but lacks the hydrophobe H3 which is found in the first model. When 1d4p was used as the reference molecule (Set 3), and 1d9i and 1tom were excluded, all the features except D1 and H3 were found.
Flex Search. The number of conformers generated for each ligand is given in Table 5. Ligand 1d4p was used as the reference molecule (the default choice since this is the least flexible molecule). This resulted in a total of 452 models divided into 29 groups. All the models consist of a donor and acceptor in place of the positive ionisable group, but the rest of the features vary from model to model and include features present in the target pharmacophore as well as the non-existent C=O acceptor found by both GASP and Catalyst. Varying the reference ligand had little effect on the models generated, and although, it is possible to determine the target pharmacophore through viewing many of the models generated, no one model is sufficient. A representative model consisting of features B, H2 and A1 is reported in Table 4.
Summary. The hypothesis generated by Catalyst is the closest to the target pharmacophore. GASP performed reasonably well, although the ligands had to be divided into subsets and a certain amount of detective work was required on the different hypotheses derived in order to obtain a reasonable model. DISCO was similar to GASP in that a combination of models was required in order to deduce a reasonable model, however, the models derived where of a poorer quality that the GASP models. Thus the order of performance of the programs on the thrombin ligands is given as Catalyst>GASP>DISCO. The best hypothesis generated by each of the programs is illustrated in Figure 2.
CYCLIN DEPENDENT KINASE 2 (CDK2)
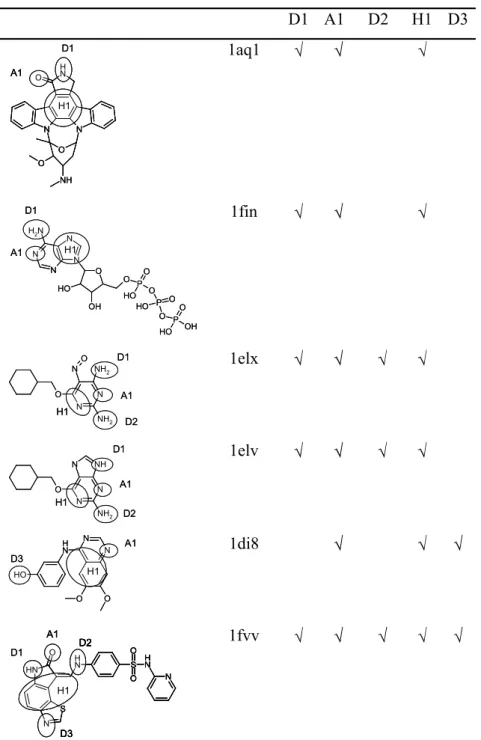
Nine human cyclin dependent kinase 2 complexes were found using Relibase+. Three of these were removed since they contain ligands with heavy atoms other than phosphor or sulphur, leaving a total of 6 ligands for the data set, one of which (1fin) is the naturally binding ligand. The data set can be seen in Table 7.
Catalyst.
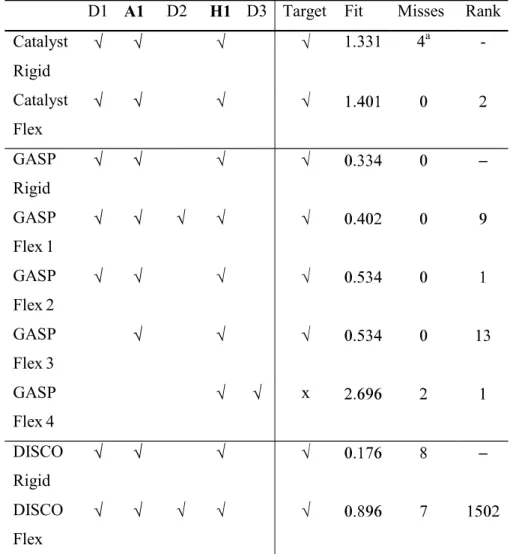
Rigid Search. The pharmacophore generated using the bound conformations of the ligands includes the features D1, A1 and H1 hence the target pharmacophore is found. All features lie in the same plane as in the target pharmacophore although the hydrophobe is located further away from the hydrogen bonding features (indicated by the RMS Fit). The naturally
occurring ligand (1fin) does not match the pharmacophore correctly. This can be due to its large size relative to the other ligands and the presence of the tri-phosphate region which is rich in hydrogen bonding features which Catalyst prefers to map to the hydrogen bonding region of the pharmacophore.
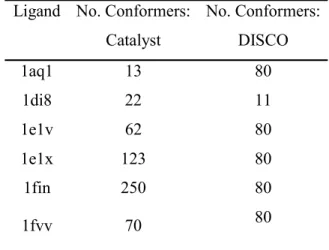
Flex Search. The number of conformations produced for each ligand is shown in Table 10. When all ligands were included 67 hypotheses were found and when 1fin was excluded 120 hypotheses were found (the previous 67 plus new lower ranking models). In both case, the best hypothesis is ranked second. The features D1, A1 and H1 are found together with two additional acceptors that are close to A1 and D1. In fact all ligands except 1aq1 have atoms in this region that are capable of acting as acceptors. All the hydrogen bonding features lie in the same plane but the hydrophobe now sits above the plane by approximately 1.8 Å.
Two of the ligands, 1fvv and 1di8, involve high ranking mappings, 12 and 24 respectively. The earlier mappings for these ligands had the wrong assignment of atoms to features:the higher ranking mappings for 1fvv have the tricyclic region shifted relative to the bound conformation with the tail of the molecule mapping to the hydrogen bonding features; for 1di8 the higher ranking mappings involve incorrect assignment of atoms to A1.
GASP
Rigid Search. GASP was run with ligands 1e1v, 1e1x and 1aq1, with the most conformationally flexible, 1e1x, held rigid. The best hypothesis was the top ranked hypothesis and consisted of features H1, A1, and D1. Thus the target pharmacophore is found.
additional features (four donors and one acceptor) which correspond to the feature rich region of 1fin and the ether region of 1aq1. The best hypothesis for Set 3 is ranked 13 and is the first hypothesis found for this set that has the ligands oriented correctly with respect to each other. The features identified are A1 and H1 along with an additional acceptor. All of the
hypotheses produced for Set 4 are poor. In all cases ligand 1di8 is aligned with the portion of 1fvv that sits in the hydrophobic cavity and is not involved in hydrogen bonding. Thus, although the hydrophobe H1 and donor D3 have been identified for 1di8 they do not correspond to the correct features in 1fvv.
DISCO
Rigid Search. Ligand 1elx was used as the reference molecules and the best hypothesis consists of donor D1, acceptor A1 and hydrophobe H1 and hence the target pharmacophore is found. However only three of the six ligands map correctly to the hypothesis. The number of misses is given as eight since the hydrophobic region of 1di8 is deduced but the alignment of the ligand is wrong.
Flex Search. The number of conformations produced for each ligand is shown in Table 10. A total of 1692 models were generated that were arranged in 29 groups 7 of which contain features that represent the target pharmacophore. The first model to contain features A1 and H is ranked 52. However the best model (i.e., the one that had the highest number of ligands correctly mapped to the model) is at rank 1502. The model consists of hydrophobe (H1), an acceptor atom/donor site pair (A1), and an acceptor site that corresponds to D1, although it points in the wrong direction. The model has the following incorrect assignments: in 1aq1 only H1 is correctly identified and it is the ether region of the molecule that is assigned to the bonds; in 1di8 only H1 is correct and the wrong atoms have been assigned to the
H-bonding features of the model; 1fvv is mapped incorrectly. Thus the total number of misses is given as seven. In 1e1v, 1e1x and 1fvv the acceptor site feature of the model corresponding to D1 is pointing in the wrong direction although these are not recorded as misses.
good for Sets 1, 2, and 3, with all the features of the target pharmacophore identified in each set. The model for Set 4 is rather disappointing, and is most likely due to the differences in sizes of the ligands used. Overall, all three programs performed well for this data set. The order of performance of the programs is given as: GASP > Catalyst > DISCO. DISCO is placed last because it only maps three of the ligands correctly, and because of the low ranking of the model and GASP is placed higher than Catalyst because it has fewer misses overall than Catalyst. The best hypothesis generated by each of the programs is illustrated in Figure 3.
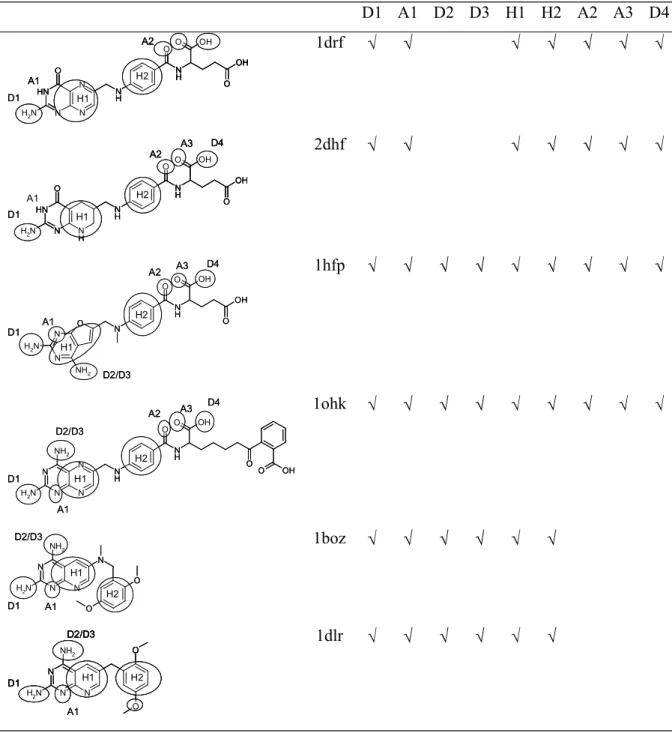
DIHYDROFOLATE REDUCTASE (DHFR)
A search of Relibase+ for human DHFR resulted in 11 hits which consist of 6 unique ligands. The resulting data set can be seen in Table 12.
The key interactions involved in binding are summarised in Table 13 with reference to ligand 1ohk and Table 12 shows the corresponding features present in each ligand [33-37]. The target pharmacophore consists of D1, A1, H1, and H2. The results are shown in Table 14 and discussed below.
Catalyst
Rigid Search. The best hypothesis consists of the features D1, A1, D2, H2 and A2. The hydrophobe H1 which is present in the target pharmacophore was not found. This is due to the fact that it is too close to the hydrogen bond features for Catalyst to recognise it. It can, however, be easily deduced from the alignment hence the target pharmacophore is given as found in Table 14. However, not all of the molecules match all of the features correctly. The donor D1 is not recognised in 1ohk and 1boz; in 1drf and 2dkf the carbonyl group of the pteridine ring is incorrectly assigned as A1; and in 1dhf the wrong N is assigned to D2.
Hypothesis two consists of the features D1, A1, D2, H2 and A2. Ligands 1drf and 2dhf have incorrect assignments to A1 since in both cases it is the C=O group and the N atom on the opposite side of the ring are shown as acceptors; and in 2dhf the NH of the tetra-hydro-pyridyne ring is incorrectly assigned to D2. Thus the number of misses is given as three. Additional features not in the target pharmacophore are found in ligands 1hfp (the ring O and the N between the two NH2 groups are shown as acceptors); in 1boz and 1dlr the pteridine
ring has an extra donor and acceptor; and 1ohk shows the pteridine ring with two extra acceptors.
Hypothesis nine consists of the features D1, A1, D2, H1, A2 and A3. The best mappings of ligands 1hfp, 1drf, 2dhf and 1ohk are at ranks 78, 40, 97 and 42 respectively. In all cases, the earlier mappings have incorrect assignments of atoms to A2 and A3. In ligands 1boz and 1dlr the ether oxygens are incorrectly assigned as acceptor A2 thus the number of misses is recorded as two.
GASP
Rigid Search. Ligands 1hfp and 1ohk were used. The best solution is the top ranking solution and all of the features present in the binding site have been identified: D1, A1, D2, D3, H1, H2, A2, A3 and D4. A number of additional features have also been identified due to the high degree of similarity of the two ligands.
Combining the results from the three sets the pharmacophore can be deduced as all the features listed in Table 14 together with an additional donor and acceptor in the pteridine ring region and a donor and donor/acceptor pair in the 'tail end' of the ligands.
DISCO
Rigid Search. The best models were found when 1boz was used as the reference model and DISCO was forced to find the hydrophobic regions H1 and H2. The first model consists of three hydrophobic centres, H1 and H2 and a third hydrophobic close to H1. In fact onlyone hydrophobe should be found in this region since in their bound conformations the ligands1drf and 2dhf are aligned such that only one of their two rings overlap with the corresponding ring systems of the other ligands. The acceptor A1 is also identified. The second model consists if the same three hydrophobes, an acceptor atom that is not present in the known
pharmacophore and a donor site that corresponds to acceptor A2.
Flex Search. The reference ligand was 1ohk and 51 models were produced, arranged in 19 groups which could be further clustered into two sets, one that contains two hydrophobes, and one that contains one hydrophobe. In both cases, the hydrophobes correspond to the feature rich rings, with the more accurate models being those that contain only one hydrophobe which represents H1. When a second hydrophobe is found it is incorrect and is due to the incorrect alignment of ligands1drf and 2dhf as in the Rigid Search.
The two best models produced are at rank one and rank 15respectively. The features that have been deduced correctly are: D1 (shown by a donor atom and an acceptor site), A1 (shown by an acceptor atom and a donor site) and H1. Additional features have been deduced in this region of the ligands, due to the feature rich nature of the rings, including two acceptor atoms, a donor site, and an acceptor site. The final feature deduced is an acceptor atom in the
tail region of the ligands, that corresponds to the feature A3 which is correctly assigned in in just two of the ligands, 1hfp and 2dhf, neither 1boz nor 1dlr have this feature, and it has been incorrectly assigned in the case of 1ohk and 1dfr, hence the number of misses is given as two. D2 and D3 can be deduced from the overlays since the NH2 groups that correspond to
these features are very close together. The reason they have not been identified is because these features are not common to all ligands, they are not present in 1drf and 2dhf.
region of the ligands although this feature has only been assigned correctly in one of the ligands, 1hfp, where it represents A2. The other features identified correctly are D1, A1, and H1. Again, D2 and D3 can be deduced. The remaining features, H2, A2, A3 and D4, are not identified because of the way the ligands have been overlaid and because A3 and D4 are not present in two of the ligands, 1boz and 1dlr.
Summary. GASP performed the best for this data set, since it is the only program that identified all the features of the pharmacophore. Catalyst is ranked second since two features were missed: D3 as a results of the NH2 groups being restricted to forming only one hydrogen
bonding interaction; and D4 which is missed because Catalyst does not recognize carboxylic OH groups as being hydrogen bond donors. DISCO was the worst of the three programs, and was only able to identify the features D1, A1, H1 and A3. The best hypothesis generated by each of the programs is illustrated in Figure 4.
HIV-1 Reverse Transcriptase
Searches in Relibase+ resulted in 47 protein-ligand complexes being identified. The 47 ligands were extracted and clustered and a data set of 10 ligands that bound in the non-nucleoside binding site was obtained as shown in Table 17.
The key interactions involved in binding are summarised in Table 18 with reference to ligand 1klm and Table 17 shows the features present in each ligand [38-47]. The only feature which is common to all ligands is the hydrophobe H and this thus represents the target
pharmacophore. The results are shown in Table 19 and discussed below.
Catalyst.
Rigid Search. The best hypothesis produced using the bound conformations consists of a donor and acceptor corresponding to features D1 and A1 and three hydrophobic regions, two of which represent H1 and the third which is incorrect.
features: 1vru is shown as forming two hydrogen bonds when it interacts via hydrophobic interactions only; 1rt3 is shown as having one hydrogen bonding feature which is incorrect; the first mapping of 1klm to the hypothesis that shows the correct assignment to the donor and acceptor features is at mapping 32 with all higher mappings involving the SO2 group; the
first mapping of 1tvr that shows only the NH group as a donor is mapping eight.
The hypothesis at rank 18 has the donor and acceptor and also has a hydrophobe in the right location to represent H1. However, it has the following incorrect assignments of ligands to features: mapping 48 of 1ddt is the first mapping with the hydrogen bonds pointing in the same direction; 1rt3 is shown as having an acceptor interaction when this is not the case.
Barnum et al (1995) have reported on the application of Catalyst/HipHop to generate hypotheses for HIV-1 reverse transcriptase. Their best hypothesis was a five feature hypothesis consisting of an acceptor and 4 hydrophobes, in constrast to the five feature hypothesis found here which consists of a donor, an acceptor and three hydrophobes.
GASP
Rigid Search. Two subsets of ligands were used in the Rigid Search as shown in Table 21a. All the overlays produced for Set 1 are very similar. The features identifed are D1/2 and H. Two of the ligands, 1dtt and 1rt5 have the features assigned to the correct atoms, but in the third ligand, 1klm, the feature D1/2 has been assigned to the wrong N atom, it has been assigned to the N next to the SO2 group when it should be the N in the indole ring.
The overlays produced for Set 2 are also very similar to each other. The features identified are a hydrophobe (which represents H) and two acceptors. In 1fk9, the carbonyl O
corresponding to A is identified as having two acceptor interactions. In 1klm and 1bqm, the acceptors do not correspond to the atoms that are responsible for this feature. In the case of 1bqm, this is due to the acceptor being a S atom which is not recognised as an acceptor by GASP.
limitation of GASP whereby the program does not recognise sulfur atoms as being able to form hydrogen bonds. In addition, although H was not identified it can be deduced from the overlay.
The best solution for Set 4 is also the top ranking solution. The features consist of D, H and an incorrectly assigned acceptor. In both ligands, a N atom is assigned as an acceptor whereas A should correspond to the C=S groups.
Set 5 consists of two ligands that interact via hydrophobic interactions only (1rt3 and 1vru). The best solution (ranked first) correctly identifies the hydrophobic interaction H. In addition, three acceptors are identified that are not present in the binding site. The additional features are due to the alignment of functional groups in the ligands and will increase the fitness score of the overlay.
The best solution for Set 6 is at rank five and consists of two hydrophobes, which represent H, two acceptors, one of which corresponds to A and a donor, which corresponds to D. The additional acceptor is due to the way the ligands are aligned.
The solutions for Set 7 are very similar to one another. The top ranked solution consists of a donor, which corresponds to D, and an acceptor at the opposite end of the ligands. The hydrophobic region, H, has not been deduced, since in one ligand it is due to a non-aromatic interaction which is not recognised by GASP, however, it is possible for the user to identify this region from the overlay. In addition, the user may deduce the existence of an acceptor next to the donor D. This feature is present in 6 of the other ligands as A, but is not part of the binding mode for the two ligands in this set.
DISCO
hydrophobe H can be deduced by the user since for all of ligands, except for 1ep4, the rings are located in the same position, behind the hydrogen bonding features.
Flex Search. The number of conformations produced for each ligand is shown in Table 20. 1fk9 was assigned as the reference structure (the default choice), and 71 models were produced which were arranged in 21 groups. Five of these groups consist of features that are present in the binding site.
The highest ranking model in the first group is at rank 29. The model consists of features H and A1 or A2 however only two of the ligands, 1fk9 and 1ep4, have correct assignments of atoms to features. Two ligands are excluded from the model, 1vru and 1tvr. For the remaining ligands, the incorrect assignments are as follows: in 1bqm the ether O is shown as the
acceptor; in 1dtt the N in the ring next to the ether O is shown as the acceptor; in 1klm the N next to the SO2 group is shown as the acceptor; in 1rt1 the ether O is shown as the acceptor (a
result of the hydrophobe being assigned to the aromatic ring next to the ring which contains the H-bonding features of 1fk9); two acceptors are found in 1rt3 although this ligand interacts via hydrophobic interactions only; in 1rt5 the O next to the butyl group is shown as the acceptor. The number of misses is recorded as six.
The highest ranking model in the second group is at rank 47. The model consists of features H and D with the acceptor A being deducible from the overlay. One ligand is mapped incorrectly (1vru which is shown as interacting via a donor when it interacts via the hydrophobic interaction only). Ligands 1rt1 and 1rt3 were excluded from the mapping.
The highest ranking model in the third group is at rank 58. The model consists of features H and A. Two ligands are excluded from the model (1rt3 and 1rt5) and four ligands have incorrect assignments: 1bqm where the ether O is shown as the acceptor; 1dtt where the ether O is shown as the acceptor; 1klm where the N next to the SO2 group is shown as the acceptor;
and 1vru which is shown as having an acceptor when it interacts via the hydrophobic interaction only.
The highest ranking model in the fifth group is at rank 68. The model consists of features H and D. Ligands 1vru and 1rt5 are excluded and correct assignments are found for ligands 1fk9, 1bqm, 1tvr, and 1rt1 only.
Summary. The order of performance is given as Catalyst > GASP > DISCO. Catalyst is ranked first since the target pharmacophore is found; the highest number of ligands are correctly mapped; and the least amount of user input was required. GASP is ranked above DISCO because, although the results of the different runs have to be combined, the models produced are generally of a better quality due to the fact that GASP takes into account steric overlap during the pharmacophore generation procedure. The best hypothesis generated by each of the programs is illustrated in Figure 5.
Thermolysin
Searches in Relibase+ resulted in 40 protein-ligand complexes being identified. Several of the ligands consisted of either metal ions or 2-4 atoms and these complexes were discarded leaving a total of 22 ligands. After duplicates were removed and clustering a set of six ligands was obtained as shown in Table 22.
The key interactions involved in binding are summarised in Table 23 with reference to ligand 4tmn and Table 22 shows the features present in each ligand [48-52]. The target
pharmacophore consists of features M, A1, H and A2 where feature M represents binding to the Zn+ ion of the receptor and involves two acceptors in the ligands. The results are shown in Table 24 and discussed below.
Catalyst
Rigid search. The best pharmacophore is at rank 26, this is the first hypothesis in the list to have an acceptor feature in a position and direction to represent the feature A1. Other features present in the hypothesis are two acceptors that represent M, and a hydrophobe that
corresponds to H.
An extra feature was also found that corresponds to A3 in four of the ligands that have this feature (7tln and 1hyt are both missing this feature). The feature A2 has not been identified since this corresponds to one of the O atoms that is also responsible for feature M, and Catalyst only assigns one acceptor feature to an O atom. The first mapping of 5tln that has the correct atom assignments of features M and A1 is at mapping 33; in 5tmn and 4tmn only one of the two acceptors representing M have been assigned correctly, in both cases the ether O is incorrectly assigned as an acceptor.
In some of the models, A2 is identified, together with one acceptor representing M, however, the other acceptor features present in the hypotheses are not in locations where they could correspond to the remaining acceptor features of the target pharmacophore.
GASP
Rigid Search. Two pairs of ligands were used for rigid searches. The first pair consisted of 7tln and 1hyt, with 7tln held rigid. The top ranking hypothesis consists of the acceptor A1; one of the acceptors to Zn+ (M); and the acceptor A2. The hydrophode H was not deduced due to the restricted definition of hydrophobicity used in GASP however this feature can be deduced by the user from the alignment.
The second pair consists of 4tmn and 5tmn with 4tmn held rigid. The best hypothesis is the top ranking hypothesis and consists of the features M; A1; H; D1, D2 and A3. The missing feature A2 was not found since the NH groups of the ligands point in slightly different directions. The hypothesis includes six additional acceptors arising from the carbonyl and carboxyl groups that are aligned.
Flex. Search. The data set was divided into the four subsets as shown in Table 26. The best solution for Set 1 is at rank 4 (the first three overlays have the A1 feature of 1hyt aligned with the M feature of 7tln and vice versa). The overlay is very similar to that found for the Rigid Search using the same pair of ligands with the exception that the NO acceptor now
The best hypothesis for Set 2 was at rank two. The features found are M (only one of the two interactions is shown), A1, H, D1, D2 and A3. The missing features A2 and one of the bonds to Zn+ were not deduced since GASP does not recognise S atoms as being capable of
binding. Three additional acceptors were found due to the carbonyl groups all being deduced as having four acceptors. The top ranking hypothesis is missing feature A3.
The best hypothesis for Set 3 is at rank three. The features found are M, A1, H, A2, D1, D2 and A3. The best solution for Set 4 is at rank three. The features identified are D1, A1, D2 and A3. M is partially identified since one acceptor is shown and the hydrophobe can be deduced from the overlay, as before.
Combining the four overlays, the pharmacophore can be deduced as consisting of M, A1 and H. In addition, another acceptor could be considered to be involved in binding since three of the overlays have this extra feature near to the hydrophobe region which could correspond to A2 for Sets 1 and 3. By considering Sets 2, 3 and 4 the following features can also be deduced: D1, D2, and A3. Again, extra features can be deduced since both Sets 2 and 3 have extra features associated with them (three acceptors and one donor and five acceptors respectively). Most likely two to three extra acceptors would be deduced as three of the five extra acceptors in Set 3 are due to the carboxyl group at the terminal end of the ligands, whereas in Set 2 they are spread along the bulk of the ligands.
DISCO
Rigid Search. DISCO generated two models using 5tln as the reference structure. The first model consists of a hydrophobe; two donors; two acceptors; and a donor site. Two ligands, 1hyt and 7tln, have been excluded from the model. Although the features deduced are correct (in that all the features shown in the model are present in the binding site), the model does not represent how the ligands bind to thermolysin with respect to each other (i.e. the
pharmacophoric points deduced for one ligand do not necessarily correspond to the same features in another ligand). Table 27 shows which features are represented by
pharmacophoric points in the model, with each column corresponding to the same
Flex Search. The number of conformations produced for each ligand is shown in Table 25. Initial attempts, where the requirement was that all the ligands had to fit the model, gave poor results. This can be attributed to the two ligands that were excluded from the models
generated using the bound conformations, they are both small oxygen-rich molecules. Since DISCO has to fit all the ligands to every feature of the model generated, it produces models that consist of one hydrophobe and three or four acceptors.
When DISCO was allowed to exclude two ligands from the models (without specifying which should be excluded), ligands 7tln and 1hyt were excluded and the resulting models were of a better quality. A total of 293 models were obtained organised in 127 groups. In all, 36 groups have the correct features assigned to the atoms of the reference structure. The two best models are at ranks 145 and 254. The highest ranking of these models consists of features H, D1 and D2. A1 has been correctly identified for two of the ligands, however, in 4tmn acceptor A4 is identified in place of A1, and donor D3 is identified in place of D2, and in 5tmn acceptor A3 is identified as A1, donor D1 is identified in place of D2 and donor D2 is identified in place of D2. Thus there are a total of five misses. The second best model consists of features H; A1; and D2 although in the case of 4tmn it is actually acceptor A3 that is identified and not A1; and donor D2 rather than donor D1 and hence two misses are recorded.
Summary. The order of performance is given as GASP > Catalyst > DISCO. GASP is ranked first since it identifies the most features; Catalyst is ranked second because the best
pharmacophore generated is closer to the target pharmacophore than that generated by DISCO, all of the features in the model represent the same features in the ligands (i.e. it has fewer misses). The relatively poor performance of DISCO is most likely due to the fact that it does not take account of steric overlap. This can lead to incorrect models when there are different sets of features at similar distances. Having the ability to take account of steric overlap could prevent incorrect assignments to features by ensuring that the scaffold of the molecules are used during the alignment. The best hypothesis generated by each of the programs is illustrated in Figure 6.
Conclusions
sets were investigated, including Thrombin, CDK2, DFHR, HIV-RT and Thermolysin. The choice of these data sets was dictated by the abundance of crystallographic information, with ligands spanning different chemical classes and different properties, from small molecules to large, rigid to flexible, feature-poor to feature-rich. Target pharmacophores were defined from a visual analysis of the available crystallographic data to contain those features shared by all the ligands bound to the same protein. The pharmacophoric features considered include hydrogen-bond acceptors and donors, positive and negative charged groups and hydrophobic centres.
Two main sets of experiments were undertaken. The first, or RigidSearch, used only the bound structure of each ligand in the pharmacophore derivation process. This experiment provided a comparison of the ability of the different programs to identify and match common pharmacophoric features. The second, or FlexSearch experiment, allowed all the ligands to explore their conformational space. This experiment represented a more real-life situation and provided an indication of how each program was able to cope with the more typical
pharmacophore determination problem. As described in the methods section, the three programs use different protocols to explore conformational flexibility. The default protocols were used in each case and no attempt was undertaken to either compare the quality of the conformations produced or use conformations generated elsewhere (both Catalyst and DISCO offer this as an option).
The results were qualitatively evaluated by visual inspection of the pharmacophore models and the alignments obtained. In an attempt to provide a more quantitative comparison we also considered whether the target pharmacophore was generated or missed (either partially or entirely), and, when generated, its RMS deviation was measured and its rank position in the set of solutions produced was recorded.
Moreover, as DISCO gave low quality results in both the RigidSearch and FlexSearch
experiments we suggest that these results are not a consequence of inadequate conformational searching, but that they are more likely due to the way in which DISCO matches
pharmacophoric features. As mentioned in the methods section, the main difference between DISCO and Catalyst or GASP is in that the former only uses distances between features to superimpose ligands. This might be reason for its poorer performance, especially when dealing with complex target pharmacophores [53].
Catalyst and GASP provided almost equivalent performance even though their results were not consistent for all the data sets. A very notable result is that, for both programs, the target pharmacophores were found within the first ten solutions in four out of five data sets. It is also encouraging that these results were obtained on data sets of very different nature, and thus it is tempting to say that they might have general validity.
It is difficult to clearly differentiate between GASP and Catalyst; both programs have their own strengths and weaknesses.
GASP is inherently simpler than Catalyst and its interface with Sybyl means that many operations can be automated through SPL (Sybyl Programming Language). This, for instance, makes the visual analysis of the alignments less work-intensive. However, GASP requires more work in the input phase. Indeed, for GASP to be effective it often requires the dataset to be split into subsets of two or three ligands. This is a direct consequence of the fact that in GASP all ligands must match all the pharmacophore model features. The choice of subsets can bias the resulting pharmacophores towards preconceived ideas.
Catalyst provides much more flexibility in setting and tuning the input parameters. It does not require that all the ligands match all the features, and the user can specify possible outliers. The user also has the possibility of indicating one or multiple reference molecules. However, the analysis of the pharmacophore models and the alignments produced can be a painful experience due to the cumbersome graphical interface.
hydrogen-bond acceptors in GASP resulted in features being missed or having often to be deduced by the user.
GASP's biggest strength over Catalyst is that the former considers not only the pharmacophoric features but also the steric overlap of the ligands when deriving a
pharmacophore model. As a consequence, most of the alignments produced by GASP during an experiment tend to be sensible. Catalyst, instead, does not incorporate the steric overlap and this is directly reflected in the large proportion of uninteresting alignments that are generated.
Acknowledgements
We thank Pam Thomas for help with selecting protein targets. YP acknowledges funding from EPSRC (via an MSc studentship) and GlaxoSmithKline. We acknowledge software support provided by Accelrys, Cambridge Crystallographic Data Centre, and Tripos Inc.
References
1. Gund P., In Güner, O.F (Ed.) Pharmacophore Perception, Development, and Use in Drug Design, International University Line, La Jolla, CA, 2000, pp. 3-11.
2. Güner, O.F (Ed.) Pharmacophore Perception, Development, and Use in Drug Design, International University Line, La Jolla, CA, 2000.
3. Martin, Y.C., In Güner, O.F (Ed.) Pharmacophore Perception, Development, and Use in Drug Design, International University Line, La Jolla, CA, 2000, pp. 49-68.
4. Martin, Y.C., Bures, M.G., Danaher, E.A., DeLazzer, J., Lico, I. And Pavlik, P.A., J. Comput.-Aided Mol. Design, 7 (1993) 83.
5. Barnum, D., Greene, J., Smellie, A. and Sprague, P., J. Chem. Inf. Comput. Sci., 36 (1996) 563.
6. Clement, O.O. and Mehl, A.T., In Güner, O.F (Ed.) Pharmacophore Perception, Development, and Use in Drug Design, International University Line, La Jolla, CA, 2000, pp. 69-84.
8. Smellie, A., Teig, S.L. and Towbin, P., J. Comp. Chem., 16 (1995) 171.
9. Jones, G., Willett, P. and Glen, R.C. In: Güner, O.F (Ed.) Pharmacophore Perception, Development, and Use in Drug Design, International University Line, La Jolla, CA, 2000, pp. 85-106.
10. Jones, G., Willett, P. and Glen, R.C., J. Comput.-Aided Mol. Design, 9 (1995) 532.
11. The Protein Bata Bank is available from the Cambridge Crystallographic Data Centre, 12, Union Road. Cambridge. CB2 1EZ. UK.
12. Relibase+ is available from the Cambridge Crystallographic Data Centre, 12, Union Road. Cambridge. CB2 1EZ. UK.
13. The steric COMFA hierarchical clustering procedure in Sybyl, available from Tripos Inc. St. Louis, US.
14. Catalyst is available from Accelrys, 9685 Scranton Road, San Diego, CA 92121, US. Version 4.6 was used here.
15. DISCO is available from Tripos Inc. 1699 South Hanley Road, St. Louis, MO 63144-2913, US. (DISCO for Sybyl 6.7 was used here).
16. GASP is available from Tripos Inc. 1699 South Hanley Road, St. Louis, MO 63144-2913, US.
17. CONCORD is available from is available from Tripos Inc. 1699 South Hanley Road, St. Louis, MO 63144-2913, US.
18. The GASP manual. Tripos Inc. 1699 South Hanley Road, St. Louis, MO 63144-2913, US.
19. Banner, D.W. and Hadváry, P., J. Bio. Chem.,266 (1991) 20085.
20. Mathews, I.I., Padmanabhan, K.P. and Tulinsky, A., Biochemistry, 33 (1994) 13547.
22. Katz, B.A., Clark, J.M., Finer-Moore, J.S., Jenkins, T.E., Johnson, C.R., Ross, M.J., Luong, C., Moore, W.R., and Stroud, R.M., Nature, 39 (1998) 608.
23. Lyle, T.A., Chen, Z., Appleby, S.D., Freidinger, R.M., Gardell, S.J., Lewis, S.D., Li, Y., Lyle, E.A., Lynch Jr., J.J., Mulichak A.M., Ng, A.S., Naylor-Olsen, A.M. and Sanders, W.M., Bioorg. Med. Chem. Letters, 7 (1997) 67.
24. Krishnan, R., Zhang, E., Hakansson, K., Arni, R.K., Tulinsky, A., Lim-Wilby, M.S.L., Levy, O.E., Semple, J.E. and Brunck, T.K., Biochemistry, 37 (1998) 12094.
25. Wagner, J., Kallen, J., Ehrhardt, C., Evenou, J.-P. and Wagner, D., J. Med. Chem.,41 (1998) 3664.
26. Conti, E., Rivetti, C., Wonacott, A. and Brick, P., FEBS Letters, 425 (1998) 229.
27. Jhoti, H., Cleasby, A., Reid, S., Thomas, P.J., Weir, M. and Wonacott, A., Biochemistry,38 (1999) 7969.
28. Jeffrey, P. D., Russo, A. A., Polyak, K., Gibbs, E., Hurwitz, J., Massague, J., and Pavletich, N.P., Nature, 376 (1995) 313.
29. Lawrie, A. M., Noble, M. E., Tunnah, P., Brown, N. R., Johnson, L. N. and Endicott, J. A., Nat. Struct. Biol., 4 (1997) 796.
30. Shewchuk, L., Hassell, A., Wisely, B., Rocque, W., Holmes, W., Veal, J. and Kuyper, L. F., J. Med. Chem., 43 (2000) 133.
31. Arris, C. E., Boyle, F. T., Calvert, A. H., Curtin, N. J., Endicott, J. A., Garman, E. F., Gibson, A. E., Golding, B. T., Grant, S., Griffin, R. J., Jewsbury, P., Johnson, L. N., Lawrie, A. M., Newell, D. R., Noble, M. E. M., Sausville, E. A., Schultz, R. and Yu, W., J. Med.Chem., 43 (2000) 2797.
33. Oefner, C., DArcy, A. and Winkler, F.K., Eur. J. Biochem.,174 (1988) 377.
34. Davies, J.F., Delcamp, T.J., Predergast, N.J., Ashford, V.A., Freisheim, J.H. and Kraut, J. Biochemistry, 29 (1990) 9467.
35. Lewis, W.S., Cody, V., Galitsky, N., Luft, J.R., Pangborn, W., Chunduru, S.K., Spencer, H.T., Appleman, J.R. and Blakley, R.L., J. Bio. Chem.,270 (1995) 5057.
36. Cody, V., Galitsky, N., Luft., J.R., Pangborn, W., Rosowsky, A. and Blakley, R.L., Biochemistry, 36 (1997) 13897.
37. Gangjee, A., Vidwans, A.P., Vasudevan, A., Queener, S.F., Kisliuk, R.L., Cody, V., Li, R., Galitsky, N., Luft, J.R., and Pangborn, W., J. Med. Chem., 41 (1998) 3426.
38. Hsiou, Y., Das, K., Ding, J., Clark Jr., A.D., Kleim, J-P., Rösner, M., , Winkler, I., Riess, G., Hughes S.H. and Arnold, E., J. Mol. Biol., 284 (1998) 313.
39. Ren, J., Diprose, J., Warren, J., Esnouf, R.M., Bird, L.E., Ikemizu, S., Slater, M., Milton, J., Balzarini, J., Stuart, D.I. and Stammers, D.K., J. Biol. Chem., 275 (2000) 5633.
40. Esnouf, R.M., Ren J., Hopkins, A.L., Ross, C.K. Jones, E.Y., Stammers, D.K. and Stuart, D.I., Proc. Natl. Acad. Sci., 94 (1997) 3984.
41. Hopkins, A.L., Ren, J., Esnouf, R.M., Willcox, B.E., Jones, E.Y., Ross, C., Miyasaka, T., Walker, R.T., Tanaka, H., Stammers, D.K. and Stuart, D.I., J. Med. Chem., 39 (1996) 1589.
42. Ren, J., Esnouf, R.M., Hopkins, A.L., Jones, E.Y., Kirby, I., Keeling, J., Ross, C.K., Larder, B.A., Stuart, D.I. and Stammers, D.K., Proc. Natl. Acad. Sci., 95 (1998) 9518.
43. Ren, J., Esnouf, R.M., Hopkins, A.L., Warren, J., Balzarini, J., Stuart, D.I. and Stammers, D.K., Biochemistry, 37 (1998) 14394.
45. Ren, J., Nichols, C., Bird, L.E., Fujiwara, T., Sugimoto, H., Stuart, D.I. and Stammers, D.K., J. Biol. Chem., 275 (2000) 14316.
46. Ren, J., Milton, J., Weaver, K. L., Short, S. A., Stuart, D. I., and Stammers, D. K., Structure, 8 (2000) 1089.
47. Ren, J.S., Esnouf, R., Garman, E., Somers, D., Ross, C., Kirby, I., Keeling, J., Darby, G., Jones, Y., Stuart, D., and Stammers, D., Nat. Struct. Biol., 2 (1995) 293.
48. Hausrath, A.C. and Matthews, B.W., J. Biol. Chem., 269 (1994) 18839.
49. Gaucher, J.F., Selkti, M., Tiraboschi, G., Prangé,T., Roques, B. P., Tomas, A. and Fournié-Zaluski, M.C., Biochemistry, 38 (1999)12569.
50. Marchand-Geneste, N., Watson, K.A., Alsberg, B.K. and King, R.D., J. Med. Chem.,
45(2002) 399.
51. Holmes, M.A., and Matthews, B.W., Biochemistry, 20 (1981) 6912.
52. Holmes, M.A., Tronrud, D.E., and Matthews, B.W., Biochemistry, 22 (1983) 236.
53. An enhanced program called DISCOtech has recently been launched
Figure Captions
Figure 1. Schematic of the best hypothesis generated by Catalyst for the Thrombin data set. The corresponding pharmacophore created manually from the bound confomration of 1c4v is also shown for comparsion.
Figure 2. The best hypotheses for Thrombin: Manually generated pharmacophore that
represents the target pharmacophore (top left); the best hypothesis generated for Catalyst (top right); GASP (bottom left); and DISCO (bottom right).
Figure 3. The best hypotheses for CDK2: Manually generated pharmacophore that represents the target pharmacophore (top left); the best hypothesis generated for Catalyst (top right); GASP (bottom left); and DISCO (bottom right).
Figure 4. The best hypotheses for DHFR: Manually generated pharmacophore that represents the target pharmacophore (top left); the best hypothesis generated for Catalyst (top right); GASP (bottom left); and DISCO (bottom right).
Figure 5. The best hypotheses for HIV-RT: Manually generated pharmacophore that
represents the target pharmacophore (top left); the best hypothesis generated for Catalyst (top right); GASP (bottom left); and DISCO (bottom right).
Figure 6. The best hypotheses for Thermolysin: Manually generated pharmacophore that represents the target pharmacophore (top left); the best hypothesis generated for Catalyst (top right); GASP (bottom left); and DISCO (bottom right).
Protein Family Number of Ligands
Thrombin 7
Dihydrofolate Reductase (DHFR) 6
HIV-1 Reverse Transcriptase (HIV-RT) 10
Thermolysin 6
B H1 D1 H2 A1 H3 N N N N O N N O O B H1 D1 A1 H3 H2 N N N N O N N O O B H1 D1 A1 H3 H2 1c4v B H1 D1 H2 A1 H3 N O N N O N B H1 D1 H2 A1 H3 N O N N O N 1tom N N N S O O N N O O N O N H3 A1 H2 H1 D1 B N N N S O O N N O O N O N H3 A1 H2 H1 D1 B 1d6w A1 H3 H2 H1 B N N O N N N S O O O O H3 A1 H3 H2 H1 B N N O N N N S O O O O A1 H3 H2 H1 B A1 H3 H2 H1 B N N O N N N S O O O O H3 1d9i S O O N N O N O N N H1 B H2 A1 H3 S O O N N O N O N N H1 B H2 A1 H3 1dwd C+ N N N N O N S O O N H3 H2 H1 B A1 C+ N N N N O N S O O N H3 H2 H1 B A1 1fpc N N N O N B H1 H2 H3 N N N O N B H1 H2 H3 1d4p
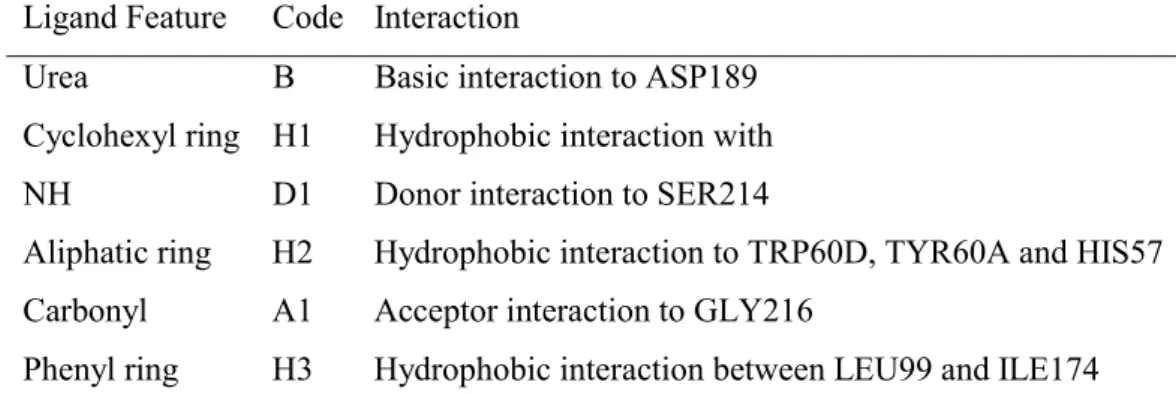
Ligand Feature Code Interaction
Urea B Basic interaction to ASP189 Cyclohexyl ring H1 Hydrophobic interaction with NH D1 Donor interaction to SER214
Aliphatic ring H2 Hydrophobic interaction to TRP60D, TYR60A and HIS57 Carbonyl A1 Acceptor interaction to GLY216
Phenyl ring H3 Hydrophobic interaction between LEU99 and ILE174
B H1 D1 H2 A1 H3 Target Fit Misses Rank Catalyst
Rigid
u
Catalyst Rigid
u u
Catalyst Flexible
D u 2 2
GASP Rigid
D u u
GASP Flex1
u u u u u
GASP Flex2
A u u
GASP Flex3
D u u
DISCO Rigid1
D/A X
DISCO Rigid2
D/A X
DISCO Rigid3
D/A X
DISCO Flex
D/A X
Ligand No. Conformers: Catalyst
No. Conformers: DISCO
1d6w 174 80
1fpc 252 80
1c4v 176 80
1tom 147 80
1d4p 100 80
1d91 173 80
1dwd 238 80
Table 5. Number of conformers generated for the thrombin data set by Catalyst (max 255 per ligand) and DISCO (max 80 per ligand).
Subset Ligands
1 1tom; 1dw6; 1c4v; 1fpc 2 1d9i; 1dwd; 1d4p 3 1d9i; 1dwd
D1 A1 D2 H1 D3 D1 N H N N O NH O O A1 H1 D1 N H N N O NH O O A1 H1 N H N N O NH O O A1 H1 1aq1 O N N N N N H2 O H OH O PO
O H O
P O O H
O PO O H OH D1 A1 H1 O N N N N N H2 O H OH O PO
O H O
P O O H
O PO O H OH D1 A1 H1 1fin N N N NH2
NH2 O O D1 A1 H1 D2 N N N NH2
NH2 O O D1 A1 H1 D2 1elx N N N NH NH2 O D1 A1 H1 D2 N N N NH NH2 O D1 A1 H1 D2 1elv N N O O N H O H A1 H1 D3 N N O O N H O H A1 H1 D3 1di8 D1 S O O N H N N H N H S N O A1 H1 D2 D3 D2 D1 S O O N H N N H N H S N O A1 H1 D2 D3 D2 S O O N H N N H N H S N O A1 H1 D2 D3 S O O N H N N H N H S N O A1 H1 D2 D3 D2 1fvv
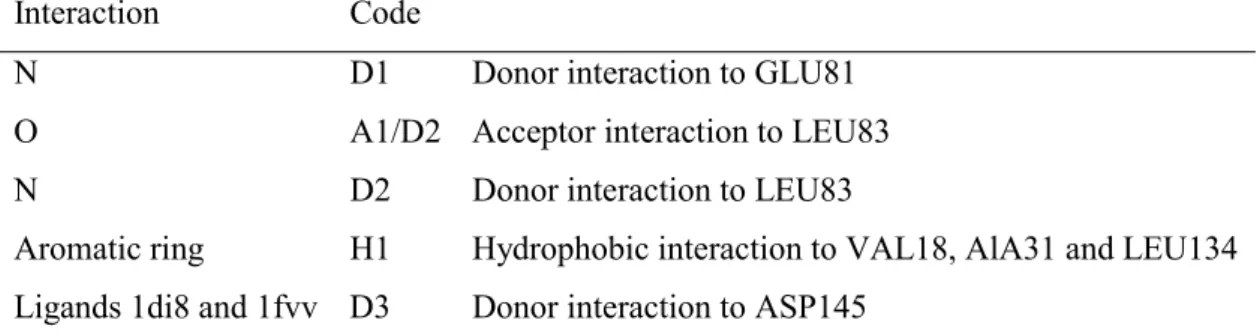
Interaction Code
N D1 Donor interaction to GLU81
O A1/D2 Acceptor interaction to LEU83
N D2 Donor interaction to LEU83
Aromatic ring H1 Hydrophobic interaction to VAL18, AlA31 and LEU134 Ligands 1di8 and 1fvv D3 Donor interaction to ASP145
D1 A1 D2 H1 D3 Target Fit Misses Rank Catalyst
Rigid
1.331 4a -
Catalyst Flex GASP Rigid GASP Flex1 GASP Flex2 GASP Flex3 GASP Flex4
x
DISCO Rigid DISCO Flex
Ligand No. Conformers: Catalyst
No. Conformers: DISCO
1aq1 13 80
1di8 22 11
1e1v 62 80
1e1x 123 80
1fin 250 80
1fvv 70 80
Table 10. Number of conformers generated for the CDK2 data set by Catalyst (max 255 per ligand) and DISCO (max 80 per ligand).
Subset Ligands
1 1elv; 1e1x; 1fvv 2 1aq1; 1fin 3 1di8; 1aq1; 1fin 4 1di8; 1fvv
D1 A1 D2 D3 H1 H2 A2 A3 D4
D1 HN N N N N H2 O N H N H OO OH
OH O A2 H2 H1 A1 D1 HN
N N N N H2 O N H N H OO OH
OH O A2 H2 H1 A1 N H N N N N H2 O N H N H OO OH
OH O A2 H2 H1 A1 1drf N H N N H N H2 O N H N H OO OH
OH O D4 A3 A2 H2 H1 D1 HN
N N H N H2 O N H N H OO OH
OH O D4 A3 A2 H2 H1 N H N N H N H2 O N H N H OO OH
OH O D4 A3 A2 H2 H1 D1 A1 2dhf N N H OO OH
OH O O N N N H2 NH2 D4 A2 H2 H1 D2/D3 A1 D1 A3 N N H OO OH
OH O O N N N H2 NH2 D4 A2 H2 H1 D2/D3 A1 D1 A3 1hfp N N N N N H2 NH2 N H N H OO OH
O O OH A3 D4 A2 H2 H1 D2/D3 D1 A1 N N N N N H2 NH2 N H N H OO OH
O O OH A3 D4 A2 H2 H1 D2/D3 D1 A1 1ohk N N N N H2 NH2 N O O D1 A1 D2/D3 H1 H2 N N N N H2 NH2 N O O D1 A1 D2/D3 H1 H2 1boz A1 D2/D3
D1 H1 H2
N
N N N H2
NH2 O
O A1
D2/D3
D1 H1 H2
N
N N N H2
NH2 O
O D2/D3
D1 H1 H2
D2/D3
D1 H1 H2
N
N N N H2
NH2 O
O
1dlr
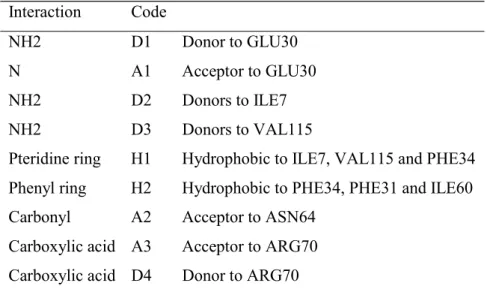
Interaction Code
NH2 D1 Donor to GLU30
N A1 Acceptor to GLU30
NH2 D2 Donors to ILE7 NH2 D3 Donors to VAL115
Pteridine ring H1 Hydrophobic to ILE7, VAL115 and PHE34 Phenyl ring H2 Hydrophobic to PHE34, PHE31 and ILE60 Carbonyl A2 Acceptor to ASN64
Carboxylic acid A3 Acceptor to ARG70 Carboxylic acid D4 Donor to ARG70
D1 A1 D2 D3 H1 H2 A2 A3 D4 Target Fit Misses Rank Catalyst
Rigid
u
Catalyst Flex 1
X
Catalyst Flex 2
X
GASP Rigid GASP Flex1
u
GASP Flex2 GASP Flex3 DISCO Rigid 1 DISCO Rigid 2 DISCO Flex 1 DISCO Flex 2
Ligand No. Conformers: Catalyst
No. Conformers: DISCO
1boz 112 14
1drl 238 19
1ohk 217 80
1dlr 16 80
1hfp 255 80
2dhf 206 80
Table 15.Number of conformers generated for the DHFR data set by Catalyst (max 255 per ligand) and DISCO (max 80 per ligand).
Subset Ligands 1 1drf; 2dhf 2 1hfp; 1ohk 3 1boz; 1dlr
Ligand D A H Ligand D A H N H F F F O H D A N H F F F O H
D A 1fk9
N O N O Cl Cl H H N O N O Cl Cl H H 1vru O S N H Cl N O D H H A O S N H Cl N O D H H A 1rt5 N N N N O O O H N N N N O O O H 1rt3 N H N O N S O O N N N A H H N H N O N S O O N N N A H H 1klm N H N O O O H N H N O O O H D 1rt1 N N N N O F S Cl H H D A N N N N O F S Cl H H D A 1dtt N H N N S Cl H D N H N N S Cl H D 1tvr Cl Cl S N N N O NH2
O H H D A Cl Cl S N N N O NH2
O H H D A 1ep4 N H S O O S O A D H H N H S O O S O A D H H 1bqm
Interaction Code
NHa D Donor to LYS103 or LYS101
C=Oa A Acceptor to LYS103 or LYS101 Large hydrophobic
region
H Hydrophobic interaction with TYR188; TYR181; RP229; PHE227; LEU100; LEU234; VAL106; TYR318
Table 18. The key interactions involved in binding to HIV-RT are described based on ligand 1klm as reference. a thedonor/acceptor interactions in 1ep4 and 1klm are to LYS103 whereas the other ligands have identical interactions to LYS101. The ligands generally have a
D A H Target Fit Misses Rank Catalyst Rigid
Catalyst Flex 1 X
Catalyst Flex 2 GASP Rigid 1
GASP Rigid 2
GASP Flex 3 u GASP Flex 4
GASP Flex 5 GASP Flex 6 GASP Flex 7 DISCO Rigid DISCO Flex 1
DISCO Flex 2 u DISCO Flex 3
DISCO Flex 4 X
DISCO Flex 5
No conformers: Catalyst
No conformers: DISCO 1fk9
1vru 1rt3 1bqm
1tvr 1rt1 1rt5 1klm 1ep4
1dtt
Table 20. No. of conformers generated for the HIV-RT data set by Catalyst (max 255 per ligand) and DISCO (max 100 per ligand).
Subset Ligands
1 1dtt, 1klm, 1rt5 2 1fk9, 1bqm, 1klm
Table 21a. GASP subsets used in the Rigid Searches.
Subset Ligands
3 1bqm, 1fk9, 1klm 4 1dtt, 1rt5
5 1rt3, 1vru 6 1ep4, 1klm 7 1tvr, 1rt1
M A1 H A2 D1 D2 A3 D3 A4 OH O O O H A1 A2 M H OH O O O H A1 A2 M H 1hyt O N O OH O A1 A2 M M H O N O OH O A1 A2 M M H 7tln N H O N H OH O O SH A2 M M A3 D2 D1 H A1 N H O N H OH O O SH A2 M M A3 D2 D1 H A1 1qf1 O N H OH N H N H O H O O A1 A2 M H A3 D2 D1 O N H OH N H N H O H O O A1 A2 M H A3 D2 D1 5tln O NH PNH O O H O N H O O OH A1 A2 M M H H A3 D1 D2 O NH PNH O O H O N H O O OH A1 A2 M M H H A3 D1 D2 5tmn N H O O P O H O NH NH O O OH A1 A2 M M H A3 D2 D3 A4 D1 N H O O P O H O NH NH O O OH A1 A2 M M H A3 D2 D3 A4 D1 4tmn
Interaction Code Bidentate chelation with Zn+
(O or S)
M
C=O H-bond acceptor A1 H-bond with ARG203
Hydrophobe H Hydrophobic interaction with LEU133; VAL139; ILE188; LEU202
Oxygen H-bond acceptor A2 H-bond with GLU143 N-H H-bond donor D1 H-bond with ALA113 N-H H-bond donor D2 H-bond with ASN112 C=O H-bond acceptor A3 H-bond with ASN112 N-H H-bond donor D3 H-Bond with TYR157 C=O H-bond acceptor A4 H-bond with TRP115
M A1 H A2 D1 D2 A3 D3 A4 Target Fit1 Misses1 Rank
Catalyst Rigid
X
Catalyst Flex
X
GASP Rigid
P u
GASP Rigid
X
GASP Flex1
u
GASP Flex2
P X
GASP Flex3 GASP Flex4
P u X
DISCO Rigid DISCO Flex 1
X
DISCO Flex 2
X